Received March 10, 2000 / Accepted December 25, 2001
Rajaram P. Kane
Instituto Nacional de Pesquisas Espacias - INPE Caixa Postal 515, 12201-970 - São José dos Campos, SP, Brazil
The rainfall series at Fortaleza, Ceara, NE Brazil for the four seasons DJF, MAM (main rainy season), JJA, SON were poorly intercorrelated (correlation 0.45 or less, common variance only ~20%). The relationship with El Niños was poor, with only about half of the El Niños associated with droughts. Among the El Niños, Unambiguous ENSOW had a better affinity for droughts, more so for DJF. But some droughts occurred in the abscence of El Niños and even during La Niña years, and some excess rains occurred during El Niño years. A large interference from other factors (mostly Atlantic SST etc.) unrelated to the ENSO phenomenon is obvious. The media seems to be giving undue importance to El Niño and La Niña only, which needs to be diluted.
Key words: El Niño; Fortaleza; Rainfall.
INTERCORRELAÇÕES E RELAÇÕES COM A ENSO DA PRECIPITAÇÃO EM FORTALEZA EM DIFERENTES ESTAÇÕES - As séries de precipitação em Fortaleza, Ceará, nordeste do Brasil para as quatro estações DJF, MAM (principal estação chuvosa), JJA, SON estão pobremente intercorrelacionadas (correlação de 0,45 ou menos, variância comum de apenas ~20%). A relação com os El Niños foi pobre, com apenas cerca da metade dos El Niños associados com secas. Entre os El Niños, ENSOs não ambíguos têm melhor afinidade para secas, mais para DJF. Mas algumas secas ocorreram na ausência de El Niños e mesmo durante anos de La Niña, e algum excesso de chuvas ocorreu durante anos de El Niño. Uma larga interferência de outros fatores (principalmente SST Atlântico, etc.) não correlacionados ao fenômeno ENSO é óbvia. Parece que a mídia está dando importância indevida ao El Niño e à La Niña apenas, que precisam ser diluídos.
Palavras-chave: El Niño; Fortaleza; Precipitação.
INTRODUCTION
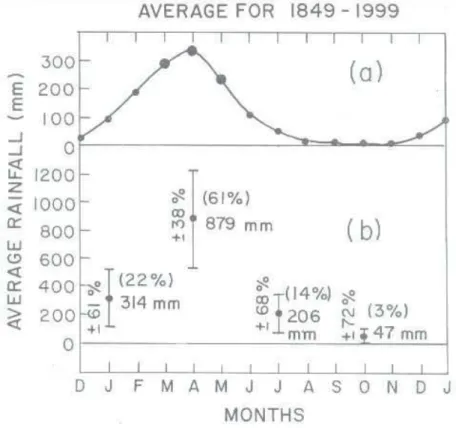
The main rainy season at Fortaleza, Ceara in NE Brazil is MAM (March, April, May). Fig. 1 (a) shows the average rainfalls (climatology) in various months, while Fig. 1 (b) shows the seasonal details for seasons MAM, DJF (December, January, February), JJA (June, July, August), SON (September, October, November), which are also given in Table 1.
200 Interrelationship and Enso Relationship of Fortaleza Rainfall in Different Seasons
Revista Brasileira de Geofísica, Vol. 19(2), 2001
check whether all seasonal rainfalls vary in a similar way and have similar El Niño associations.
DATA
Rainfall data for Fortaleza (3o 42’ S, 38o 31’W)
Ceara, north-east Brazil were obtained from FUNCEME (Fundação Cearense de Meteorologia e Recursos Hídricos). El Niño years were obtained from the list in Quinn et al. (1987). SST (sea surface temperature) anomaly data for Puerto Chicama (Peruvian coast, 8o S, 80o W) were obtained from
Deser and Wallace (1987) and from private communications from Dr. Todd Mitchell and Dr. Don Garrett (also available at http:// tao.atmos.washington.edu/data_sets/chicama_sst/). Data for SST anomalies for the Pacific regions, Nino 1+2 (0o –10o S, 90o W-80o W), Nino 3 (5o N-5o S,
150o W-90o W), Nino 3.4 (5o N-5o S, 170o W-120o
W) and Nino 4 (5o N-5o S, 160o E-150o W) were
obtained from the Web site of the Climate Prediction Center (CPC) of the National Oceanic and Atmospheric Administration (NOAA), Washington D. C. (http:/www.cpc.ncep.noaa.gov/data/indices). Figure 1 - a) Average monthly variation of Fortaleza rainfall for 1849-1999; b) Characteristics of the 4 seasons DJF, MAM, JJA, SON.
PROCESSING OF RAINFALL DATA AT FORTALEZA: INTERCORRELATIONS
All data of any particular season were expressed in normalized units (deviations from mean of the series of that season, divided by the standard deviation of the series of that season). It was noticed that the deviations were generally not similar for all the seasons. An intercorrelation analysis gave results shown in Table 2. Since Puerto Chicama SST anomalies were available only from 1925 onwards, the correlations were obtained separately for 1849-1924 (Table 2 a) and for 1925-1999 (Table 2b). As can be seen, the correlations are low, the maximum being 0.45 ± 0.09 between MAM and JJA during 1849-1924, explaining only ~20% (square of 0.45) of variance. Thus, the rainfalls in the various seasons have anomalies almost independent of each other. In their prediction schemes for NE Brazil seasonal (March-June) rainfall, Hastenrath and Greischar (1993) used five potential predictors, one of which was the pre-season October-January rainfall , for which the training period (1921-1957) correlation was + 0.55, significant at a 1% level. In the case of Fortaleza, the value of the correlation is lower, reducing its prediction potential.
SIMILARITIES AND DISSIMILARITIES OF THE RAINFALL EXTREMES
Extremes of the rainfall anomalies (magnitudes exceeding 1.0 σ) in DJF and/or the succeeding MAM fell into four categories : Similar variations, either (i) DJF and MAM positive or (ii) DJF and MAM negative, and dissimilar variations, (iii) DJF positive, MAM negative or (iv) DJF negative, MAM positive. Table 3 gives the years and rainfall anomaly values in these four categories, for DJF, MAM and JJA seasons. The rainfalls in SON are very small and are not considered here.
There are many more events in category (a) when DJF and MAM were similar and these would yield a positive correlation, but the events in category (b) when DJF and MAM are dissimilar, would reduce the correlation. Hence the overall value of the correlation was only ~+0.45 or less. The JJA values were sometimes like MAM and sometimes like DJF, but in events of category (ii) when DJF and MAM were both negative, JJA also was mostly negative, indicating long-lasting droughts in these years. Some of these are El Niño years (shown bold), but El Niño years appear in other categories also (i), (iii), (iv). Thus, El Niño effects are complicated, as discussed further.
RELATIONSHIP WITH EL NIÑO EVENTS
(A) Relationship with a finer classification of El Niños
El Niños are popularly believed to be associated with droughts in many parts of the world, notably Indonesia, India and northeast Brazil. El Niños (positive temperature anomalies) generally start near the Peru-Ecuador coast (for example, at Puerto Chicama, 8o S, 80o W) and spread westward in the
Pacific within a month or two. During the El Niño years, the Southern Oscillation Index SOI (represented by Tahiti minus Darwin atmospheric pressure difference T-D) has a minimum. However, not all El Niños seem to be effective. Recently, Kane (1997a,b; 1998a,b,c; 1999 a,b) attempted a finer classification in which Unambiguous ENSOW type events were found to be overwhelmingly associated with droughts in India, southeastern Australia and some other regions. These were El Nino (EN) years (Quinn et al., 1987 list), during which the 12-month running means of the Southern Oscillation Index SOI (represented by Tahiti minus Darwin atmospheric pressure difference T-D) had a minimum (SO) and the equatorial eastern Pacific sea surface temperatures
202 Interrelationship and Enso Relationship of Fortaleza Rainfall in Different Seasons
Revista Brasileira de Geofísica, Vol. 19(2), 2001
SST had a maximum (W) in the middle of the calender year. If the maxima were not in the middle of the calender year but in the beginning or end, the events were called Ambiguous ENSOW. El Niño events not falling into these two categories were called Other EN. However, there were years without El Niños (i.e., not in the Quinn et al., 1987 list) and these were of the types (i) only SO or only W, (ii) SOW, (iii) C (colder SST, anti-El Niño, also called La Niña), (iv) SOC (SO in the earlier part of the year, followed by C in later part) and (v) Non-events. Table 4 shows the rainfall status of the DJF, MAM, JJA, SON seasons at Fortaleza for El Niño years of the types (a) Unambiguous ENSOW, (b) Ambiguous ENSOW, (c) Other El Niños, (d) All El Niños. The All India summer monsoon rainfall status (IMR) is also given,
for comparison. Instead of giving the actual rainfall normalised deviations, data are presented by 6 symbols representing broad groups. Thus, +, f, F represent positive deviations in the ranges 0 to 0.5 σ; 0.5 to 1.0 σ and, exceeding 1.0 σ respectively,
while -, d, D represent negative deviations in the ranges 0 to –0.5 σ, -0.5 to –1.0 σ and, exceeding – 1.0 σ respectively. The symbols S (strong), M (Moderate), W (Weak) indicate the strength of the El Niño as given by Quinn et al. (1987), while I and II indicate the first and second years of double events (El Niños in two consecutive years, 1957-1958 etc.).
(1) As can be seen in Table 4 (a) for the 16 events of type Unambiguous ENSOW, all had a negative deviation for Indian rainfall (IMR), indicating
Table 3 - Years when rainfall anomalies in DJF and/or MAM seasons were extremes (both DJF and MAM exceeding 1.0 σ,
or any one exceeding 1.5σ) and a) when DJF and MAM were similar and b) when DJF and MAM were dissimilar. Years
Table 4 - Rainfall status of the Indian rainfall (IMR) and the DJF, MAM, JJA, SON seasons at Fortaleza for El Niño years of the types a) Unambiguous ENSOW, b) Ambiguous ENSOW, c) Other El Niños, d) All El Niños. Symbols +, f, F represent positive deviations in the ranges 0 to 0.5 σ, 0.5 to 1.0 σ and, exceeding 1.0 σ, while -, d, D represent negative deviations in the ranges 0 to – 0.5 σ, -0.5 to –1.0 σ and, exceeding –1.0 σ. S (strong), M (Moderate), W (Weak) indicate the strength of the El Niño as given by Quinn et al. (1987), while I and II indicate the first and second years of double events (El Niños in two consecutive years, 1957-1958 etc.).
an overwhelming affinity for negative deviations (droughts). The ratio of (Negative/ Total) was 1.00. For DJF (Fortaleza) also, the ratio was quite high (0.81, 13 out of 16 events negative), but for MAM (Fortaleza), the ratio was smaller (0.62). Thus, the relationship of Unambiguous ENSOW was much better with pre-season DJF rainfall than with main-season MEM rainfall. Considering that there would be
roughly equal numbers of positive and negative deviations by random chance (Ratio Negative/ Total=0.50), MAM and SON (ratios 0.62) had only a slight bias for droughts while JJA (ratio 0.56) had a very poor relationship.
204 Interrelationship and Enso Relationship of Fortaleza Rainfall in Different Seasons
Revista Brasileira de Geofísica, Vol. 19(2), 2001
mild droughts, 1925 and 1992. Many of the events were II year events, thus indicating that for India, the II year events would not be associated with droughts and may even have excess rains. This was dramatically confirmed in the recent 1997-1998 El Niño, which was strongest in known history, had large SST anomalies during the Indian monsoon period June-September, but the anomalies reached maximum only by 1997 end and hence, both 1997 and 1998 qualified as Ambiguous ENSOW. Therefore, no droughts were expected in India in 1997 and 1998, and none occurred. For DJF and MAM at Fortaleza, ratios were 0.58, indicating poor relationship, but the II year events mostly had droughts. Thus, for Fortaleza, the II year events were favourable for droughts in pre- and main-rainy season. This was confirmed in 1997-1998, when 1998 had severe droughts. Incidentally, for the JJA and SON seasons, the ratios were high (0.74 and 0.89), indicating that the post-season rainfalls were likely to be deficit during Ambiguous ENSOW, including during the II years.
(3) Table 4 (c) for Other EN consists other El Niños of four types:
(i) ENSOs, when SO existed but Pacific temperatures were normal (no W). There were 6 events and Indian rainfall was mostly deficit, as if these were Unambiguous ENSOW. For Fortaleza, results were mixed, droughts in some events and excess rains in others.
(ii) ENW, when Pacific was warmer, but SOI was normal (not negative, SO did not exist). There was only one event, with mild excess rains in India and droughts in DJF, MAM, JJA of Fortaleza.
(iii) EN, when an El Niño was listed in Quinn et al. (1987) list, but SO and W did not exist. IMR and Fortaleza showed mixed results, droughts in some events and excess rains in others.
(iv) ENC. There were 6 events. Here, it does not mean that EN (El Niño) and C (La Niña) occurred simultaneously. (This is impossible). What happened was that El Niño existed in the early part of the calender year and a La
Niña followed later. For rainfalls occurring in the early part of the year, the expected effect would be of EN (droughts), while for rainfalls occurring in the latter part of the year, the expected effect would be of C (excess rains). In India, there were mostly excess rains (effect of C), while at Fortaleza, effects were mixed (droughts in 1889, 1907, excess rains in 1917, 1973) in DJF and MAM. The overall ratios were near 0.50, indicating poor relationships, but some events had severe floods, while others had deficit rains. Thus, only Unambiguous ENSOW had significant relationships with droughts. In other cases, results were mixed.
(v) Table 4 (d) shows the results for all El Niños (total 53 events). The ratios are near 0.50, indicating poor relationship if all events are considered.
(B) Evolution of El Niños in the Pacific
The El Niños genearally appear first in the Peru-Ecuador coast and later spread into the Pacific. Fig 2 (a) shows a plot of SST anomalies at Puerto Chicama (Peru coast) at the top, followed by anomalies in regions Nino 1+2, Nino 3, Nino 3.4 and Nino 4, for the El Niño of 1957-1958, for which data were available only from 1950 onwards. As can be seen, the anomaly magnitudes are largest near the coast (80o
W ), decrease to about half in the Nino 1+2 region (90o W-80o W), still lesser in the Nino 3.4 region
(170o W-120o W) and still lesser in the Nino 4 region
(160o E-150o W). The commencement (threshold 0.4o
Fig. 2 (c) shows the recentmost giant event of 1997-1998, which shows characteristics similar to those of the 1957-1958 event.
(C) Evolution of Fortaleza rainfall anomalies in individual El Niño events
Stastical results have their own value, but individual events are more illustrative, particularly because El Niños may start in different months (Deser and Wallace, 1987) and may have different implications for rainfalls in different seasons. Many El Niños in the past had started during January or February or March and some statistical results are presented in Kane (2000). Fig. 3 shows the rainfall evolution at Fortaleza during several individual events, one frame of two rows for each event. Since SST anomalies at Puerto Chicama give a reasonably good representation of the El Niño evolution in the Pacific, only SST anomalies at Puerto Chicama are plotted in the first row, and rainfall normalized deviations at Fortleza in the second row. Positive anomalies are painted black and negative anomalies are shown hatched, for both SST and rainfall. Thus, black SST is expected to match with hatched rainfall, and vice versa. The following may be noted in Fig.
3:-(1) Event of 1925-1926: Data for SST are not available for 1924, but the event started probably
in the latter half of 1924. Fortaleza had excess rains in the beginning of 1924, probably because of La Niña conditions at that time. The numbers 1, 2, 3, 4, in succession indicate rainfall deviations for 1 (DJF), 2 (circled, MAM), 3 (JJA), 4 (SON). During the first half of 1925, the El Niño was strong and Fortaleza 2, 3, 4 were negative, as expected. The El Niño weakened and disappeared by February 1926, but droughts prevailed in 1926 and 1927 in all seasons except MAM (not expected).
(2) Events of 1929-1932: There was a mild El Niño in the first half of 1929, a strong El Niño in 1930, La Niña in 1931 and a weak El Niño in the first half of 1932. The rainfalls were largely deficit in all the 4 years in all seasons except DJF of 1931 and 1932. The deficits in 1931 were not expected, as it was a La Niña year.
(3) Event of 1940-1941: Year 1939 was normal, but the rainfalls were highly excess (not expected). The El Niño commenced late in 1940, terminated by middle of 1941, but erupted again mildly and lasted upto 1941 end. But large deficit rains were seen in the whole of 1941 and 1942, in all seasons. The 1942 deficits were unexpected.
(4) Events of 1951 and 1953: These events were preceded by La Niñas in 1950 and 1952. But, except for SON in 1951 and MAM in 1952, the
206
Interrelationship and Enso Relationship of Fortaleza Rainfall in Different Seasons
Revista Brasileira de Geofísica, V
ol. 19(2), 2001
whole period had heavy rain deficits in all seasons (not expected), with poor matching with El Niños. (5) Event of 1957-1958: The event started in February of 1957 and lasted upto April of 1958. But the whole period 1956-1959 had large deficit rains. The deficit in 1956 was unexpected, as 1956 SST was normal.
(6) Event of 1965: This was a moderate event, starting in March 1965 and ending in February 1966. But the whole period was characterised by large excess rains except in JJA of 1963 and DJF of 1966 when large deficits occurred. Years 1964 and 1966 had La Niña conditions, but the overall matching was not good.
(7) Event of 1972: The event started in February of 1972, lasted for about 12 months and was followed by La Niña conditions in 1973-1974. By and large, SST positive anomalies were associated with rainfall deficits, and negative SST anomalies with excess rains, in all seasons. JJA rainfall anomalies showed exceptions.
(8) Event of 1976: This was a moderate event during 1976 only and showed matching moderate rain deficit in 1976. Year 1975 was a La Niña year and showed rainfall excesses. However, 1977 and 1978 were normal SST years but showed abnormal excess rains in JJA and SON (not expected).
(9) Event of 1982-1983: This was a strong event, starting in October 1982 at Puerto Chicama ( but earlier in the Pacific, as shown by the dashed line) and lasting upto late 1983. But there were large rain deficits in 1981 and early 1982 (not expected). Year 1984 was a mild La Niña. The deficit in 1983 and excess in 1984 was as expected.
(10)Event of 1987: This was a moderate event confined to the first half of 1987 and had
a matching rain deficit. Years 1986, 1988 and 1989 had La Niña conditions and had
matching rain excesses.
(11) Event of 1991-1993: There was a mild El Niño in the first few months of 1991, a strong event in the end of 1991 lasting upto the middle of 1992, and again a small event in the first half of 1993. The rainfalls were matching, except in the beginning of 1991 when droughts were expected but did
not occur, and in 1990 when SST was normal, but large rainfall deficits followed by excesses occurred.
(12) Event of 1997-1998: By far the largest event, it commenced in February-March 1997 and ended in June 1998. There were matching rainfall deficits, but there were deficits in late 1996 also, before the El Niño commencements (not expected).
Thus, whereas the rainfall deficits were generally associated with positive SST anomalies and rainfall excesses with negative SST anomalies, there were often rainfall anomalies with no corresponding SST anomalies. Obviously other factors were intervening in some cases. .
(D) Characteristics of years of rainfall extremes
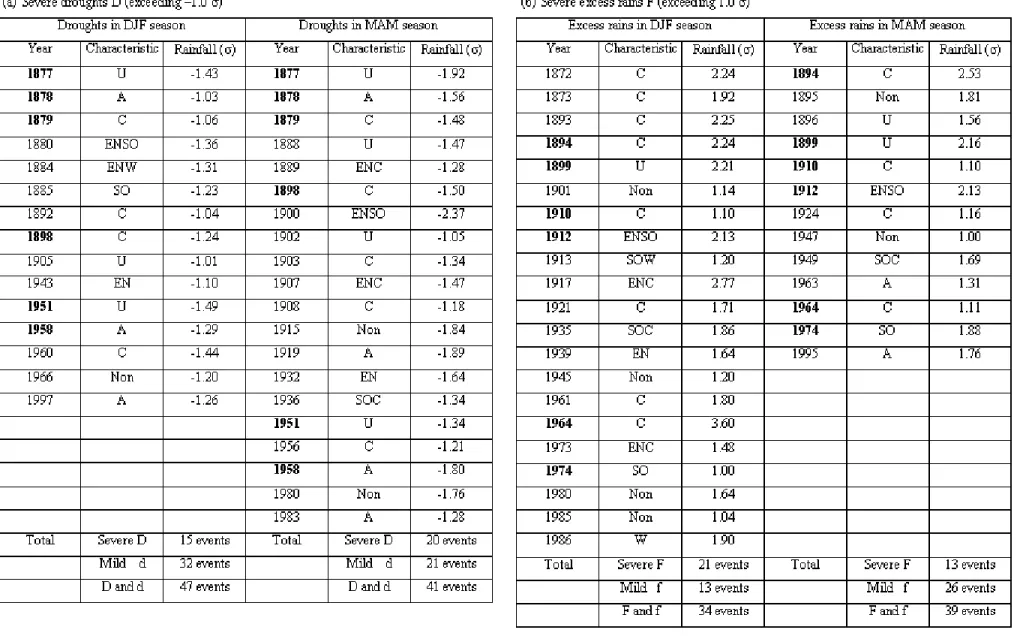
Table 5 lists the years of severe droughts and severe excess rains (deviations exceeding 1.0 σ) in DJF and MAM seasons at Fortaleza, and the corresponding characteristics of these years in our finer classification. Unambiguous ENSOW are denoted as U, Ambiguous ENSOW as A and Non-events as Non..
208
Interrelationship and Enso Relationship of Fortaleza Rainfall in Different Seasons
Revista Brasileira de Geofísica, V
ol. 19(2), 2001
Table 5 - Years of a) severe droughts and b) severe excess rains, (magnitudes exceeding 1.0σ) in DJF and MAM seasons at Fortaleza during 1872-1999, their normalized deviations, and
The relationship of DJF droughts with some El Niños has an interesting aspect. The DJF attributed to any year is of December of the previous year and January, February of the current year. (For example, DJF attributed to 1950 is for December 1949 and January-February of 1950). As such, the DJF rainfall is centered in the January of the year mentioned and hence, precedes the El Niños, which commence in that year. How can rainfall react to El Niño which commenced later? Does it imply that DJF rainfall deficits can be precursors of El Niños? This needs further investigation. Hastenrath (1990) uses this fact in his regression analysis for rainfall predictions in NE Brazil.
ROLE OF OTHER FACTORS USED FOR PREDICTIONS
Even though the mass media (newspapers, radio, television) refer only to El Niños and La Niñas as having major influences on rainfalls, many in the scientific community are aware of the important roles played by other factors unrelated to ENSO. In India, Himalayan Eurasian snow cover and many other factors are known to affect the rainfall regime and these factors are taken into account for prediction purposes (Thapliyal and Kulshrestha, 1992). Based on these formulations, IMD (India Meteorological Department) issues forecasts by May, applicable to the June-Sept. monsoon season. The forecasts are coming out fairly correct for the last 10 years or more. For NE Brazil, a considerable influence of tropical Atlantic SST was reported long ago (Markham and McLain, 1977). Other factors considered are, 700 mb circulation pattern over the North Atlantic (Namias, 1977), meridional displacement and strength of the Intertropical Convergence Zone (ITCZ) (Hastenrath and Heller, 1977), rainfall systems associated with tropical disturbances moving westward from the Atlantic towards northeast Brazil (Ramos, 1975; Yamazaki and Rao, 1977; Rao et al., 1993), and southern hemisphere cold fronts or their remains moving northward along the northeast coast of Brazil (Kousky and Chu, 1978; Kousky, 1979). There is a well defined large-scale atmospheric circulation pattern related to the sea surface temperature anomalies in the tropical Atlantic (Hastenrath and Heller, 1977;
210 Interrelationship and Enso Relationship of Fortaleza Rainfall in Different Seasons
Revista Brasileira de Geofísica, Vol. 19(2), 2001
in 1996. Using an atmospheric GCM with persisted SST anomalies, Graham (1996) has been forecasting northeast Brazil rainfall since 1993. For 1996, his forecast proved erroneous. The forecast of Greischer and Hastenrath (1996), using the method of 5 predictors, also proved erroneous for 1996.
In summary, whereas forecasts for earlier years were reasonably correct, forecasts for 1996 were miserably poor in all these methods, probably because of the rapid changes in Atlantic SST during the forecast season, as mentioned by Colman et al. (1997b).
The forecasts for northeast Brazil rainfall for March-May 1997 were mostly of moderately dry conditions (Colman et al., 1997b; Harrison et al., 1997c; Graham, 1997; Greischar and Hastenrath, 1997b). The observed rainfall was a few percent below normal in some parts and normal in others, thus, basically conforming to the above predictions. The El Nino was still strong in January 1998 but was showing signs of weakening. Meanwhile, a dipole was developing in the Atlantic. A forecast given in the Experimental Long-Lead Forecast Bulletin (Colman et. al, 1998) prepared in early March 1998 using February 1998 SST gave the best estimate for the most likely category as WET. However, it was also mentioned that, given the continuing strong El Nino, and the fact that the atmospheric model placed positive (wet) anomalies over the Nordeste, the possibility of a dry or very dry season should also be considered. In the same Bulletin, Greischar and Hastenrath (1998) also predicted wetter than normal conditions but pointed out that the equatorial Pacific SST and the field of the meridional wind component in the Atlantic sector favour drier conditions. Hence, the precipitation should be only slightly above average. In the same Bulletin, Cavalcanti et al. (1998a) reported predictions from CPTEC, INPE, BRAZIL, based on the CPTEC version of the COLA AGCM. Their prediction was of a below average precipitation over much of northeast Brazil, which came true, as the main rainy season in NE north Brazil (March, April, May 1998) suffered one of the severest droughts in known history. The media attributed it to the 1997-98 El Nino. Thus, in spite of the progress in understanding the mechanisms which affect rainfall in NE Brazil, predictions are still hazardous and could be widely in error. For the March-May 1999 rainfall
season of northeast Brazil, Cavalcanti et al. (1998b) and Colman and Davey (1998) predicted excess rainfall and the predictions came partly true. For the March-May 2000 rainfall, predictions are of excess rains (Cavalcanti et al., 1999; Colman and Davey, 1999).
The results presented here are for one location, Fortaleza. However, there is reason to believe that these are applicable to about 100 locations in NE Brazil, near about Fortaleza (Kane, 1999 a,b)
PREDICTION BASED ON
EXTRAPOLATION OF PERIODICITIES
the plot of original values (4-season running means) while the thick line shows the reconstructed values, using the amplitudes and phases of four significant periodicities T= 10.74, 13.60, 19.89, 40.37 seasons i.e., 2.69, 3.40, 4.97, 10.09 years. (Notice that the 7.6-year periodicity obtained in LPEF=30% now split into 4.97 and 10.09 years for LPEF=50%). In Fig. 4 (b), the matching is very good for 1975-1997 (correlation +0.84) and the predictions are of above normal rainfalls for 1999 and 2000, but lower rainfalls for 2001 and 2002. However, it must be remembered that larger the number of periodicities considered, better is the fit for dependent data but worse for the independent data. Also, this method has severe limitations, mainly because of the transient nature of the QBO and QTO (Kane, 1998d), and, if an El Niño developes suddenly by 2000 end or early 2001, the situation may change, with a severe drought in 2001.
CONCLUSIONS
Fortaleza (3o 42’ S, 38o 31’W) Ceara,
north-east Brazil is prone to frequent severe droughts. The rainfalls in each of the seasons DJF (December, January, February), MAM (March, April, May), JJA (June, July, August), SON (September, October, November) for 1849-1999 were expressed in normalised units (deviations from the overall mean rainfall of the series of that season , divided by the standard deviation of the series) and the characteristics studied. The following was
noted:-(1) The four series were poorly intercorrelated. A correlation of +0.45 or less was obtained, implying a common variance of only ~20%
(square of the correlation 0.45). Thus, rainfalls of the four seasons varied almost imdependently, though similar variations were sometimes seen between DJF and MAM. (2) Relationship with El Niños was poor, with only
about half of the El Niños associated with droughts. Among the El Niños, Unambiguous ENSOW had a better relationship, more with DJF than with MAM. But many droughts occurred when there were no El Niños or even during La Niña conditions. Similarly, some La Niña years had excess rains.
(3) Obviously, other factors unrelated to ENSO disrupt the ENSO relationship. Forecasts taking into consideration Atlantic parameters seem to give good results. As such, the undue importance given to El Niño and La Niña in the media needs to be pointed out and diluted.
Since El Niños may commence in different months, the differential behaviour of DJF and MAM rainfall is understandable. El Niños starting in say, March-April, may affect the MAM rainfall but not the DJF rainfall. On the other hand, predictions based on Atlantic parameters are issued from information available in December and hence, the predictions may turn out to be more true for DJF than for MAM. In December 1995, slightly below rainfall was predicted and the DJF rainfall was just normal (+0.03). But the Atlantic conditions changed rapidly in favour of excess rains and the MAM rainfall turned out to be far above normal (+0.96). These hazards in prediction need to be kept in mind. Relying on El Niño alone will certainly be imprudent.
212 Interrelationship and Enso Relationship of Fortaleza Rainfall in Different Seasons
Revista Brasileira de Geofísica, Vol. 19(2), 2001
ACKNOWLEDGEMENTS
Thanks are due to Dr. Todd Mitchell and Dr. Don Garrett for supplying Puerto Chicama SST data, and to Dr. Don Garrett for El Nino and other data through the Web site of Climate Prediction Center, NOAA, NCEP, Washington. This work was partially supported by FNDCT, Brazil under contract FINEP-537/CT.
REFERENCES
Cavalcanti, I. F. A., Pezzi, L. P., Nobre, P., Sampaio, G., & Camargo Jr., H., 1998a. Climate prediction of precipitation in Brazil for the nordeste rainy season, Center for Ocean-Land-Atmosphere Studies (COLA), Calverton, Maryland, Experimental Long-lead Forecast Bulletin 7, No. 1, March 1998, pp. 24-27. Cavalcanti, I. F. A., Pezzi, L. P., Marengo, J.,
Sampaio, G., & Sanches, M. B., 1998b. Climate Prediction of precipitation over South America for DJF 1998/99 and MAM 1999, Center for Ocean-Land-Atmosphere Studies (COLA), Calverton, Maryland, Experimental Long-lead Forecast Bulletin 7, No. 4, December 1998, pp.
Cavalcanti, I. F. A., Marengo, J. A., Castro, C., Sampaio, G., & Sanches, M. B., 1999. Climate Prediction of precipitation over South America for DJF 1999/2000 and MAM 2000 using the CPTEC/COLA AGCM, Center for Ocean-Land-Atmosphere Studies (COLA), Calverton, Maryland, Experimental Long-lead Forecast Bulletin 8, No. 4, December 1999, pp. 43-46. Colman, A., & Davey, M., 1998. Statistical
Prediction of January-June 1999 Rainfall in Northeast Brazil using input from Multiple Regression and Discriminant Analysis, Center for Ocean-Land-Atmosphere Studies (COLA), Calverton, Maryland, Experimental Long-lead Forecast Bulletin 7, No. 4, December 1998, pp. Colman, A., & Davey, M., 1998. Statistical Prediction of January-June 2000 Rainfall in Northeast Brazil using input from Multiple Regression and Discriminant Analysis, Center for Ocean-Land-Atmosphere Studies (COLA), Calverton, Maryland, Experimental Long-lead
Forecast Bulletin 8, No. 4, December 1999, pp.66-69.
Colman, A., Davey, M., Harrison, M., Evans, T. & Evans, R., 1997. Multiple Regression, Discriminant Analysis predictions of Mar-Apr-May 1997 rainfall in northeast Brazil, Climate Prediction Center (CPC), Experimental Long-lead Forecast Bulletin 6, No.1, 97, pp. 29-32, Natl. Cent. for Environ. Predic., Washington, D. C., March 1997.
Colman, A., Davey, M., Harrison, M., & Evans, A., 1998. Prediction of March-April-May 1998 rainfall in northeast Brazil using input from Multiple Regression, Discriminant Analysis and an Atmospheric Global Circulation Model, Center for Ocean-Land-Atmosphere Studies (COLA), Calverton, Maryland, Experimental Long-lead Forecast Bulletin 7, No. 1, March 1998, pp. 75-79.
Deser, C. & Wallace, J. M., 1987. El Nino events and their relation to the Southern Oscillation: 1925-1986, J. Geophys. Res. 92, 14189-14196. Graham, N., 1996. Prediction of precipitation in
northeast Brazil for boreal spring 1996 using an atmospheric GCM with persisted SST anomalies, Climate Prediction Center (CPC) Experimental Long-lead Forecast Bulletin 5, No. 1, pp. 5-6, Natl. Cent. for Environ. Predic., Washington, D. C., March 1996.
Graham, N., 1997. Prediction of precipitation in northeast Brazil for boreal spring 1997 using an atmospheric GCM with persisted SST anomalies, Climate Prediction Center (CPC), Experimental Long-lead Forecast Bulletin 6, No. 1, pp. 23-24, Natl. Cent. for Environ. Predic., Washington, D. C., March 1997.
Greischar, L. & Hastenrath, S., 1997. Multiple Regression and Discriminant Analysis to predict Mar-Apr-May-Jun 1997 rainfall in northeast Brazil, Climate Prediction Center (CPC), Experimental Long-lead Forecast Bulletin 6, No. 1, 33-34, Natl. Cent. for Environ. Predic., Washington, D. C., March 1997.
Studies (COLA), Calverton, Maryland, Experimental Long-lead Forecast Bulletin 7, No. 1, March 1998, pp.80-81.
Harrison, M., Evans, T., Evans, R., Davey, M. & Colman, A., 1997. A dynamical one-month lead seasonal rainfall prediction for March to May 1997 for the north-eastern area of South America, Climate Prediction Center (CPC), Experimental Long-lead Forecast Bulletin 6, No. 1, pp. 25-28, Natl. Cent. for Environ. Predic., Washington, D. C., March 1997.
Hastenrath, S., 1990. Prediction of northeast Brazil rainfall anomalies. J. Climate 3: 893-904. Hastenrath, S. & Druyan, L., 1993. Circulation
anomaly mechanisms in the tropical Atlantic sector during the Northeast Brazil rainy season: Results from the GISS General Circulation model. J. Geophys. Res., 98: 14917-14923.
Hastenrath, S. & Greischar, L., 1993. Circulation mechanisms related to Northeast Brazil rainfall anomalies. J. Geophys. Res., 98: 5093-5102. Hastenrath, S. & Heller, L., 1977. Dynamics of
climate Hazards in northeast Brazil. Q. J. Roy. Meteorol. Soc. 103: 77-92.
Hastenrath, S., Wu M-C & Chu, P-S., 1984. Towards the monitoring and prediction of Northeast Brazil droughts. Q. J. Roy. Meteorol. Soc. 110: 411-425.
Kane, R. P., 1997a. Relationship of El Nino/Southern oscillation and Pacific sea-surface temperature with rainfall in various regions of the globe, Mon. Wea. Rev., 125: 1792-1800.
Kane, R. P., 1997b. On the relationship of ENSO with rainfall over different parts of Australia, Aust. Meteor. Mag., 46: 39-49.
Kane, R. P., 1997c. Prediction of droughts in north-east Brazil: Role of ENSO and use of periodicities, Int. J. Climatol., 17: 655-665.
Kane, R. P., 1998a. Extremes of the ENSO phenomanon and the Indian summer monsoon rainfall, Int. J. Climatol., 18: 775-791.
Kane, R. P., 1998b. ENSO relationship to the rainfall of Sri Lanka, Int. J. Climatol., 18, 859-871. Kane R. P., 1998c. El Niño, Southern Oscillation,
equatorial eastern Pacific sea surface temperatures and summer monsoon rainfall in India. Mausam, 49: 103-114.
Kane, R. P., 1998d. Quasi-biennial and quasi-triennial oscillations in the rainfall of northeast Brazil, Rev. Brasileira Geofisica, 16: 37-52. Kane, R. P., 1999a. Rainfall extremes in some
selected parts of central and south America: ENSO and other relationships reexamined, Int. J. Climatol., 19, 423-455.
Kane, R. P., 1999b. El Niño timings and rainfall extremes in India, southeast Asia and
China. Int. J. Climatol. 19: 653-672.
Kane, R. P., 2000. Relationship between El Niño timings and rainfall extremes in NE
Brazil, São Paulo city and south Brazil. Rev. Bras. Meteorologia, 15, (No.1),
Kane, R. P., & Trivedi, N. B., 1986. Are droughts predictable? , Climatic Change, 8, 209-223. Kousky, V. E., 1979. Frontal influences on Northest
Brazil. Mon. Wea. Rev., 107: 1140-1153. Kousky, V. E. & Chu, P. S., 1978. Fluctuations in
annual rainfall for Northeast Brazil. J. Meteorol. Soc. Japan, 56: 457-465.
Markham, C. G., 1974. Apparent periodicities in rainfall at Fortaleza, CE, Brazil, J. Appl. Meterol. 13: 176-179.
Markham, C. G. & McLain, D., 1977. Sea surface temperature related to rain in Ceara, north-eastern Brazil,Nature 265: 320-323.
Moura, A. D., & Shukla, J., 1981. On the dynamics of droughts in Northeast Brazil: Observations, theory and numerical experiments with a General Circulation model. J. Atmos. Sci. 38: 2653-2675.
Namias, J., 1977. Influences of northern hemisphere general circulation on drought in Northeast Brazil. Tellus 24, 336-342.
Quinn, W. H., Neal, V. T. & Antunes de Mayolo, S. E., 1987. El Nino occurrences over the past four and a half centuries, J. Geophys. Res., 92: 14449-14461.
Ramos, R. P. L., 1975. Precipitation characteristics in the northeast Brazil dry region, J. Geophys. Res., 80: 1665-1678.
214 Interrelationship and Enso Relationship of Fortaleza Rainfall in Different Seasons
Revista Brasileira de Geofísica, Vol. 19(2), 2001
Servain, J. and Seva, M., 1987. On relationship between tropical Atlantic sea surface temperature, wind stress and regional precipitation indices: 1964-1984, Ocean Air Interaction 1: 183-190. Thapliyal, V. & Kulshrestha, S. M., 1992. Recent models for long-range forecasting of southwest monsoon rainfall over India, Mausam 43: 239-248.
Trenberth, K. E., 1998. Development and forecasts of the 1997-98 El Nino: CLIVAR Scientific Issues, Exchanges, 3: 4-14.
Wainer, I. & Soares, J., 1997. North northeast Brazil rainfall and its decadal-scale relationship to wind stress and sea surface temperature, Geophys. Res. Lett., 24: 277-280.
Ward, M. N. & Folland, C. K., 1991. Prediction of seasonal rainfall in the north nordeste of Brazil using eigenvectors of sea-surface temperature, Int. J. Climatol., 711-743.
Yamazaki, Y. & Rao, V. B., 1977. Tropical cloudiness over the south Atlantic Ocean. J. Meteorol. Soc. Japan, 55: 205-207.
CURSO DE PÓS-GRADUAÇÃO EM GEOFÍSICA ESPACIAL
INSTITUTO NACIONAL DE PESQUISAS ESPACIAIS – INPE
Linhas de Pesquisa:
Alta Atmosfera
Eletricidade Atmosférica Geomagnetismo
Ionosfera
Luminescência Atmosférica Magnetosfera-Heliosfera Média e Baixa Atmosfera NOTE ABOUT THE AUTHOR
Dr. Rajaram Purushottam Kane was born in India in 12th November 1926. His earlier education was in Gwalior, Madhya Pradesh, India. He received his B.Sc. in 1946 from Banaras Hindu University, India as a post-graduate student in 1948 and received his PhD. on “Time-variation of Cosmic Ray Intensity near Geomatic Equator” from Bombay University, India in 1953. During 1953-54, he was awarded a Fullbright & Smith-Mundt Fellowship to work with Prof. J. A.