Upstream approaches to reducing
socioeconomic inequalities in
health
Abordagens contracorrente para
reduzir iniqüidades
socioeconômicas em saúde
George A. Kaplan, PhD
Professor and Chair Department of Epidemiology
Director, Center for Social Epidemiology and Population Health School of Public Health
University of Michigan
109 S. Observatory Street
Ann Arbor, Michigan , USA 48109-2029 [email protected]
To be Presented at Round Table V. V Brazilian Epidemiology Congress, Curitiba, PR, Brazil. March 23-27, 2002.
Introduction
There are few epidemiologic observa-tions that are as robust as the association between socioeconomic position, measured in a variety of ways, and risk of disease inci-dence and death1-3. The facts are well known:
• the risk of adverse health outcomes increases with a decreasing level of socioeconomic position;
• this relationship is widespread, being found in most places and during most periods of time;
• generally speaking it is found for all age groups;
• it is found for most, with a few exceptions, health outcomes; and
• while the inverse relationship is ubiquitous, the strength of the association varies between groups, places, and over time. It is also clear that there has been an explosion of interest in the relationship between socioeconomic factors and health outcomes. For example, a search of MEDLINE citations that included one or more of the descriptors “social class, socioeconomic factors, income, or poverty,” revealed a level trend at around 120 publications per month.
From the early 1980’s onward, there was a dramatic increase in the rate of publica-tion with over 220 per month by June of 20004. This 80% increase is undoubtedly an
underestimate as it does not include papers that focus on the links between educational attainment or occupation and health out-comes, and it undoubtedly under represents the literature that is not in English.
arti-cles that eagerly herald great breakthroughs in public health, medicine, and biology that will arise from our expanding knowledge in genomics, bioinformatics, and biomedicine. The description of the human genome mar-ried with rapid advances in biotechnology are thought by many to presage an era in which many of the major sources of disease and disabilities in world populations will be prevented, delayed, or cured. Without a doubt, the increased knowledge of the mo-lecular basis of the pathobiology of disease portends tremendous advances in our un-derstanding and treatment of disease, but it does not seem likely that this new knowl-edge will help us understand socioeconomic inequalities in health or to do anything to reduce them. Nor, is it likely to help us un-derstand some of the major public health events of the last century, such as the dra-matic loss of life expectancy in countries of Eastern Europe following the break up of the Soviet Union5-7. Ironically, many of the new
medical discoveries that will come from this knowledge may increase inequalities in health, if the common pattern of new ad-vances being differentially available to those higher placed in society repeats itself.
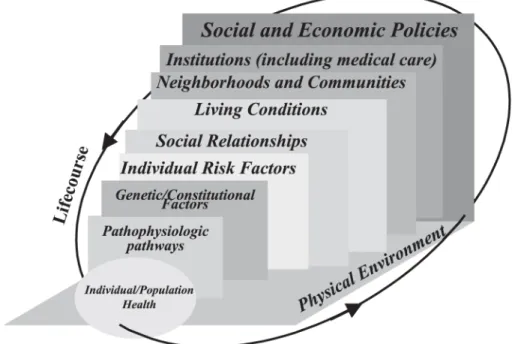
Instead, the argument can be made for an approach to the understanding, preven-tion, and reduction of socioeconomic in-equalities in health that is portrayed in Fig-ure 18,9. In this view, any health phenomena
must be understood within a multi-level causal framework, ranging from molecular events within the body to broad features of a society that structures the patterns of expo-sure to individual and aggregate risks fac-tors, as well as opportunity structures and individual and community resources3,10. In
what follows, I will illustrate how this frame-work can be utilized to examine a number of issues that have arisen in the epidemiologic literature on socioeconomic inequalities in health.
Where is the Concentration of
Greatest Need Along the
Socioeconomic Gradient of
Health?
Much that has been written about socio-economic inequalities in health has empha-sized the graded relationship in socioeco-nomic position and health, emphasizing that excess risk is found not only among the most
disadvantaged but even among those in rela-tively privileged positions1,2,11-14. While this
perspective has been useful in pointing out that socioeconomic factors put more than the very poor at a health disadvantage, a rela-tively uncritical examination of the shape of this gradient and/or data limitations has tended to leave the reader with a feeling that the relationship between socioeconomic position and risk of poor health or death is linear. The reality is very far from that – at least with respect to the relationship between household income and risk of death. Figure 2 shows how decidedly non-linear the rela-tionship is when examined using the National Longitudinal Mortality Study, a cohort of over one million people whose mortality ex-perience was prospectively examined over almost a decade15. As can be seen, the
in-creased risk associated with income differ-ences is greatest among the bottom third of the income distribution and diminishes rap-idly with increasing income after that point. The implications of this non-linearity are that increasing economic resources among
those with lower incomes will have the great-est impact on the population’s health. (Par-enthetically, I know of no careful considera-tion of how the shape of this curve varies between places or over time. Does, for ex-ample, a shift of the income distribution to the right bring the relative risk curve with it, or does it result in decreasing inequalities in health? Because some very wealthy coun-tries still have substantial inequalities in health, this latter possibility seems unlikely.) Figure 2 clearly shows that increasing income improves health the most among approxi-mately the bottom third of the population. Thus, upstream policies that increase the economic resources of the bottom third of the population through employment poli-cies, education and training, or increases in minimum wages or tax credits would theo-retically increase the health of that segment of the population and decrease socioeco-nomic inequalities in health. Similar benefits might accrue from provision or subsidization of childcare or housing costs, or other costs that fall disproportionally on the poor. In the
United States, and perhaps other countries, poorer working families also have fewer job benefits and greater demands on their out of work time to take care of children and kin16.
Life Course and Cumulative
Disadvantage
A substantial, but contested, literature now documents the impact of prenatal and early life exposures on the later development of poor health, even many decades later17-25.
Because parental socioeconomic position exquisitely structures exposures to the fetus and the young child, it would not be surpris-ing that socioeconomic inequalities in health occur early in life as well as later26.
Substan-tial data now indicates that this is the case, although specific features of the period in which early growth occurs may reduce the impact of early socioeconomic origins26-34.
Of course in many cases, socioeconomic origins are often also socioeconomic desti-nations, and early socioeconomic disadvan-tage is associated with a cascade of health-damaging exposures over the life course. A growing amount of evidence now shows that sustained disadvantage is associated with
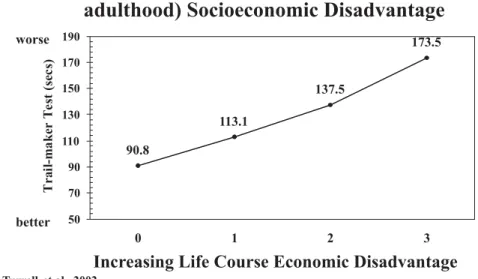
poor health outcomes. For example, Figure 3 illustrates the impact of sustained economic disadvantage from childhood to the 5th and
6th decade of life on level of cognitive
func-tion35. In this case, a higher score on the
cog-nitive test indicates poorer functioning. The measures of socioeconomic disadvantage are based on childhood, level of education, occupation, and income. Cumulative disad-vantage over many decades appears to be associated with worse cognitive function. A similar picture, looking over 29 years, was found when we examined the association between sustained poverty and a wide vari-ety of health outcomes36 (Figure 4).
Communities as Crucibles for
Growing Health Inequalities
As the research literature on the socio-economic position and health has been ex-panding, so has a related literature indicat-ing that social and economic characteristics of the neighborhoods and communities in which people live are associated with risk of death, morbidity rates, and other outcomes. These two sets of findings fit together nicely because the neighborhoods and communi-ties in which people live are likely to be one
of the important contexts in which socio-economic inequalities in health are gener-ated. An example of these studies is one we completed a number of years ago. Figure 5
shows the 9-year survival experience of community residents who lived in or out-side of areas of high levels of poverty and social disadvantage37. It is not surprising that
Figure 4 - Cumulative Disadvantage over 29 years and Health Outcomes.
those who lived outside of the poverty area were healthier. After all, they were richer, better educated, more likely to be employed, had better medical care, and differed in many other ways from those who lived in the pov-erty area. However, when we statistically took all of these differences into account, those who lived in the poverty area still had almost a 50% increased risk of death. A replication of this study at the national level confirmed our findings, even when there was adjust-ment for total cholesterol, systolic blood pressure, and a number of other factors, and major cause of death were considered sepa-rately38. There are now many dozens of
stud-ies of this type, and most show these inde-pendent effects of area of residence in mor-tality, morbidity, and chronic disease risk factors; some of them using the most ad-vanced multi-level analytic techniques. In-deed, there is also a large literature showing important effects of neighborhood charac-teristics on child development, crime, and other outcomes39-41.
It seems likely that these effects of place are important in understanding socioeco-nomic inequalities in health. But, we know little about the ways in which where one lives influences one’s health and there is an im-portant need for research in this area. For example, are the influences through differ-ences in material standards of living and in-stitutional resources, differences in exposure to successful or unsuccessful role models, differences in levels of environmental con-taminants, stress, or any of many other pos-sibilities—or all of them?
From a multilevel perspective, it makes little sense not to look upstream. For exam-ple, zoning and land use policies can, inten-tionally or uninteninten-tionally, structure differ-ential levels of demands and resources ac-cording to where one lives. In one study of the area around Atlanta, Georgia, there was an almost 10-fold difference in the per capita tax base. In many places, the differences would be even greater. To the extent that public goods such as education, medical care, policing, and road repair are paid for by taxes, the daily lives of people in these
differ-ent areas will differ dramatically, and some of these differences may be important for health.
The levels of resources and strains within a community often represent factors oper-ating outside of that community. For exam-ple, closure of a major source of jobs within a community will send economic and social ripples throughout the community, and the resultant social and economic characteris-tics of that community, and of those who live in it, must be seen as a consequence of those decisions. Again, we see that an un-derstanding of community factors that gen-erate inequalities in health needs to be grounded in an appreciation of the upstream factors that create the community condi-tions.
Economic Equity and Inequalities
in Health
In many countries over the last two dec-ades, there has been an increase in income and wealth gaps between the rich and poor, and perhaps even an increasingly bifurcated distribution of income. Spearheaded by the work of Wilkinson42,43, attention has turned
to the impact of inequality in the distribu-tion of income on health and inequalities in health. While the broadest view—that dif-ferences in income inequality could explain much of the differences in life expectancy and all cause mortality between developed countries—seems not to be true44, there do
seem to be some countries in which the in-equitable distribution of income within the country is strongly related to geographic health inequalities within the country—the best example being the United States45-47.
While some have even disputed this relation-ship, extremely interesting results have emerged when the USA and Canada were compared48. Using identical methodologies,
features? The answer will depend on how one conceptualizes potential links between income inequality and health44, 46, 49-51. A good
argument can be made for the proposition that the effect of income inequality on health reflects a combination of negative exposures and lack of resources held by individuals, along with systematic underinvestment across a wide range of human, physical, health, and social infrastructure. An unequal income distribution is one result of histori-cal, cultural, and political-economic proc-esses. These processes influence the private resources available to individuals and shape the nature of public infrastructure, educa-tion, health services, transportaeduca-tion, environ-mental controls, availability of food, quality of housing, and occupational health regula-tions that form the “neo-material” matrix of contemporary life. In the US, higher income inequality is significantly associated with many aspects of infrastructure, unemploy-ment, health insurance, social welfare, work disability, educational and medical expendi-ture, and even library books per capita52.
Thus, upstream policies can have a major impact on the extent of income inequality within an area or region.
However, to the extent that the links be-tween the distribution of income and the dis-tribution of public and private goods are malleable, the health consequences of ineq-uity in the income distribution can be miti-gated. There is good reason to believe that variations between the US and Canada with respect to taxation and transfers, economic and racial segregation, and other factors re-sult in there being a link between within coun-try income inequality and health for the US and no such link for Canada.
Globalization and Health
Inequalities
It is impossible to talk about health in-equalities without considering the global situ-ation and global health inequalities. WHO reports demonstrate dramatically the enor-mous variations in the likelihood of good health and development between peoples of
poor, moderate, and high income countries, and per capita GDP is strongly associated with life expectancy below $10,000 or so per capita GDP. According to the World Bank, over one billion people (20% of world’s popu-lation) are estimated to live on less than $1 per day, and 3 billion (49% of world’s popu-lation) on less than $2 per day. More than 110 million primary school age children are out of school (60% of them girls) and many more live without adequate food, shelter, safe water, and sanitation53. It is easy to
under-stand how this situation can result in a tre-mendous burden of disease and premature disability and mortality, but it is difficult from the numbers alone to comprehend the mag-nitude of the problem. The overall pattern of results suggests that with development may come increasing gaps between the rich and poor, with many being left behind in a worse state54. While the role of globalization
in these changes may be hotly debated, there is some evidence that global economic cri-ses can have substantial effects on health and social factors associated with increased health risks. For example, the impact of the 1998 Asian financial crisis in Thailand included increases in poverty, unemployment, di-vorce rates, crime, child abandonment, and drug use55. Similarly, it does not take a great
deal of imagination to translate the decreases in the rates of expenditure on public health associated with increasing debt burden to a deterioration in overall health status and a rise in health inequalities. For example, in Pakistan in the 1990’s, expenditures on debt service increased 7-fold to 350 billion Paki-stani rupees, while the National health budget stagnated at around 25 billion, well less than 10% of that spent of debt service, and health research expenditures dropped to essentially zero rupees5656565656...
A truly A truly A truly A truly
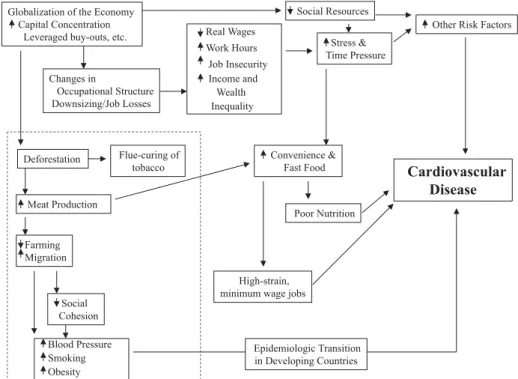
6, which links global economic forces with deforestation, destruction of traditional ag-riculture, development of urban centers with concentrated poverty, decline in traditional social and behavioral patterns, and the sub-sequent development of transitions in health profiles with increasing rates of cardiovas-cular disease. All the while this is happening the same forces can be seen to be connected to economic insecurity, life-style changes
including massive increases in fast food con-sumption, and the development of low paid jobs to supply the fast food industry10. Of
course it is difficult to document every one of these links. This difficulty presents a chal-lenge to epidemiologists and other scientists to develop data sources and analytic tools to document these etiologic forces with the same zeal as is addressed to the develop-ment of new molecular technology.
Figure 6 - Connections between the Global Economy and Health in Poor and Wealthy Countries.
References
1. Kaplan GA, Haan MN, Syme SL, Minkler M, Windleby M. Socioeconomic status and health. In: Amler RW, Dull HB (eds.). Closing the gap: the burden of unnecessary illness. New York: Oxford University Press, 1987, p. 125-9.
2. Haan MN, Kaplan GA, Syme SL. Socioeconomic status and health: old observations and new thoughts. In: Bunker JP, Gomby DS, Kehrer BH (eds.). Pathways to health: the role of social factors. Menlo Park: Henry J. Kaiser Family Foundation, 1989, p. 76-135.
3. Lynch JW, Kaplan GA. Socioeconomic position. In: Berkman LF, Kawachi I (eds.). Social Epidemiology. New York: Oxford University Press, 2000, p. 13-35.
4. Kaplan GA, Lynch JW. Whither studies on the socioeconomic foundations of population health? (Editorial). Am J Public Health 1997; 87: 1409-11.
6. Chenet L, McKee M, Fulop N, Bojan F, Brand H, Hort A, Kalbarczyk P. Changing life expectancy in central Europe: is there a single reason? J Public Health Med 1996; 18: 329-36.
7. Leon DA et al. Huge variation in Russian mortality rates 1984-1994: artefact, alcohol, or what? Lancet 1997; 350: 383-8.
8. Kaplan GA. 1999. What is the role of the social environment in understanding inequalities in health? Ann N Y Acad Sci 1999; 89: 116-9.
9. Kaplan GA. Upstream and downstream approaches to inequalities in health. http://www.sph.umich.edu/ miih/index2.html, working papers and publications; 1999.
10. Kaplan GA, Lynch JW. Socioeconomic considerations in the primordial prevention of cardiovascular disease. Prev Med 1999; 29: S30-S35.
11. Syme SL, Berkman LF. Social class, susceptibility and sickness. Am J Epidemiol 1976; 104: 1-8.
12. Adler NE et al. Socioeconomic status and health. The challenge of the gradient. Am Psychol 1994; 49: 15-24.
13. Evans RG, Barer ML, Marmor TR. Why Are Some People Healthy and Others Not? New York: Aldine de Gruyter; 1994.
14. Marmot MG et al. Health inequalities among British civil servants: the Whitehall II study. Lancet 1991; 337: 1387-93. Notes: Comment in: Lancet 1991 Jul 6; 338(8758): 58-9.
15. Wolfson M et al. Relation between income inequality and mortality: empirical demonstration. Br Med J 1999; 319: 953-7.
16. Heymann SJ. The Widening Gap: Why American Working Families are in Jeopardy and What Can Be Done About It. New York: Basic Books; 2000.
17. Forsén T et al. Mother’s weight in pregnancy and coronary heart disease in a cohort in Finnish men: follow up study. Br Med J 1997; 315: 837-40.
18. Osmond C et al. Early growth and death from cardiovascular disease in women. Br Med J 1993; 307: 1519-24.
19. Phillips DIW. The ‘fetal origins’ hypothesis: role of programming of adrenocortical and sympathoadrenal function. In: O’Brien PMS, Wheeler T, Barker DJP (eds.). Fetal programming : influences on
development and disease in later life. London: RCOG Press; 1999, p. 414-21.
20. Barker DJP. Fetal nutrition and cardiovascular disease in later life. Br Med Bull 1997; 53: 96-108.
21. Susser M, Levin B. Ordeals for the fetal programming hypothesis. Br Med J 1999; 318: 885-6.
22. Paneth N, Susser M. Early origin of coronary heart disease (the “Barker hypothesis”). Br Med J 1995; 310: 411.
23. Keating DP, Hertzman C. Developmental health and the wealth of nations: social, biological, and
educational dynamics. New York: Guilford Press; 1999.
24. Kuh D, Ben-Schlomo Y. A lifecourse approach to chronic disease epidemiology. Oxford: Oxford University Press; 1997.
25. Aboderin I et al. Life Course Perspectives on Coronary Heart Disease, Stroke and Diabetes. The Evidence and Implications for Policy and Research. Geneva: World Health Organization; 2002.
26. Lynch JW, Kaplan GA, Salonen JT. Why do poor people behave poorly? Variation in adult health behaviours and psychosocial characteristics by stages of the socioeconomic lifecourse. Soc Sci Med 1997; 44: 809-19.
27. Davey Smith G, Ben-Shlomo Y, Lynch JW. Lifecourse approaches to inequalities in coronary heart disease risk. In: Stansfeld S, Marmot M (eds.). Stress and Heart Disease. London: B M J Books; 2001.
28. Gunnell DJ et al. Lifecourse exposure and later disease: a follow-up study based on a survey of family diet and health in pre-war Britian (1937-1939). Public Health 1996; 110: 85-94.
29. Hertzman C, Power C, Matthews S, Manor O. Using an interactive framework of society and lifecourse to explain self-rated health in early adulthood. Soc Sci Med 2001; 53: 1575-85.
30. Davey Smith G et al. Socioeconomic position over the lifecourse and mortality. Br Med J (submitted).
31. Davey Smith G, Gunnell D, Ben-Shlomo Y. Lifecourse approaches to socioeconomic differentials in cause-specific adult mortality. In: Leon D, Walt G (eds.). Poverty, Inequality and Health: An International Perspective. Oxford: Oxford University Press; 2001. p. 88-124.
32. Davey Smith G, Ben-Shlomo Y, Lynch JW. Lifecourse approaches to inequalities in coronary heart disease risk. In: Stansfeld S, Marmot M (eds.) Stress and Disease. London: B M J Books; 2001. (in press)
33. Lynch JW et al. Childhood and adult socioeconomic status as predictors of mortality in Finland. Lancet 1994; 343: 524-7. Notes: Comment in: Lancet 1994 Feb 26; 343(8896): 496; Comment in: Lancet 1994 May 14; 343(8907): 1224-5.
34. Kaplan GA et al. Childhood socioeconomic position and cognitive function in adulthood. Int J Epidemiol 2001; 30: 256-63.
36. Lynch JW, Kaplan GA, Shema SJ. Cumulative impact of sustained economic hardship on physical, cognitive, psychological, and social functioning. N Engl J Med 1997; 337: 1889-95.
37. Haan MN, Kaplan GA, Camacho T. Poverty and health: prospective evidence from the Alameda County Study. Am J Epidemiol 1987; 125: 989-98.
38. Waitzman NJ, Smith KR. Phantom of the area: poverty-area residence and mortality in the United States (Note: published erratum appears in Am J Public Health 1998; 88(7): 1122). Am J Public Health 1998; 88: 973-6.
39. Brooks-Gunn J, Duncan GJ, Aber JL. Neighborhood poverty: Context and consequences for children. Vols, 1 & 2. New York: Russell Sage; 1997.
40. Sampson RJ, Wilson WJ. Toward a theory of race, crime, and urban inequality. In: Hagan J, Peterson (eds.). Crime and Inequality. Stanford: Stanford University Press; 1995, p. 37-54.
41. Sampson RJ, Raudenbush SW, Earls F. Neighborhoods and violent crime: a multilevel study of collective efficacy. Science 1997; 277: 918-24.
42. Wilkinson RG. Income distribution and life expectancy. Br Med J 1992; 304: 165-8.
43. Wilkinson RG. Unhealthy societies. In: (monograph.) The afflictions of inequality, London: Routledge; 1996.
44. Lynch JWI et al. Income inequality, the psychosocial environment and health: comparisons of wealthy nations. Lancet 2001; 358: 194-200.
45. Lynch JW et al. Income inequality and mortality in metropolitan areas of the United States. Am J Public Health 1998; 88: 1074-80.
46. Kaplan GA et al. Inequality in income and mortality in the United States: analysis of mortality and potential pathways. Br Med J 1996; 312: 999-1003.
47. Kennedy BP, Kawachi I, Prothrow-Stith D. Income distribution and mortality: cross-sectional ecological study of the Robin Hood index in the United States. Br Med J 1996; 312: 1004-7.
48. Ross NA et al. Relation between income inequality and mortality in Canada and the United States: a cross-sectional assessment using Census data and vital statistics. Br Med J 2000; 320: 898-902.
49. Lynch JW, Davey Smith G, Kaplan GA, House JS. Income inequality and mortality: importance to health of individual income, psychosocial environment, or material conditions. Br Med J 2000; 320: 1200-4.
50. Lynch JW, Kaplan GA. Understanding how inequality in the distribution of income affects health. J Health Psychol 1997; 2: 297-314.
51. Kaplan GA, Lynch JW. Is economic policy health policy? Editorial. Am J Public Health 2001; 91: 351-3.
52. Lynch JW, Davey Smith G, Kaplan GA, House JS. Income inequality and health: a neomaterial interpretation. Br Med J. (in press)
53. World Bank. Global Poverty Report. http:// www.worldbank.org/html/extdr/extme/ G8_poverty2000.pdf; 2000.
54. Wagstaff A. Inequalities in Health in Developing Countries: Swimming Against the Tide? http:// econ.worldbank.org/files/12290_wps2795.pdf; 2002
55. Shivakumar J. Thailand’s Response to AIDS: Building on Success, Confronting the Future. http://
www.worldbank.or.th/social/index.html; 2001.