Tendência da mortalidade por
homicídios no Estado do Paraná,
segundo Regionais de Saúde,
1979 a 2005*
Homicide mortality trend in the state
of Paraná, Brazil, per Health District,
1979 to 2005
Elizabeth Mitiko Konno de Lozada
IThais Aidar de Freitas Mathias
IISelma Mafei de Andrade
IIITirza Aidar
IVI 11ª Regional de Saúde da Secretaria de Estado da Saúde do Paraná.
II Departamento de Enfermagem do Centro de Ciências da Saúde da Universidade Estadual de Maringá
III Centro de Ciências da Saúde do Departamento de Saúde Coletiva da Universidade Estadual de Londrina
IV Instituto de Filosoia e Ciências Humanas e Núcleo de Estudos de População, Universidade Estadual de Campinas
Financial support: CT-Saúde/CNPq 24/2004 – process n. 505.875/2004-7. Departament of Science and Technology (DECIT)/Secretariat of Science, Technology and Strategic Input/Ministry of Health and Brazilian Science and Technology Development Council (CNPq).
Mailing Address: Thais Aidar de Freitas Mathias. Departamento de Enfermagem, Universidade Estadual de Maringá, PR. Av. Colombo, 5790. Zona 7. Maringá – Paraná, CEP: 87.020-900 – Brazil. Email – tafmathias@uem.br
Resumo
A tendência da mortalidade por homicí-dios de homens de 15 a 49 anos residentes no Paraná foi analisada no período de 1979 a 2005. Foram calculados coeficientes de mor-talidade por homicídio (por 105 homens de
15 a 49 anos) por Regionais de Saúde (RS) de residência, agrupados em triênios e analisa-dos por meio de média móvel, da variação percentual anual (VA%) de acordo com os seguintes estratos: muito baixo: ≤ 40; baixo: de 41 a 55; médio: de 56 a 70; alto: de 71 a 85; e muito alto: ≥ 86. De 1979-1981 a 1995-1997 o Paraná apresentava coeficientes de mortalidade por homicídios considerados muito baixo e baixo (43,1 e 49,3 respecti-vamente) e no final do período, 1999-2001 e 2003-2005, os coeficientes passam a médio e alto (57,4 e 82,3 respectivamente). Houve aumento dos coeficientes para a maioria das RS, principalmente a partir de 2000, destacando Londrina (VA%: 24,9), Metropolitana-Curitiba (VA%: 12,3) e Foz do Iguaçu (VA%: 7,6), além de aumento para as RS do interior do estado como Campo Mourão (VA%: 26,9), Cianorte (VA%: 25,4), Umuarama (VA%: 17,7), Ivaiporã (VA%: 14,1), Pato Branco (VA%: 13,7) e Apucarana (VA%: 11,1). O fenômeno da interiorização da violência e a deterioração das relações sociais nas grandes cidades reforçam neces-sidade de ações para modificar a tendência ascendente da mortalidade por violências no Estado do Paraná.
Abstract
The homicide mortality trend from 1979 to 2005 was analyzed for males aged 15 to 49, living in the State of Paraná, Brazil. Mortality rates (per 105 males aged 15 to 49)
were calculated per Health District (HD) of residence. The mortality rates were then grouped in three-year periods and analyzed using the moving average, the relative annual variation (VA%) and the following strata: very low: ≤ 40; low: 41-55; medium: 56-70; high: 71-85 and very high: ≥ 86. For the periods between 1979-1981 to 1995-1997 the rates were considered very low and low (43.1 and 49.3 respectively) and towards the end of the period analyzed, 1999-2001 and 2003-2005, rates increased to medium and high (57.4 and 82.3 respectively). The rates increased in most HD, especially as of 2000, and primarily in Londrina (VA%: 24.9), Me-tropolitan Curitiba (VA%: 13.3) and Foz do Iguaçu (VA%: 7.6). The rates in the interior of the state, in the districts of Campo Mou-rão (VA%: 26.9), Cianorte (VA%: 25.4) and Umuarama (VA%: 17.7) also increased. The spread of violence towards the interior and the growing deterioration of social relations in large cities demonstrate the need of ac-tions to reverse the upward trend in violence in the State of Paraná.
Keywords: Homicide, mortality, external causes, violence, health statistics, epide-miology.
INTRODUCTION
External causes have been the second or third cause of death in Brazil since the early 1980s1,2. Among these causes, homicides
and transport accidents have predomina-ted. As of the 1990s, there was an increase in homicides which came to account for 36.7% of the deaths due to external causes in 19993.
Between 1980 and 2004, the standardized homicide mortality rate practically doubled (from 14.1 to 27.2 per 100,000 inhabitants), and came to represent 39.1% of the propor-tional mortality from external causes1.
The high frequency of homicides, es-pecially in urban settings, has influenced health indicators such as the ‘potential years of life lost’3 due to premature death, since it
is primarily adolescents, young people and economically productive adults who die from homicides.
Violence in contemporary society has become part of the public health agenda because it presents evitable factors of mortality and morbidity that imply high cost with treatment and rehabilitation, and affects the victim, his/her family and society as a whole, with a negative impact on social and economic development4-8.
Fatal violence and accidents do not occur in a homogeneous fashion in the population and across regions within the country, and their specific features have to be analyzed and understood4.
Just as in all other states, in Paraná male individuals aged 15 to 49 are the most expo-sed to the risk of homicide by firearm9. As
regards differences between geographical areas, the decentralization and spreading of economic activities as a result of the creation of new and booming hubs in the interior of the states has impacted Brazil’s violence indicators and geographic distribution8,
allowing the identification of risk groups and regions and informing potential forms of intervention. The objective of this study was hence to analyze the homicide trend in the male population aged 15 to 49 in the State of Paraná between 1979 and 2005 per Health District.
METHOD
This is an exploratory study, with an ecological approach, of homicide mortality in the State of Paraná for the period from 1979 to 2005. Paraná had an estimated population of 10,511,862 inhabitants in 200710, and has 399 municipalities grouped
in 22 Health Districts, administrative units of the State Health Department. These Health Districts in turn are grouped into six Macro-regional Districts.
The study analyzed the mortality rates for the period from 1979 to 2005 for the male population aged 15 to 49, which concentra-tes the vast majority of homicide victims. In Paraná, in 2005, 58,778 deaths were reported to the Mortality Information System and 14.2% (8,354) of these deaths were due to external causes. Of these, 35.9% (3,001) were caused by homicides, 92% (2,760) of the victims were male, and of the male victims, 87.3% (2,409) were between 15 and 49 years of age. The standardization of mortality rates based on age groups did not present significant differences that could change the conclusions of the comparative analyses be-tween periods and Health Districts. In view of this observation, the age-standardized values were not presented. The mortality data was obtained from the Mortality In-formation System (SIM), by municipality of residence (www.datasus.gov.br). In or-der to calculate the rates, we resorted to population data of the 1980, 1991 and 2000 Demographic Censuses, to the 1996 popu-lation count and to popupopu-lation projections developed by IBGE (Brazilian Statistics and Geographical Institute) published by the Health Ministry at the DATASUS site (www. datasus.gov.br).
The study used the groups of the
Inter-national Statistical Classification of Diseases and Related Health Problems (ICD-9 and ICD-10). To the deaths caused by homicide (ICD-9: E960 to E969 and ICD-10: X85 to Y09) we added those deaths classified under legal intervention (ICD-9: E970 to E977, E978 and ICD-10: Y35), in addition to events where the intention was undetermined and the injury was caused by firearms (ICD-9: E985 and ICD-10: Y22 to Y24) or by sharp objects (ICD-9: E986 and ICD-10: Y28). The use of this enlarged category allows the inclusion of deaths that could have been classified as homicide but instead have been classified as injuries where it is not known whether they were accidental or intentional, in addition to those deaths in connection with legal intervention which, according to recent studies, when they are examined from a closer range, come to be classified as homicides11,12. Mortality rates were
estima-ted per three-year period according to the Health Districts of residence.
In order to organize the Health Districts according to the magnitude of the homicide mortality rate, the rates were classified in strata following three criteria: there should be a maximum of five strata which should include districts with fairly similar values, and their limits should consider the national and regional circumstances (the most recent average patterns). Thus, this last criterion also defined the classification that varied from very low to very high: rates per 100,000 males ≤ 40 (very low); from 41 to 55 (low); from 56 to 70 (medium); from 71 to 85 (high) and ≥ 86 deaths per 100,000 males (very high). The reference rates were the mortality rates for the South Region of Brazil, the State of Paraná, Brazil and the Southeast Region in 2004 (60.4; 82.3; 85.8 and 100.1 deaths per 100,000 males aged 15 to 49, respectively) (www.datasus.gov.br). That is, the ‘very low’ and ‘low’ classifications are relative to the regional levels and are well above the levels observed for the population in general in developed countries (14.4 per 100,000 inhabitants) or the world average (8.8 per 100,000 inhabitants)13.
the moving average for three-year cycles, from 1979 to 2005, in that the first cycle (1979 to 1981) was represented by the year 1980; the second (1984 to 1986) by the year 1985 and so forth, until the last cycle (2003 to 2005), which was represented by the year 2004. The moving average was also used to reduce the rate random variability shown during the period, since it is an efficient and easy-to-use filter14.
In addition to the graph representing the rate moving average, the mortality trend was also analyzed by means of the relative annual variation (VA%) of the rates between the three-year periods:
Where Ct is the mortality rate for the three-year period t;tf and ti are the first and last three-year periods, respectively. In order to use, whenever possible, the census and population count years, the annual varia-tion was calculated between the following three-year periods: from 1979-1981 to 1984-1986; from 1984-1986 to 1990-1992; from 1990-1992 to 1995-1997; from 1995-1997 to 1999-2001; and from 1999-2001 to 2003-2005. These periods were chosen based on the criterion that at least one of the three-year periods contained data from census or population count years. The project was approved by the Permanent Research Ethics Committee of the State University of Maringá (Opinion nº 350/2004).
RESULTS
In the first two three-year periods, the homicide mortality rates in the State of Pa-raná were 43.1 and 38.7 deaths per 100,000, which were classified as low and very low, according to the classification adopted in this study, and this pattern held until the three-year period 1995-1997, when the rate rose to 49.3. In the last three-year period, it reached 82.3 deaths per 100,000 males aged
15 to 49, which places the rate in the high stratum (Table 1).
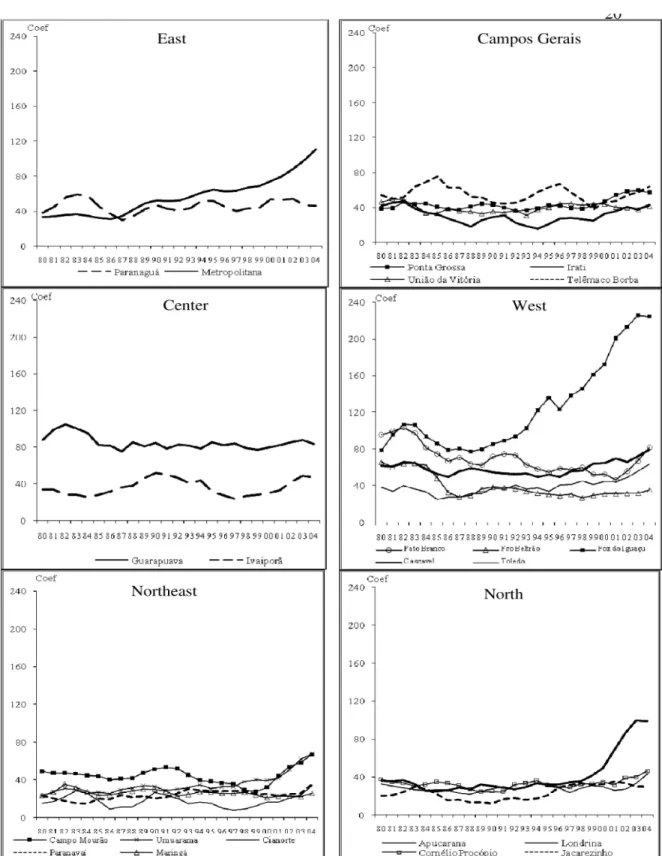
Figure 1 shows the curves for homicide mortality trends per Health District. These curves run upward for almost all HD, es-pecially from 2000 onwards, with Foz do Iguaçu ranking first (West Macro-Region), followed by Metropolitan-Curitiba (East Region) and Londrina (North Macro-Region). The East and West Macro-Regions had the highest rates in the period studied (106.1 and 103.4) recorded in the three-year period 2003-2005. The Guarapuava Health District stood out, with high rates during all the period, always above 80 deaths per 100,000 males, with a small relative variation between the three-year periods (Table 1).
The annual variation was positive be-tween the three-year periods 1999-2001 and 2003-2005 for most macro-regions and health districts except Paranaguá, União da Vitória and Jacarezinho HD, where variations were negative (Table 2). In HD with high rates in the last three-year period (Metropolitan-Curitiba, Foz do Iguaçu and Londrina), rates started to rise in different periods. In the Metropolitan-Curitiba HD, there was a 10.4% annual variation between 1984-1986 and 1990-1992 and a 12.3% varia-tion between the three-year periods 1999-2001 and 2003-2005. In the Foz do Iguaçu HD, rates began to rise in the period from 1990-1992 to 1995-1997 (VA%: 7.5%) and rose more sharply from 1995-1997 to 1999-2001 (VA%: 10.0%). In the Londrina HD the rise started in the period from 1995-1997 to 1999-2001 (VA%: 13%) and the annual variation reached 24.9% between the two last three-year periods analyzed (Table 2).
Maringá, Jacarezinho, Cianorte, Francisco Beltrão and Paranavaí (26.0; 30.2; 34.0; 34.9; 35.4 deaths per 100,000 males aged 15 to 49, respectively).
DISCUSSION
The analysis of homicide mortality for the period 1979 to 2005 showed an increase in the risk of death in the 1990s in Paraná,
with a sharper upward trend as of 2000, whi-ch increased concern in the State and was a warning sign. According to the Violence Map of Brazilian Municipalities8, in 2004, Paraná
ranked 11th in the general classification of
states for homicide mortality, whereas ten years before, in 1994, it ranked 16th.
According to a study presented by the National Council of Health Departments (CONASS)15 the states of Pernambuco,
Es-Table 1 – Homicide mortality rates (per 100,000 males) for males aged 15 to 49, per Health District, and three-year periods. Paraná State, Brazil, 1979 to 2005.
Three-year period
Macro-Region / Health District 1979-81 1984-86 1990-92 1995-97 1999-01 2003-05
East 34.0 32.9 51.1 61.5 72.8 106.1
1 Paranaguá 38.2 45.1 42.5 44.7 53.1 46.1
2 Metropolitana 33.7 31.9 51.8 62.9 74.4 110.9
Campos Gerais 43.9 44.8 38.4 44.2 44.2 53.5
3 Ponta Grossa 38.9 40.8 40.0 41.8 47.1 57.1
4 Irati 41.7 32.1 31.2 27.3 32.9 43.1
6 União da Vitória 46.4 33.3 33.7 44.6 43.7 41.3
21 Telêmaco Borba 54.2 75.6 44.8 67.3 46.2 63.9
Central 72.3 65.1 70.6 67.9 66.5 74.5
5 Guarapuava 87.9 81.7 78.3 82.1 79.3 83.2
22 Ivaiporã 33.8 28.5 49.7 27.4 30.0 46.9
Northwest 29.4 28.4 33.3 28.6 26.7 42.4
11 Campo Mourão 49.3 44.1 53.5 36.8 32.2 66.9
12 Umuarama 23.5 26.8 28.8 32.9 39.6 67.7
13 Cianorte 15.5 18.8 24.2 10.4 16.9 34.0
14 Paranavaí 23.3 20.3 22.0 28.0 25.0 35.4
15 Maringá 23.8 23.3 28.3 25.9 21.2 26.0
North 32.9 26.5 26.3 30.7 40.6 68.9
16 Apucarana 32.8 24.4 30.2 28.6 30.1 43.4
17 Londrina 36.3 25.8 28.8 32.5 49.4 98.7
18 Cornélio Procópio 37.9 35.2 24.6 30.1 35.0 46.4
19 Jacarezinho 20.5 22.2 17.4 28.9 32.6 30.2
West 65.2 54.6 56.2 60.8 77.3 103.4
7 Pato Branco 95.4 74.6 74.8 58.6 52.6 81.4
8 Francisco Beltrão 65.6 48.0 37.9 29.0 31.0 34.9
9 Foz do Iguaçu 78.3 86.1 89.2 122.9 171.8 224.0
10 Cascavel 61.7 52.4 52.9 49.6 64.9 79.4
20 Toledo 38.2 24.9 36.0 41.0 44.6 63.6
Figura 1 - Coeicientes de mortalidade por homicídios (por 100 mil homens) em homens de 15 a 49 anos, segundo Regional e Macro Regional de Saúde. Paraná, 1980 a 2004.
pírito Santo and Rio de Janeiro were those with the highest homicide mortality rates in 2005, that is, 51.5, 47.0 and 46.0 deaths per 100,000 inhabitants, respectively, whe-reas the South region had the lowest rate (20.8 deaths per 100,000 inhabitants). Of the states of the South region, Paraná had the highest rate, followed by Rio Grande do Sul and Santa Catarina (28.9, 18.6, and 10.7
deaths per 100,000 inhabitants, respective-ly). In our study, the mortality rate for the three-year period 2003-2005, for males aged 15 to 49, was 82.3 deaths, almost three times the mortality rate for the whole of the state population in 200515.
In the State of São Paulo, in turn, the trend is the opposite: homicide mortality rates have been decreasing as of 1999, when
Table 2 - The relative annual variation of homicide mortality rates in males aged 15 to 49, per Health District and period, Paraná State, Brazil, 1979 to 2005.
Period
Macro-Region / Health District
1979-1981 to 1984-1986
1984-1986 to 1990-1992
1990-1992 to 1995-1997
1995-1997 to 1999-2001
1999-2001 to 2003-2005
East -0.7 11.1 4.1 3.7 9.1
1 Paranaguá 3.6 -1.0 1.0 4.7 -3.3
2 Metropolitana -1.1 10.4 4.3 4.5 12.3
Campos Gerais 0.4 -2.9 3.1 0.0 4.2
3 Ponta Grossa 1.0 -0.4 0.9 3.1 5.3
4 Irati -4.6 -0.5 -2.5 5.1 7.8
6 União da Vitória -5.7 0.2 6.5 -0.5 -1.4
21 Telêmaco Borba 7.9 -6.8 10.1 -7.9 9.6
Central -2.0 1.7 -0.8 -0.4 2.4
5 Guarapuava -1.4 -0.7 1.0 -0.8 1.2
22 Ivaiporã -3.1 12.5 -9.0 2.4 14.1
Northwest -0.7 3.4 -2.9 -1.3 11.8
11 Campo Mourão -2.1 3.6 -6.3 -3.1 26.9
12 Umuarama 2.7 1.3 2.8 5.1 17.7
13 Cianorte 4.2 4.9 -11.4 15.4 25.4
14 Paranavaí -2.6 1.4 5.4 -2.6 10.3
15 Maringá -0.4 3.6 -1.7 -4.5 5.6
North -3.9 -0.2 3.3 6.4 14.0
16 Apucarana -5.2 4.0 -1.1 1.3 11.1
17 Londrina -5.8 1.9 2.6 13.0 24.9
18 Cornélio Procópio -1.5 -5.0 4.5 4.1 8.2
19 Jacarezinho 1.7 -3.6 13.2 3.2 -1.8
West -3.3 0.6 1.6 5.4 6.7
7 Pato Branco -4.3 - -4.3 -2.6 13.7
8 Francisco Beltrão -5.4 -3.5 -4.7 1.7 3.2
9 Foz do Iguaçu 2.0 0.6 7.5 10.0 7.6
10 Cascavel -3.0 0.2 -1.2 7.7 5.6
20 Toledo -7.0 7.5 2.7 2.2 10.6
there were 43.9 deaths per 100,000 inhabi-tants, a rate that dropped to 22.5 in 2005, a 48.7% reduction. This reduction has been attributed to the implementation of the Disarmament Statute, concurrently with an intensive campaign and collection of firear-ms, initiatives to better equip the police and stronger repression efforts which included a rise in seizure of firearms and detentions. More specific actions at the local level, such as restrictions for sale of alcoholic bevera-ges (“dry law”) at certain times and cities and projects designed to foster the social inclusion of youth have also contributed to reduce mortality rates16.
Homicide mortality rates in the last three-year period (2003-2005) for the East and West Macro-regions were the highest in the state (106.1 and 103.4) and were im-pacted by the health districts of Metropoli-tan Curitiba and Foz do Iguaçu. Londrina, Metropolitan Curitiba and Foz do Iguaçu HDs had very high homicide mortality rates probably due to the impact of the rates of the seats of the municipalities (the cities of Londrina, Curitiba and Foz do Iguaçu), and these rates were well above the national average which was 85.8 per 100,000 males aged 15 to 49. The Maringá HD, with a rate of 26 deaths and Foz do Iguaçu HD with 224,0
for the three-year period 2000-2005, reflect the marked heterogeneity that exists across the regions of the state as concerns the risk of homicide.
The homicide mortality rate for males aged 15 to 49 reached, in the last three-year period of this study, 82.3 deaths per 100,000 males in Paraná, with a positive relative annual variation of 10.9%, which is a reason for concern. The situation observed in Foz do Iguaçu HD can be considered alarming. It is above the average of Paraná and has been considered very high since the three-year period 1984-1986. This situation was evidenced in the Violence Map of Brazilian Municipalities8, where the municipality of
Foz do Iguaçu has the highest homicide mortality rate of Brazil for young people between 15 and 24 years of age, with a rate of 223.3 deaths per 100,000 males for the three-year period 2002-2004.
It is important to highlight that the mu-nicipality of Foz do Iguaçu is in the area of the triple border (Paraguay, Argentina and Brazil), where tourism is intense because of the Iguazu Falls. The area is also served by a major highway network that allows national and international tourism and the transportation of goods. Its population rose from 136,352 inhabitants in 1980 to 301,408
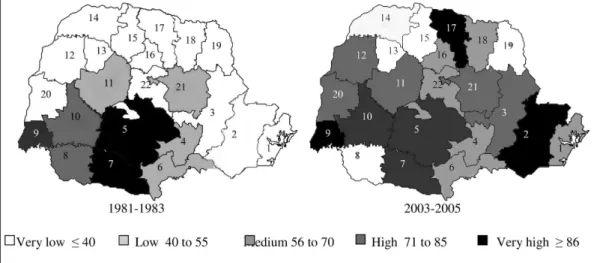
Figura 2 - Regionais de Saúde, segundo estrato dos coeicientes de mortalidade por homicídios entre homens de 15 a 49 anos. Paraná, 1981- 1983 e 2003-2005.
in 2005 (www.datasus.gov.br).
With the growing consumption of co-caine in the 1980s, Brazil became part of the trafficking route both as a consuming country and as a link between producing and consuming countries. Some factors may have contributed to this situation: the fact that Brazil shares borders with major cocaine producing countries; the existence of a communication and transportation infrastructure, and the close contact with European and North American countries17.
Within this context, new factors arise that breed violence such as organized crime relating to drug trafficking and illegal trade of weapons, both of which are typical of border areas.
The Health Districts within the Macro-regions presented relatively homogeneous homicide mortality rates for males aged 15 to 49 both in terms of magnitude and variation of such rates as is the case of the Northwest, Campos Gerais and Nor-th Macro-regions, wiNor-th Nor-the exception of Londrina Heath District (part of the North macro-region), where rates increased shar-ply as of 1998. In the other Macro-regions, some Health Districts were worthy of notice because of their high rates in the period studied such as Guarapuava HD (Central Macro-region), Metropolitan Curitiba HD (East Macro-region), and Foz do Iguaçu HD (West Macro-region).
The upward trend of the rates evidenced by the relative annual variation especially in the Metropolitan HD (Curitiba) and Londri-na HD, and the high rates of Foz do Iguaçu since the 1980s reflect deteriorating social relations in large cities. In the major cities of Brazil, migration has been pointed out as a factor that aggravates the social situation of municipalities, and is considered as ano-ther factor that can account for increasing violence in cities18.
For the Social and Economic Develop-ment Institute of Paraná (IPARDES), betwe-en 1991 and 2000, the Curitiba metropolitan area had an annual population growth rate of 3.1%, and had grown at a similar rate in the previous decade. In the same period,
the annual rate of Paraná was 1.4%19. The
Curitiba metropolitan area accounts for one third of the formal jobs of the State of Paraná, although in relative terms its growth does not reflect the increase in the economically active population, since the area had the State’s highest unemployment rate (14,7%)19. A study that analyzed the
homicides of young men per municipality in Paraná shows the importance of urban clusters in homicide mortality, whose rates correlated more strongly with the size of the population, with the proportion of youth between 15 and 24 years of age, with the proportion of enrollments in higher edu-cation and with the Gini index (an indicator of social inequality), which, according to some authors, could result from the fact that people are confronted with social inequality in large cities, and are excluded from pro-duction processes and from consumption. Additionally, there is greater availability of firearms and illegal drugs in larger cities 20.
The rise in homicide rates for males aged 15 to 49 in the Health Districts in the interior of the state, where the population density is lower should also be noted. Campo Mourão HD had an annual variation of 26.9%, the highest rate variation among the HDs of Paraná in recent years, and the HDs of Cas-cavel, Guarapuava and Pato Branco, where mortality rates were above the average for the state, suggest yet another phenomenon: the spreading of homicides into the interior of the state, at least in some specific regions. A study carried out in Cascavel21
de-monstrated that the homicides committed in that municipality were concentrated in certain areas and were strongly associated with poor urban infrastructure and social and economic inequalities. Those scenarios where there was “overlapping of needs” were more favorable to the occurrence of violent crimes resulting in deaths.
The dynamics of rising violence in the interior can be partly due to the route of illegal drugs, as many cities located in the interior of the state are on the trafficking route18,20. Another important factor is the
deve-lopment of the state which concentrates around some regional hubs, thus enlarging the gap between regions and between mu-nicipalities within a same region.
Poor living conditions, lack of oppor-tunity for young people to have access to quality education and hence their difficulty in finding formal jobs reflect great social and economic inequality and unequal access to basic services. These factors have been as-sociated to the expansion of drug trafficking and consumption beyond cities and into the interior of the state and smaller cities and have been considered the drivers of rising homicide mortality indicators22,23.
According to IPARDES data, the HDs of Guarapuava, Pato Branco and Campo Mourão had more than 30% of the total families living in poverty19. Income gaps
among the population can also be another determinant or another social aspect of social development that can account for the greatest differences between municipalities and regions within Paraná.
In Brazil and in other South American countries, the 1980s saw a process of econo-mic stagnation with hiking inflation which led to income concentration, greater social contradictions and higher levels of poverty and extreme poverty. Concurrently with the deterioration of the social and economic situation, the poor performance of public security forces and of the judiciary system, corruption in state institutions and in the legislative branch, in combination with a feeling of injustice and impunity may have contributed to the sharp increase in urban violence in recent decades which was ob-served in the high homicide mortality rates in the country24.
As concerns homicide of young people, preventive actions should include massive efforts from the State and society to main-tain youth in school. Soares25 considers that
school, in addition to playing a role in the socialization of children, might also func-tion as a “shield” in situafunc-tions where young people are at risk, and might “shield” them from death by homicide, and protect them from entering into situations that may put
them at risk, such as those situations with a high prevalence among groups that con-sume and distribute illegal drugs.
The magnitude and rising trend of ho-micide mortality in Paraná place this cause of death as one of the primary health pro-blems and ultimately represent indicators of deteriorating living conditions, social structures and the guarantees that are inhe-rent to citizenship. Future studies should be conducted to better understand the great differences in the risks of homicide found among the Health Districts of the State of Paraná, since the homicide rates tend to be higher in highly urbanized regions, with a high level of social inequality and unem-ployment among youth26.
It’s worth noting that there are limita-tions to the use of secondary data from the Mortality Information System. In principle, there is the possibility of undernotifica-tion and of variability in the specificity of information across regions, in addition to undetermined-intent mortality from exter-nal causes, which impacts the quantity and quality of official information. Therefore, when long periods of time are analyzed and compared across Health Districts, as was done in this study, it is possible that rising death risk trends may, at least in part, reflect the gradual improvement of health services and the efforts of the state health department to better train their staff thus improving the collection of data regarding deaths and the classification of such data in their areas of coverage. However, the inclusion of undetermined-intent-related deaths from firearms or sharp objetcts in this study aimed at mitigating the impact of the potential improvement in information quality in Paraná over the years.
the upward trend in violence at local level such as those designed to foster accident and violence prevention practices; enhan-ce surveillanenhan-ce and violenenhan-ce prevention capabilities such as surveillance of commu-nicable diseases; improve activities within the scope of the commitments undertaken under the ‘Pact for Management’ and ‘Pact for Life’ by the mayors and municipal-level administrators of Paraná, towards the de-velopment of actions to promote health.
Authors
EMK Lozada participated in the design, outline, analysis and drafting of this article; TAF Mathias participated in the design, analysis and drafting of this article; T Aidar participated in the outline, data analysis and revision of this article, and SM Andrade participated in the design and revision of this article.
REFERENCES
1. Ministério da Saúde. Secretaria de Vigilância em Saúde. Departamento de Análise de Situação em Saúde. Desigualdade e determinantes da mortalidade por violência. In: Saúde Brasil 2006: uma análise da desigualdade em saúde. Brasília, DF; 2006. p 391-523.
2. Souza ER, Minayo MCS, Silva CMFP, Reis AC, Malaquias JV, da Veiga JPC et al. Análise temporal da mortalidade por causas externas no Brasil: décadas de 80 e 90. In: Minayo MCS, Souza ER. (organizers) Violência sob o olhar da saúde: a infrapolítica da contemporaneidade brasileira. Rio de Janeiro: FIOCRUZ; 2006. p. 83-107.
3. Mello Jorge MHP, Gotlieb SLD, Laurenti R. A saúde no Brasil: análise do período 1996 a 1999. Organização Pan-Americana da Saúde OPAS/OMS; 2001.
4. Minayo MCS. A inclusão da violência na agenda da saúde: trajetória histórica. Ciência Saúde Coletiva. 2006; 11(suppl):1259-1267.
5. Ministério da Saúde. Impacto da Violência na Saúde dos Brasileiros. Secretaria de Vigilância em Saúde. Brasília: Ministério da Saúde; 2005.
6. Gawryszewski VP, Mello Jorge MHP. Mortalidade violenta no Município de São Paulo nos últimos 40 anos. Rev Bras. Epidemiol. 2000; 3(1-3): 50-69.
7. Dahlberg LL, Krug EG. Violência: um problema global de saúde pública. Ciência e Saúde Coletiva 2006; 11(suppl): 1163-1178.
8. Waiselfisz, JJ. Mapa da violência dos municípios brasileiros. Organização dos Estados Ibero-Americanos para a Educação, a Ciência e a Cultura. Brasília, DF: Organização dos Estados Ibero-Americanos para a Educação; 2007.
9. Ministério da Saúde. Análise da tendência da morte violenta. In: Saúde Brasil 2005: uma análise da situação de saúde. Secretaria de Vigilância em Saúde / Departamento de Análise de situação em Saúde. Brasília: Ministério da Saúde; 2005.
10. Secretaria de Estado da Saúde do Paraná [online] 2007. Available at: <http:// www.saude.pr.gov.br>. [Acess in February 18 2007].
11. Laurenti R, Mello Jorge MHP, Gotlieb SLD. A
confiabilidade dos dados de mortalidade e morbidade por doenças crônicas não transmissíveis. Ciência e Saúde Coletiva 2004; 9(4): 909-920.
12. Matos SG, Proietti FA, Barata RCB. Confiabilidade da informação sobre mortalidade por violência em Belo Horizonte, MG. Rev Saúde Pública 2007; 41(1): 76-84.
13. WHO. World report on violence and health. Geneva. World Health Organization. [online] 2002. Available at: http://www.who.int/violence_injury_prevention/ violence/world_report/en/summary_en.pdf [Acess on October 20 2008].
14. Bailey NTJ. Statistical methods in Biology. 3rd. Cambridge: Cambridge University; 1995.
15. Conselho Nacional de Secretários de Saúde. Violência: uma epidemia silenciosa, Brasília-DF, 2007; 134 p. (CONASS Documenta; 15) Available at: http://pdba. georgetown.edu/Security/citizensecurity/brazil/ documents/conass.pdf [Acess on August 28 2008].
16. Gawryszewski VP, Hidalgo NT, Valencich DM. A queda nas taxas de homicídios no Estado de São Paulo e apresentação dos dados de mortalidade por causas externas em 2004. Bol Epidemiol Paul 2005; 2 (21):11-13. Available at: http://www.cve.saude.sp.gov.br/agencia/ bepa21_externa.htm. [Acess on December 19 2007].
17. Lima MLC. A trajetória dos homicídios no estado de Pernambuco: uma abordagem epidemiológica nas duas últimas décadas do século XX. 2003. [doctorate thesis]. Recife: Centro de Pesquisas Ageu Magalhães, FIOCRUZ-ENSP; 2003.
19. IPARDES. Instituto Paranaense de Desenvolvimento Econômico e Social. Leituras regionais: mesorregiões geográficas paranaenses. Sumário executivo. Curitiba-PR 2004. 32 p. Available at: http://www.ipardes.gov.br/ biblioteca/docs/leituras_reg_sumario_executivo.pdf [Acess on October 13 2008].
20. Andrade SM, Soares DA, Souza RKT, Matsuo T, Souza HD. Homicídios de homens de 15 a 29 anos e fatores relacionados no Estado do Paraná, Brasil, 2002/2004. Available at: http://www.abrasco.org.br/ cienciaesaudecoletiva/artigos/artigo_int.php?id_ artigo=1831 [Acess on November 5 2008].
21. Ramão FP, Wadi YM. Espaço urbano, desigualdade socioespacial e a dinâmica dos homicídios em Cascavel/ Pr. Trabalho apresentado no XVI Encontro Nacional de Estudos Populacionais, realizado em Caxambu-MG-Brasil, de 29 de setembro a 03 de outubro de 2008. Available at: http://www.abep.nepo.unicamp.br/ encontro2008/docsPDF/ABEP2008_ 1163.pdf. [Acess on October 20 2008].
22. Aidar T, Soares M. Desigualdade, vulnerabilidade social e a mortalidade por causas violentas no contexto metropolitano: o caso de Campinas, Brasil. In: CUNHA JMP (organizer). Novas Metrópoles Paulistas: população, vulnerabilidade e segregação. Campinas: Núcleo de Estudos de População-Nepo/Unicamp; 2006. p 561-579.
23. Zaluar A. Violence related to illegal drugs “Easy Money” and justice in Brazil: 1980-1995. UNESCO 1999. Management of Social Transformations – MOST. Discussion Paper, n.35. Available at: http://unesdoc. unesco.org/images/0011/001191/119104Eo.pdf [Acess on November 19 2008]
24. Barata RB, Sampaio MC, Ribeiro MCSA. Relação entre homicídios e indicadores econômicos em São Paulo, Brasil, 1996. Rev Panam Salud Publica 2000; 7(2):118-23.
25. Soares SSD. Educação: um escudo contra o homicídio? IPEA. Instituto de Pesquisa Econômica Aplicada. Texto para discussão 1298. Brasília-DF, 2007. Available at: <http://www.ipea.gov.br/sites/000/2/publicacoes/tds/ td_1298.pdf>. [Acess on September 12 2007].