DOI: http://dx.doi.org/10.5007/1980-0037.2017v19n5p608
Development of a Body Image Scale for Brazilian
women
Desenvolvimento de uma Escala de Imagem Corporal
para mulheres brasileiras
Catiane Souza1
Erik Menger Silveira1
Emanuelle Francine Detogni Schmit1
Edgar Santiago Wagner Neto1
Letícia Miranda Resende da Costa1
Cloud Kennedy Couto de Sá2
Jefferson Fagundes Loss3
Abstract – Body image is an important parameter of body satisfaction and needs to be evaluated with instruments developed and validated for a speciic population. he aim of this study was to develop and validate a scale to assess body image in Brazilian women. A scale consisting of 11 silhouettes was prepared. Content validation was performed by seven experts from diferent health areas. To assess repeatability (two consecutive assessments) and reproducibility (reassessment after one week), an intentional sample stratiied into four groups according to the characterization of Brazilian women regarding nutritional status was selected. Participants were 125 women aged 18-55 years and body mass index (BMI) between 18.5 and 38.6 kg/m2. he Kappa coeicient (k) was used to assess repeatability and reproducibility, considering the isolated responses of the current body, ideal body and
the diference between them, assumed as satisfactory when k≥0.6. For all trials, α=0.05.
During the content validation phase, the instrument developed was changed following the evaluators’ suggestions and it was considered very suitable by six of seven evaluators. he Kappa coeicient was good in isolated issues and in the diference between them in both repeatability and reproducibility. he Body Image Scale was considered a valid content, with good repeatability and reproducibility. Considering the instrument as low cost and of rapid implementation/evaluation, it may be used to evaluate the body im-age of Brazilian women with BMI between 18.5 and 38.6 kg/m2, in diferent contexts.
Key words: Body image; Brazil; Validation studies.
Resumo – A imagem corporal é um importante parâmetro de satisfação com o corpo e precisa ser avaliada com instrumentos desenvolvidos e validados para uma população especíica. O estudo teve como objetivo desenvolver e validar uma escala para avaliação de imagem corporal em mulheres brasileiras. Foi elaborada uma escala composta por 11 silhuetas. Sete experts, em diferentes áreas da saúde izeram a validação de conteúdo. Para avaliar a repetibilidade (duas avaliações consecutivas) e a reprodutibilidade (reavaliação após uma semana) foi selecionada uma amostra intencional estratiicada em quatro grupos de acordo com a caracterização de brasileiras segundo o seu estado nutricional. Participaram 125 mulheres de 18 a 55 anos e IMC de 18,5 a 38,6 kg/m2. Para avaliar a repetibilidade e a reprodutibilidade, foram consideradas as respostas isoladas do corpo atual, do corpo ideal e da diferença entre eles, por meio do Coeiciente Kappa (k), sendo que, seria considerado satisfatório k ≥ 0,6. Para todos os testes α = 0,05. Na fase de validação de conteúdo o instrumento desenvolvido, e alterado conforme sugestões dos avaliado-res, foi considerado muito adequado por seis dos sete experts. A concordância Kappa foi boa nas questões isoladas e na diferença entre elas, tanto na repetibilidade, quanto na reprodutibilidade. A Escala de Imagem Corporal foi considerada com validade de conteúdo, apresentando uma boa repetibilidade e reprodutibilidade. Sendo um instrumento de baixo custo e rápida aplicação/ avaliação, pode ser utilizado na avaliação da insatisfação com a imagem corporal de brasileiras
1 Federal University of Rio Grande do Sul. Graduate Program in Human Movement Sciences. Porto Alegre, RS, Brazil.
2 State University of Feira de Santa-na. Collegiate of Physical Education, Department of Health. Feira de Santana, BA, Brazil.
3 Federal University of Rio Grande do Sul. Department of Physical Educa-tion, School of Physical EducaEduca-tion, Physiotherapy and Dance. Porto Alegre, RS, Brazil.
Received: March 17, 2017
More and more exposed bodies generate an incessant search for a massively popular pattern in the media as ideal: young, handsome and muscular for men and thin for women, without which it does not seem possible to ind happiness and success1,2. his excess disclosure of a pattern to be followed
afects, especially young women, the population that is the main target of this social “pressure” in search of the perfect body, which can trigger vari-ous inappropriate behaviors such as depression, eating disorders and / or excess physical activities2-4. Since inappropriate behaviors can be considered
a large-scale problem5, diferent areas of knowledge such as pedagogy,
dance, medical sciences, psychology, philosophy, sociology, and physical education have addressed this issue through body image6.
Body image is understood as the iguration of our body formed in our mind about the body dimensions and information of the level of body satisfaction or rejection, that is, the way in which the body presents itself to us, not only as a cognitive construct, but also as a representation of de-sires, emotions and socialization with other individuals7-9. Its evaluation
can be made by scales of silhouettes that provide a body design in which the person should identify his / her current body and how he / she would like it to be, and the diference of these responses has been understood as a measure of body dissatisfaction10. his type of instrument takes
advan-tage of being compared to the others, because in addition to being more practical, due to its rapid application and interpretation of results, it has the capacity to collect data from large groups11, which makes it more suitable
for population research. he choice of the appropriate instrument for each population is a delicate issue, since a scale must take into account ethno-logical characteristics without attributing singularities to its silhouettes12.
Scagliusiet al.13 validated for the Brazilian population a scale developed
for the American population. However, this scale did not take into account the speciic characteristics of Brazilians, which is a problem12. Although
there is a test-retest reliability scale developed speciically for Brazilians14,
it presents some limitations, such as asymmetries and lateralized position in silhouettes, which are factors that may make it diicult for participants to choose at the time of test application15.
After reviewing the instruments to evaluate body image in the Brazilian population, Carvalho and Ferreira16 reported that due to the complexity
and multidimensionality of the subject, there is still a need for an expres-sive number of instruments that evaluate body image in this population. Despite the advances in knowledge about the subject, a large number of studies use non-validated measures, so that there is still a methodological gap that makes it diicult to understand body image in the Brazilian population17. herefore, the present study aims to develop and validate a
in epidemiological, clinical, prevention and health promotion, socio-po-litical and cultural contexts17,18.
METHODOLOGICAL PROCEDURES
Based on the existing instruments13,14,19, a scale was elaborated with 11
silhouettes representative of female bodies, which proportionally increase from left to right in order to cover diferent body proiles of Brazilian women. he literature indicates that the ideal number of silhouettes should be greater than nine, since smaller number of silhouettes may limit the choice and very high number may make it diicult to choose because it causes confusion at the moment of evaluation15,19. In addition to the number
of available silhouettes, this type of instrument requires some care, such as constant increase among adjacent silhouettes, the absence of body details that may act as distracting elements or relect speciic ethnicities20,
propor-tional change among body regions and constant height among silhouettes19.
he instrument is composed not only of silhouettes but also of two objective questions: “Which image represents your current body?” And “Which image represents the body you would like to have?” (Figure 1). he diference between response of the second and irst question expresses the level of body dissatisfaction. Body dissatisfaction can thus be numerically expressed, starting from zero, the same answer in both questions, that is, no dissatisfaction, reaching ten, maximum dissatisfaction. he numerical result can still be positive or negative, representing the desire to be greater or the desire to be smaller, respectively.
Seven experts in health areas related to movement (physical education, physical therapy, dance and medicine) were invited to participate in the content validation21,22 of the Body Image Scale. hese evaluators received
the Body Image Scale for evaluation, where they were asked to answer a validation questionnaire composed of three objective questions, referring to clarity, ease of understanding and instrument applicability, as well as the analysis of each image separately. he evaluators were also able to add suggestions and proposed changes to the instrument in a descriptive way. After the instrument was changed according to suggestions, evaluators responded a second time to the same validation questionnaire.
Both studies that validated scales for Brazilians used 4614 and 9813
subjects, did not present sample calculation or data necessary to support the sample calculation of the present study. In order to overcome this limitation, a sample calculation was performed considering power of 95% and signiicance level of 5%. he values found by Di Pietro E Silveira23
were used when validating the Brazilian version of the Body Image Ques-tionnaire in 164 female university students. According to results of the sample calculation, performed in an electronic sample calculator from the Laboratory of Epidemiology and Statistics, Faculty of Medicine of the University of the State of São Paulo24, an intentional sample was selected,
ian characterization according to their nutritional status and to IBGE25,
based on the Body Mass Index (BMI). hus, the sample consisted of 4% of participants with BMI below 18.5 kg / m², 31% with BMI between 18.5 and 24.9 kg / m², 48% with BMI between 25 and 29.9 kg / m² and 17% with BMI greater than or equal to 30 kg / m². he present study was approved by the Ethics Research Committee of the University where it was developed, registered in the Brazil Platform under CAAE number 19256713.9.0000.5347. his research followed Resolution 466/12 of the National Health Council.
On the irst day of data collection, all participants signed the Free and Informed Consent Form, shortly thereafter, body mass and height were measured using a portable digital scale with sensitivity of 100 g (TechLine) and a tape measure with sensitivity of 1 mm (Sanny, São Bernardo do Campo, São Paulo). Each participant then received the Body Image Scale represented in Figure 1, in a reserved place, and was asked to complete it. With the intention of measuring the instrument repeatability, immediately after, a new copy of the Body Image Scale was delivered. In order to avoid that the participant simply repeated the number that had been chosen in the previous application, based on the memory, in this new copy of the scale, the numbers of silhouettes were replaced by letters in decreasing order (from “k” to “a”). After exactly seven days, they were asked to re-ill only the original version (with numbered silhouettes) to test the instrument reproducibility26.
Body Image Scale
Which of these images represents your current body? (1) (2) (3) (4) (5) (6) (7) (8) (9) (10) (11) Which of these images represents your ideal body?
(1) (2) (3) (4) (5) (6) (7) (8) (9) (10) (11)
Figure 1. Body Image Scale
irst day versus the responses of evaluation made one week later, both with silhouettes identiied by numbers. In order to evaluate repeatability and reproducibility, the isolated responses of the current body, ideal body and the diference between responses were considered. Statistical analysis was performed using SPSS for Windows software (version 20.0) using Kappa coeicient (k). In order to classify the Kappa coeicient results, the meth-odology proposed by Schlademann et al.27 was adopted, which proposed
the following categorization: poor (k <0.2), intermediate (0.2 ≤ k <0.4), moderate (0.4 ≤ k <0.6), good (0.6 ≤ k <0.8), and very good (k ≥ 0.8). To be considered satisfactory, Kappa should be greater than or equal to 0.6. In order to compare the results obtained with those found in literature, the Pearson and Spearman correlations were also calculated for repeatability and reproducibility data.
he answer to the irst question of the Body Image Scale (which im-age represents your current body?) is loaded with subjective information and individual interpretations, inluenced by cultural, regional, and other issues. In this perspective, there is no “gold standard” with which the answer can be compared in order to evaluate how representative of the bodies evaluated are the scale of silhouettes. As a way to overcome this limitation, and considering the BMI as an objective representation of the body image of participants, the correlation between this index and the answer to the irst question of the Body Image Scale was calculated. It is understood that a strong correlation means that the choice made from the Body Image Scale is representative of body dimensions. To evaluate whether there was a correlation between the result reported on the scale as the current body and the BMI, a Spearman correlation coeicient was applied. he signiicance level adopted in all tests was 5%28.
RESULTS
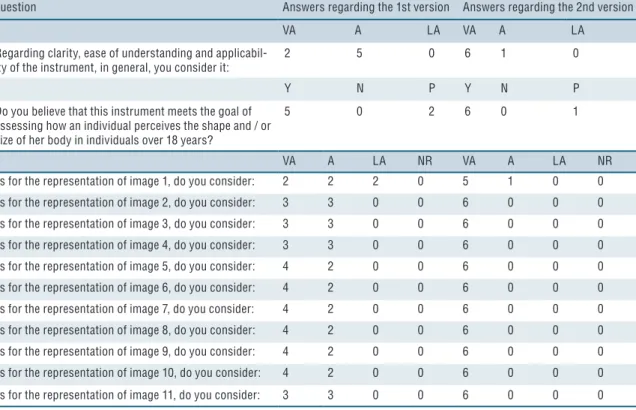
With the answers obtained in the irst question, modiications to the Body Image Scale were performed according to the evaluators’ sugges-tions. To inalize the content validation process, evaluators were asked to evaluate the new Body Image Scale. he seven experts answered the validation questionnaire; however, one of the evaluators did not answer the questions related to the individual evaluation of each image in none of the two evaluations (Table 1). In view of the favorable result of the major-ity of evaluators for the questions (1) clarmajor-ity, ease of understanding and applicability of the instrument’s scoring template model; (2) objectivity; and (3) individual evaluation of images, it was considered that the Body Image Scale (Figure 1) presented content validity, being able to move to the second phase of the study.
he mean data from each group stratiied by the BMI percentage of Brazilian women, according to IBGE25, allowed characterizing the study
Question Answers regarding the 1st version Answers regarding the 2nd version
VA A LA VA A LA
Regarding clarity, ease of understanding and applicabil-ity of the instrument, in general, you consider it:
2 5 0 6 1 0
Y N P Y N P
Do you believe that this instrument meets the goal of assessing how an individual perceives the shape and / or size of her body in individuals over 18 years?
5 0 2 6 0 1
VA A LA NR VA A LA NR As for the representation of image 1, do you consider: 2 2 2 0 5 1 0 0 As for the representation of image 2, do you consider: 3 3 0 0 6 0 0 0 As for the representation of image 3, do you consider: 3 3 0 0 6 0 0 0 As for the representation of image 4, do you consider: 3 3 0 0 6 0 0 0 As for the representation of image 5, do you consider: 4 2 0 0 6 0 0 0 As for the representation of image 6, do you consider: 4 2 0 0 6 0 0 0 As for the representation of image 7, do you consider: 4 2 0 0 6 0 0 0 As for the representation of image 8, do you consider: 4 2 0 0 6 0 0 0 As for the representation of image 9, do you consider: 4 2 0 0 6 0 0 0 As for the representation of image 10, do you consider: 4 2 0 0 6 0 0 0 As for the representation of image 11, do you consider: 3 3 0 0 6 0 0 0 VA = very adequate; A = adequate; LA = little adequate; Y = yes; N = no, P = partly; NR = no response.
Table 2. Sample characterization
Groups by BMI (Kg/m²) ˂18.5 n=5
18.5 to 24.9 n=39
25.0 to 29.9 n=60
≥30 n=21 Height (m)
Mean 1.63 1.63 1.58 1.61
SD 0.08 0.08 0.06 0.05
Minimum 1.55 1.48 1.43 1.53
Maximum 1.73 1.78 1.71 1.72
Weight (kg)
Mean 49.0 57.3 66.1 85.7
SD 4.7 7.1 6.6 8.8
Minimum 44.1 44.5 51.7 70.3
Maximum 55.1 70.0 78.9 99.3
BMI (Kg/m²)
Mean 18.3 21.3 26.2 32.7
SD 0.2 1.4 0.9 2.5
Minimum 18.0 18.8 25.0 30.0
Maximum 18.4 21.4 28.9 38.6
Age (years)
Mean 19 27 31 35
SD 1 8 10 12
Minimum 18 19 18 19
Maximum 21 48 55 55
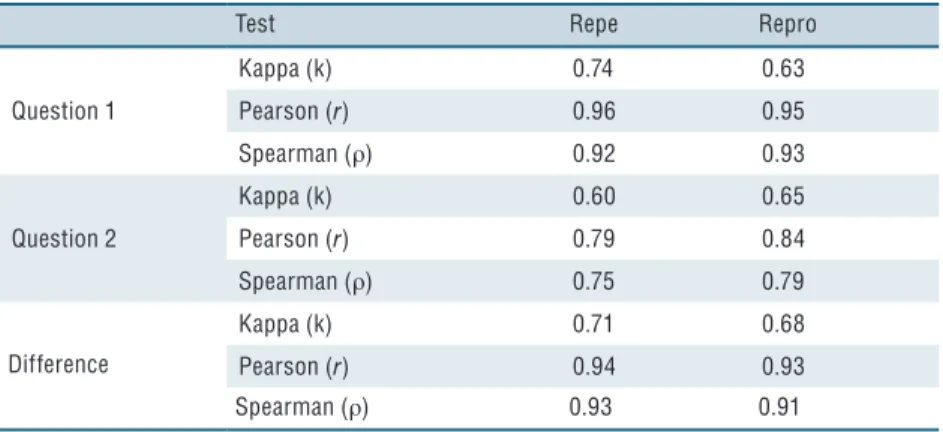
In the evaluation of the instrument repeatability and reproducibility, all evaluated items reached k equal to or higher than 0.6 (Table 3), values considered satisfactory according to pre-established criteria. Signiicant cor-relation (r = 0.67, p <0.05) was found between variables, body mass index (BMI) and the silhouette indicated as the one that best represents the current body (body iguration), performed by the Spearman’s correlation coeicient.
Table 3. Repeatability and Reproducibility of the Body Image Scale.
Test Repe Repro
Question 1
Kappa (k) 0.74 0.63 Pearson (r) 0.96 0.95 Spearman (ρ) 0.92 0.93
Question 2
Kappa (k) 0.60 0.65 Pearson (r) 0.79 0.84 Spearman (ρ) 0.75 0.79
Difference
Kappa (k) 0.71 0.68 Pearson (r) 0.94 0.93 Spearman (ρ) 0.93 0.91
DISCUSSION
he results showed that the instrument was considered very adequate by six of the seven experts that have previously evaluated it, in the content valida-tion phase. Since these professionals are from diferent areas, the importance of these results is highlighted, characterizing a possible multidisciplinary applicability of the developed instrument. hrough the results obtained in the test-retest, it could be inferred that the scale is valid considering the kappa agreement between the two consecutive evaluations (repeatability) and between the two evaluations with a seven-day interval (reproducibility).
Other scales have already been suggested to evaluate body image, but the Kappa index was not the statistic used for validation14,20,29. hese studies use
only correlation to evaluate repeatability and reproducibility, but correlation measures the linear relationship between two variables, while the Kappa in-dex measures the degree of agreement present in multiple evaluations of the same phenomenon, being more indicated for this purpose28,30. In addition, the
Pearson’s correlation is indicated for parametric data28, in case of validation
of scales, it is imperative that researchers recognize the non-interval nature of the scale and use non-parametric statistics in their analyses19.
In order to establish a correlation between the results of the present study and others already published, Pearson and Spearman’s correlation coeicients were also calculated. When comparing the values obtained in the correlations with those found in literature, better results were observed in the present study in comparison to the other studies13,14,20 which, like
r = 0.31, but they deine the scale as validated due to p <0.05 found in the correlation, even though this value is not indicated for the interpretation of the correlation results28. In scales available to Brazilians13,14, Scagliusiet
al.13 considered their instrument to be valid through correlation of BMI
with participants’ responses (current body r = 0.76 and ideal body r = 0.72). Kakeshitaet al.14 evaluated the reproducibility through Pearson’s
correlation and Student’s t-test, and the correlation ranged from r = 0.92 in the test-retest of the body silhouette pointed as current and r = 0.85 in the test-retest of the desired body. he t-test was not signiicant in none of the comparisons.
It is also possible to observe Spearman’s positive correlation r = 0.67 between participant’s BMI and the response indicated as representative of the current body, which indicates good correlation between variables, similar to results found using the Pearson’s correlation by hompson and Gray20 r = 0.59, and by Kakeshitaet al.14 who found r = 0.84.
he lack of an expert in the ield of psychology during the content validation phase can be pointed out as a study limitation, as well as the lack of construct validity. Other limiting aspects are due to the fact that only residents of Rio Grande do Sul participated in the sample, and the fact that participants with more severe degrees of thinness and obesity were not included in the sample, and there is no answer option for those who do not they feel represented by none of the silhouettes.
CONCLUSIONS
he Body Image Scale was developed and considered with content valid-ity, presenting good repeatability and reproducibilvalid-ity, as well as a good correlation between the Silhouette indicated as the current body and the individual’s BMI. As applicability, it could be considered that the instru-ment has an accessible and simple evaluative character and could be easily applied to assist in the process of evaluating body image dissatisfaction among adult Brazilians with BMI between 18.5 and 38.6 kg / m2,
repro-ducing results similar to those found in literature. In addition, as it is a low-cost and rapid application / evaluation instrument, it could be used in epidemiological, clinical, health prevention or promotion, socio-political and cultural contexts.
REFERENCES
1. Albino BS, Vaz AF. O corpo e as técnicas para o embelezamento feminino:
es-quemas da indústria cultural na Revista Boa Forma. Mov 2008;14(1):199-223.
2. Maldonado GDR. A educação física e o adolescente: a imagem corporal e a
estética da transformação na mídia impressa. Rev Mackenzie Educ Fís Esporte 2006;5(1):59-76.
3. Damasceno VO, Lima JRP, Vianna JM, Vianna VRA, Novaes JS. Tipo físico ideal
4. Oliveira FP, Bosi MLM, Vigário PS, Vieira RS. Comportamento alimentar e imagem corporal em atletas. Rer Bras Med Esporte 2003;9(6):348-56.
5. Sante AB,PasianSR. Imagem Corporal e características de personalidade de
mul-heres solicitantes de cirurgia plástica estética. Psicol Relex Crit 2011;24(3):429-37.
6. Turtelli LS, Tavares MCGCF, Duarte E. Caminhos da pesquisa em imagem
cor-poral na sua relação com o movimento. Rev Bras Cienc Esporte 2002;24(1):151-66.
7. Cash TF, Smolak L. Body image: A Handbook of Science, Practice, and
Preven-tion. 2nd. New York; he Guilford Press; 2011.
8. Quadros TMB,Gordia APM,Rebolho C, SilvaDAS, Ferrari EP,Petroski EL.
Imagem corporal em universitários: associação com o estado nutricional e sexo. Motriz 2010;16(1):78-85.
9. Schilder P. A imagem do corpo: as energias construtivas da psique. 3.ed. São Paulo;
Martins Fontes; 1999.
10. Hirata E,Pilati R. Desenvolvimento e validação preliminar da Escala Situacional
de Satisfação Corporal- ESSC. Psico-USF 2010;15(1):1-11.
11. Fallon AE, Rozin P. Sex diferences in perceptions of desirable body shape. J
Abnorm Psychol 1985;94(1):102-5.
12. Moraes C, Anjos LAD, Marinho SMSA. Construção, adaptação e validação de
escalas de silhuetas para autoavaliação do estado nutricional: uma revisão sistemática da literatura. Cad Saúde Públ 2012;28(1):7-19.
13. Scagliusi FB, Alvarenga M, Polacow VO, Cordás TA, Queiroz GKO, Coelho D,
et al. Concurrent and discriminant validity of the Stunkard’s igure rating scale adapted into Portuguese. Appetit 2006;47(1):77-82.
14. Kakeshita IS, Silva AIP, Zanatta DP, Almeida SS. Construção e idedignidade
teste-reteste de escalas de silhuetas brasileiras para adultos e crianças. Psic Teor Pesq 2009;25(2):263-70.
15. Ambrosi-Randic N, Pokrajac-Bulian A, Takišić V. Nine, seven, ive, or three: how
many igures do we need for assessing body image? Percept Mot Skills 2005;100(2): 488-92.
16. Carvalho PHB, Ferreira MEC. Imagem Corporal em Homens: Instrumentos
Avaliativos. Psic Teor Pesq 2014;30(3):277-85.
17. Laus MF, Kakeshita IS, Costa TMB, Ferreira MEC, Fortes LS, Almeida SS. Body
image in Brazil: recent advances in the state of knowledge and methodological issues. Rev Saude Publica 2014; 48(2):331-46.
18. Conti MA, Slater B, Latorre MRDO. Validação e reprodutibilidade da
es-cala de evaluación de insatisfación corporal para adolescentes. Rev Saude Publica 2009;43(3):515-24.
19. Gardner RM, Friedman BN, Jackson NA. Methodological concerns when using
silhouettes to measure body image. Percept Mot Skills 1998;86(2):387-95.
20. hompson MA, Gray JJ. Development and validation of a new body-image
as-sessment scale.J Personal Assess 1995;64(2):258-69.
21. Benedetti G, Candotti CT, Gontijo KNS, Bampi GM, Loss JF. Desenvolvimento
e validação de um método de avaliação do nível de prática no método Pilates por meio de exercícios do próprio método. Fisioter Bras 2015;16(2):137-44.
22. Gontijo KNS, Candotti CT, Feijó GS, Ribeiro LP, Loss JF. Dynamic evaluation
method of lower limbs joint alignment (MADAAMI) for dancers during the plié. Rev Bras Cienc Esporte 2017;39(2):148-59.
23. Di Pietro M, Silveira DX. Internal validity, dimensionality and performance of
the body shape questionnaire in a group of Brazilian college students. Rev Bras Psiquiatr 2009;31(1):21-24.
24. Pereira JCR, Paes AT, Okano V. Questões comuns sobre Epidemiologia, Estatística
e Informática. 2000. Disponível em: <http://www.lee.dante.br/pesquisa/metodo-logia/revista_idpc_2000.pdf> [2014 mai 18].
25. IBGE, Instituto Brasileiro de Geograia e Estatística. Pesquisa de Orçamentos
CORRESPONDING AUTHOR
Catiane Souza
Rua Felizardo, 750 – LAPEX Jardim Botânico
90690-200 – Porto Alegre, RS. Brasil
E-mail [email protected] on the occurrence and severity of back pain in a German population sample. Int J
Public Health 2008;53(2):96-103.
28. Field, A. Descobrindo a estatística usando o SPSS. 2 ed. Porto Alegre; Artmed;
2009.
29. Cohen J. Weighted kappa: nominal scale agreement with provision for scaled
disagreement or partial credit. Psychol Bull 1968;70(4):213-20.
30. Goldberg JP, Lenart EB, Bailey SM, Kof E. A new visual image rating scale for