*Correspondence: Vahid Kiarostami. Department of Chemistry, North Tehran Branch, Islamic Azad University, Shariati street, Zafar Station, Daftari Alley, No: 9, Postal code: 1913674711, Tehran, Iran. E-mail: [email protected]
A
vol. 50, n. 3, jul./sep., 2014 http://dx.doi.org/10.1590/S1984-82502014000300014
Analysis of chlorpheniramine in human urine samples using
dispersive liquid-liquid microextraction combined with
high-performance liquid chromatography
Mehdi Maham
1, Vahid Kiarostami
2,*, Syed Waqif-Husain
3, Malihe Khoeini Sharifabadi
31Department of Chemistry, Aliabad Katoul Branch, Islamic Azad University, Aliabad Katoul, Iran, 2Department of Chemistry,
North Tehran Branch, Islamic Azad University, Tehran, Iran, 3Department of Chemistry, Science and Research Branch, Islamic Azad University, Tehran, Iran
A simple and environmentally friendly microextraction technique was used for determination of chlorpheniramine (CPM), an antihistamine drug, in human urine samples using dispersive liquid–liquid microextraction (DLLME) followed by high performance liquid chromatography with diode array detection (HPLC-DAD). In this extraction technique, an appropriate mixture of acetonitrile (disperser solvent) and carbon tetrachloride (extraction solvent) was rapidly injected into the urine sample containing the target analyte. Tiny droplets of extractant were formed and dispersed into the sample solution and then sedimented at the bottom of the conical test tube by centrifugation. Under optimal conditions, the calibration curve was linear in the range of 0.055-5.5 µg mL-1, with a detection limit of 16.5 ng mL-1.
This proposed method was successfully applied to the analysis of real urine samples. Low consumption of toxic organic solvents, simplicity of operation, low cost and acceptable igures of merit are the main advantages of the proposed technique.
Uniterms: Chlorpheniramine/determination in human urine. High-performance liquid chromatography/ quantitative analysis. Dispersive liquid-liquid microextraction/quantitative analyisis. Antihistamines. Human urine/analysis.
Utilizou-se uma técnica de microextração simples e ambientalmente amigável para a determinação de clorfeniramina (CPM), anti-histamínico, em amostras de urina humana, utilizando a microextração dispersiva líquido-líquido (DLLME), seguida por cromatograia líquida de alta eiciência com detecção por arranjo de diodos (HPLC-DAD). Nesse método de extração, mistura apropriada de acetonitrila (solvente dispersor) e tetracloreto de carbono (solvente de extração) foi injetada rapidamente na amostra de urina contendo o analito alvo. As pequenas gotículas de agente de extração foram formadas e dispersas na solução da amostra e, em seguida, sedimentadas no fundo do tubo cônico de ensaio por centrifugação. Em condições ótimas, a curva de calibração foi linear no intervalo entre 0,055 e 5,5 µg mL-1, com limite
de detecção de 16,5 ng mL-1. O método proposto foi aplicado com sucesso na análise de amostras de
urina reais. Baixo consumo de solventes orgânicos tóxicos, simplicidade de operação, baixo custo e iguras de mérito aceitáveis são as principais vantagens do método sugerido.
INTRODUCTION
Chlorpheniramine (CPM, [3-(p -chlorophenyl)-3-(2-pyridyl)-N,N-dimethylpropylamine]) is a histamine H1 -receptor antagonist, which is often found as an ingredient of ‘over-the counter’ treatments to alleviate symptoms of the common cold and allergic conditions (Fried et al.,
2002). In the World Health Organization standards, CPM is considered as an essential drug due to its effectiveness and low cost. Therefore, it is distributed worldwide as a generic compound (Hiep et al., 1998). Methods for the analysis of the CPM from human samples (such as urine) are required for kinetic studies, diagnosis and effective treatment of the poisoning and for forensic purposes (Baker, Borys, 2002; Hasegawa et al., 2006).
Sample pretreatment is the most labor-intensive and time-consuming step in an analytical method. Traditional methods such as liquid–liquid extraction (LLE) and solid phase extraction (SPE) have been widely used as sample preparation methods for extraction and preconcentration of analytes (Benjamin, Xiaochen, 2007; Zhu et al., 2011). These methods are time consuming, tedious, relatively expensive and use large amounts of sample and toxic organic solvents and thus produce high secondary wastes. To overcome these disadvantages, miniaturization and expansion of environmentally extraction methods have been considered by many researchers in the past decades. Liquid-phase microextraction (LPME), a miniaturization of the liquid–liquid extraction, was introduced by Cantwell and co-workers (Jeannot, Cantwell, 1996). Several LPME techniques such as single drop microextraction (SDME) (Alothman et al., 2012), solvent bar microextraction (SBME) (Kamarei, Ebrahimzadeh, Yamini, 2010),hollow iber-LPME (HF-LPME)(Lee et al., 2008; Ebrahimzadeh
et al., 2012) and liquid–liquid–liquid microextraction (LLLME)(Lin, Fuh, Huang, 2011; Gao et al., 2012) have been developed. Furthermore, Dispersive liquid–liquid microextraction (DLLME) has been introduced as a novel LPME by Assadi research group (Rezaee et al., 2006). In the latter technique, a suitable mixture of extraction and disperser solvents is rapidly injected into the aqueous sample by a syringe. A cloudy solution then results from the formation of tiny droplets of the extraction solvent. After extraction, the enriched droplets of extractant in the sample solution are collected at the bottom of the conical test tube by centrifugation. Determination of analyte in the sediment phase can be accomplished by instrumental techniques (Ezoddin, Shemirani, Jamali, 2010; Kazemi, Shokoui, Shemirani, 2011).
Our research group has developed DLLME for the extraction and pre-concentration of some organic
compoundsin different food and biological samples (Karami-Osboo et al., 2013; Maham et al., 2013a,b,c).In the present study, we used DLLME-HPLC technique for determination of CPM in human urine samples. Signiicant parameters, which inluence the eficiency of the system were investigated and optimized in detail.
EXPERIMENTAL
Apparatus
HPLC analysis was performed using a Waters HPLC system equipped with two 515 pumps and a photodiode array detector (Waters, USA). The analytical column was packed with C8 stationary phase (250 × 4.6 mm I.D.,
particle size 5 µm). The mobile phase used for the analysis consisted of a mixture of ammonium acetate (0.03 M, pH=5.5) and acetonitrile (50:50 v/v) at a flow rate of 1 mL min-1
Reagents
Solvents used for chromatography were of HPLC grade and the other chemicals were of analytical grade and obtained from Merck Chemical Co (Germany). CPM was purchased from United States Pharmacopeia (USP). A stock solution containing 10 mg L-1 of CPM
was prepared by dissolving the appropriate amount of the corresponding pure salt in acetonitrile and stored at 4
oC. Working solutions were prepared by serial spiking of
drug free urine samples with the standard solution. Drug free urine samples were collected from healthy adults not exposed to any drug for at least 2 months. Real urine samples were collected from patient under treatment after 12 h after administration of a single oral dose of CPM.
Sample preparation
The amount of 10 mL of urine was spiked with CPM and basiied using sodium hydroxide. After centrifuging for 10 min at 4000 rpm, a white solid lipid was sedimented at the bottom of the conical test tube, probably due to the co-sedimentation of matrixes (such as urea and uric acid) in urine at high pH values. A 5 mL aliquot of the supernatant solution was used for DLLME.
Dispersive liquid–liquid microextraction procedure
(1) A 5 mL aliquot of the pretreated urine sample was placed in a 10 mL test tube.
(2) After rapidly injection of 0.6 mL acetonitrile (dis-perser solvent) containing 30 µL carbon tetrachlo-ride (extraction solvent) into the urine sample using a 1.00 mL syringe, a cloudy state was formed in the conical test tube.
(3) The solution was centrifuged for 10 min at 4000 rpm. Subsequently, the dispersed ine droplets of carbon tetrachloride deposited in the conical bottom test tube along with whitish matrixes.
(4) After removing the whole aqueous solution, the sedi-mented phase was dissolved in 300 µL acetonitrile, il-trated through a 0.45 µm membrane and inally 20 µL of the extract was injected into an HPLC system.
RESULTS AND DISCUSSION
Selection of extraction solvent
In order to obtain maximum extraction eficiency, some important parameters such as extraction solvent type must be investigated in detail. In conventional DLLME, the extraction solvent should have a higher density than water to be collected at the bottom of the test tube after centrifuging. Also, the extraction solvent must have excellent extraction ability for target analyte and low solubility in the aqueous sample. In this study, a series of sample solutions were studied by using 0.6 mL acetonitrile containing 20 µL different extraction solvents such as carbon tetrachloride, chlorobenzene and dichloromethane. Laboratory observations showed that a two-phase system was not observed when dichloromethane was used as the extractant due to its high solubility in aqueous solution (Daneshfar, Khezeli, Lotfi, 2009). According to the experimental results (Figure 1), carbon tetrachloride had the best extraction eficiency for CPM. Therefore, carbon tetrachloride was selected as the extraction solvent in the subsequent experiments.
Selection of disperser solvent
The disperser solvent is used in DLLME to allow the formation of ine droplets of extraction solvent, which increases the mass transfer of the analyte as a result of the improved liquid–liquid interface. The disperser solvent must be miscible in the organic (extraction solvent) and aqueous phases (sample solution). Thus, the effects of acetone, methanol, acetonitrile, and ethanol on the extraction eficiency of CPM were studied. The results shown in Figure 2 indicate that the best performance for
FIGURE 1 - Effect of extraction solvent type on the extraction
efficiency. Conditions: CPM concentration: 0.5 µg mL-1; volume of extraction solvents: 20 µL; disperser solvent, volume: acetonitrile, 0.6 mL; pH value: 10; no salt addition. [N.A.: not applicable (extraction solvent was not separated from sample solution after centrifuging)].
0 5000 10000 15000 20000 25000 30000 35000 40000 45000 50000
Ethanol Acetonitrile Acetone Methanol
P
eak ar
ea
Disperser solvent
extraction of CPM in urine samples is obtained when acetonitrile is used as the disperser solvent. Acetonitrile was chosen for further experiments.
Effect of extraction solvent volume
During DLLME process, the extraction solvent volume is an essential factor inluencing the formation of droplets after centrifuging. For optimization purposes, various experiments were performed using 0.6 mL acetonitrile containing different volumes of carbon tetrachloride (10, 20, 30 and 40 µL). As shown in Figure 3, the best sensitivity was obtained when 30 µL carbon tetrachloride and 0.6 mL acetonitrile were used. The optimal result can be attributed to the best volume ratio between the disperser and the extraction solvents to form a stable cloudy solution.
FIGURE 2 - Effect of disperser solvent type on the extraction
efficiency. Conditions: CPM concentration: 0.5 µg mL-1; extraction solvent, volume: carbon tetrachloride, 20 µL; volume of disperser solvents: 0.6 mL; pH value: 10; no salt addition.
0 10000 20000 30000 40000 50000 60000
10 20 30 40
P
eak
area
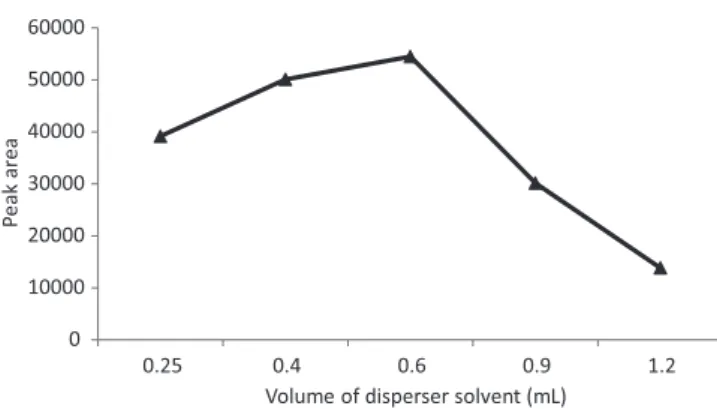
Effect of disperser solvent volume
In order to study the effect of acetonitrile volume on the extraction eficiency, different volumes of acetonitrile in the range of 0.25-1.2 mL were investigated. As shown in Figure 4, the results show that by increasing the volume of acetonitrile in the range of 0.25-0.6 mL, the extraction efficiency gradually increased, whereas at volumes higher than 0.6 mL, the extraction eficiency decreased for CPM. This decrease in the extraction performance may be related to the increase in solubility of the target analyte in aqueous sample. Based on the optimal results, 0.6 mL acetonitrile was considered for subsequent experiments.
Effect of the pH
The effect of pH in the range of 2-12 was investigated. The results, as shown in Figure 5, indicate that pH is
a critical factor, which significantly affects extraction eficiency of CPM. For CPM, as a basic analyte (pKa = 9.2)
(Capella-Peiró, Bossi, Esteve-Romero, 2006), the ionized form of analyte changed mostly to molecular form when the pH of the sample solution was greater than pKa value of the analyte. Under this condition, target analyte was easily extracted into the organic phase. According to the results obtained, the best extraction eficiency was achieved at pH value of 10.
Effect of salt
Generally, salt addition decreases the solubility of target analyte in the aqueous phase and increases its partitioning into the adsorbent (for SPME) or organic phase (LPME). To evaluate the effect of salt addition on the extraction eficiency, a series of sample solutions was studied by using different concentrations of NaCl over the range of 0-15% (w/v), while other experimental conditions were kept constant. The results obtained revealed that the maximum extraction efficiency was achieved in the presence of 7.5% NaCl (Figure 6). The gradual increase in the extraction eficiency, at concentrations of 0-7.5% (w/v) NaCl, was attributed to the decreased in the concentration of water available to dissolve the analyte molecules, which decreases the solubility of the target analyte in the aqueous phase. Decrease in extraction eficiency at concentrations of NaCl over 7.5% may be related to the increase in viscosity of the solution, and thus the decrease in the diffusion rate of the target analyte into the extraction solvent. Hence, 7.5% salt was added in the following experiments.
Method validation
The optimal conditions were chosen as follows: 30.0 µL carbon tetrachloride (extraction solvent), 0.6 mL
FIGURE 4 - Effect of the volume of disperser solvent on the
extraction eficiency. Conditions: CPM concentration: 0.5 µg mL-1;
extraction solvent, volume: carbon tetrachloride, 30 µL; disperser solvent: acetonitrile; pH value: 10; no salt addition.
0 10000 20000 30000 40000 50000 60000
2 4 6 8 10 12
P ea k a rea pH
FIGURE 5 - Effect of the pH values on the extraction eficiency. Conditions: CPM concentration: 0.5 µg mL-1; extraction solvent, volume: carbon tetrachloride, 30 µL; disperser solvent, volume: acetonitrile, 0.6 mL; no salt addition.
0 10000 20000 30000 40000 50000 60000 70000 80000 90000
0 2.5 5 7.5 10 15
P ea k a re a Ionic strength
FIGURE 3 - Effect of the volume of extraction solvent on the
extraction eficiency. Conditions: CPM concentration: 0.5 µg mL-1;
extraction solvent: carbon tetrachloride; disperser solvent, volume: acetonitrile, 0.6 mL; pH value: 10; no salt addition.
0 10000 20000 30000 40000 50000 60000
0.25 0.4 0.6 0.9 1.2
P
e
ak
area
TABLE I - Analytical performance characteristics of the DLLME-HPLC/DAD method for CPM determination under the optimum conditions
Linear range (µg mL-1) 0.055-5.5
Limit of detection (ng mL-1) 16.5
Limit of quantiication (ng mL-1) 55.2
Precision (RSD, n = 5) (%) 5.2
Enrichment factor 26.4
Curve equation (with pre-concentration) Y= 150692x + 108.48 R2= 0.9984 Curve equation (without pre-concentration) Y= 5695.3x + 270.97 R2= 0.9996
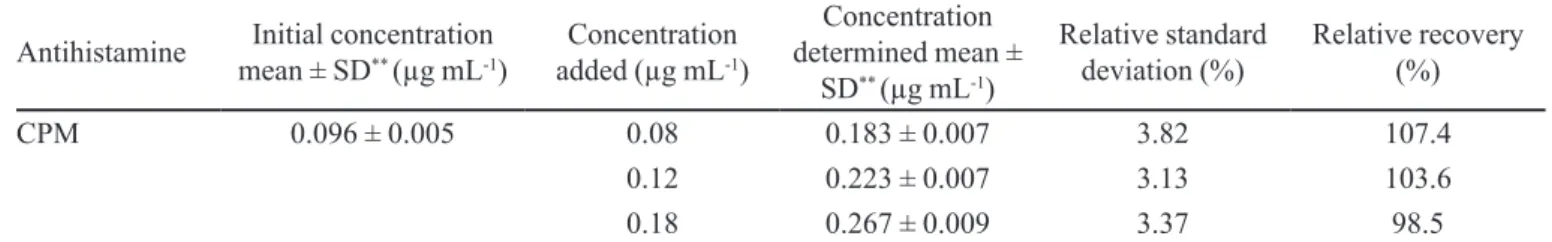
TABLE II - Relative recoveries of CPM spiked 3-level concentrations in patient urine samples under treatment*
Antihistamine Initial concentration mean ± SD** (µg mL-1)
Concentration added (µg mL-1)
Concentration determined mean ±
SD** (µg mL-1)
Relative standard deviation (%)
Relative recovery (%)
CPM 0.096 ± 0.005 0.08 0.183 ± 0.007 3.82 107.4
0.12 0.223 ± 0.007 3.13 103.6
0.18 0.267 ± 0.009 3.37 98.5
*Extraction conditions: extraction solvent, volume: carbon tetrachloride, 30 µL; disperser solvent, volume: acetonitrile, 0.6 mL;
pH value 10; ionic strength: 7.5%. **SD, standard deviation (n=3)
FIGURE 6 - Effect of the salt addition on the extraction eficiency.
Conditions: CPM concentration: 0.5 µg mL-1; extraction solvent, volume: carbon tetrachloride, 30 µL; disperser solvent, volume: acetonitrile, 0.6 mL; pH=10.
0 10000 20000 30000 40000 50000 60000 70000 80000 90000 100000
0 2.5 5 7.5 10 12.5 15
P
eak
Ar
ea
Salt addion
acetonitrile (disperser solvent), pH=10 and 7.5% salt addition. A series of drug free urine samples spiked with different concentrations of CPM were prepared and extracted under the optimal conditions. The analytical performance are summarized in Table I. Linearity of calibration curve was observed in the concentration range of 0.055-5.5 µg mL-1 with a correlation coefficient of
0.9984. The limit of detection (LOD), based on signal-to-noise ratio (S/N) of 3, and the limit of quantiication (LOQ), based on signal-to-noise ratio (S/N) of 10, were 16.5 and 55.2 ng mL-1, respectively. The repeatability of
the method presented as the relative standard deviation
(RSD) was 5.2% for five replicated measurements at 0.5 μg mL-1 of CPM. The enrichment factor, deined as
ratio of calibration curve slope with and without pre-concentration, was 26.4.
Application of the technique
In order to evaluate the influence of matrix, the optimized procedure was applied for the determination of CPM in real urine samples obtained from patient under treatment. The results showed that the concentration of target analyte in the patient urine samples was 0.096 ± 0.005 µg mL-1. These samples were then spiked with
CPM standard at three different levels and analyzed by the suggested method. The results of relative recoveries of CPM (Table II) were in the range of 98.5%–107.4%, demonstrating that the drug and its metabolites with endogenous major components in urine samples had no significant effect on the performance of the proposed method.
CONCLUSION
factor and low detection limit. The proposed technique has several beneits as compared to conventional sample preparation methods such as simplicity of operation, low cost and consumption of very low volumes of toxic organic solvents. In addition, putting all the advantages together, DLLME possesses great potential for the analysis of different classes of drugs in urine samples.
REFERENCES
ALOTHMAN, Z.A.; DAWOD, M.; KIM, J.; CHUNG, D.S. Single-drop microextraction as a powerful pretreatment tool for capillary electrophoresis: a review. Anal. Chim. Acta., v.739, p.14-24, 2012.
BAKER, S.D.; BORYS, D.J. A possible trend suggesting increased abuse from Coricidin exposures reported to the Texas Poison Network: comparing 1998 to 1999. Vet. Hum. Toxicol., v.44, p.169-71, 2002.
BENJAMIN, R.C.; XIAOCHEN, G. Quantification of antihistamine acrivastine in plasma by solid-phase extraction and high-performance liquid chromatography. J. Pharm. Biomed. Anal., v.43, p.293-297, 2007.
CAPELLA -PEIRÓ, M.E.; BOSSI, A.; ESTEVE -ROMERO, J. Optimization by factorial design of a capillary zone electrophoresis method for the simultaneous separation of antihistamines. Anal. Biochem., v.352, p.41-49, 2006.
DANESHFAR, A.; KHEZELI, T.; LOTFI, H.J. Determination of cholesterol in food samples using dispersive liquid–liquid microextraction followed by HPLC–UV. J. Chromatogr. B, v.877, p.456-460, 2009.
EBRAHIMZADEH, H.; SHEKARI, N.; SAHARKHIZ, Z.; ASGHARINEZHAD, A.A. Simultaneous determination of chloropheniramine maleate and dextromethorphan hydrobromide in plasma sample by hollow fiber liquid phase microextraction and high performance liquid chromatography with the aid of chemometrics. Talanta, v.94, p.77-83, 2012.
EZODDIN, M.; SHEMIRANI, F.; JAMALI, M.R. Fiber optic-linear array detection spectrophotometry in combination with dispersive liquid-liquid microextraction for preconcentration and determination of copper. J. Anal. Chem., v.65, p.153-158, 2010.
FRIED, K.M.; YOUNG , A.E.; YASUDA, S.U.; WAINER, I.W. The enantioselective determination of chlorpheniramine and its major metabolites in human plasma using chiral
chromatography on a β-cyclodextrin chiral stationary phase
and mass spectrometric detection. J. Pharm. Biomed. Anal., v.27, p.479-485, 2002.
GAO, W.; CHEN, Y.; CHEN, G; Xi, J.; CHEN, Y.; YANG, J.; Xu, N. Trace analysis of three antihistamines in human urine by on-line single drop liquid–liquid–liquid microextraction coupled to sweeping micellar electrokinetic chromatography and its application to pharmacokinetic study. J. Chromatogr. B Analyt. Technol. Biomed. Life Sci., v.904, p.121-127, 2012.
HASEGAWA, C.; KUMAZAWA, T.; LEE, X.P.; FUJISHIRO, M.; KURIKI, A.; MARUMO, A.; SENO, H.; SATO, K. Simultaneous determination of ten antihistamine drugs in human plasma using pipette tip solid-phase extraction and gas chromatography/mass spectrometry. Rapid. Commun. Mass. Spectrom., v.20, p.537-543, 2006.
HIEP, B.T.; KHANH, V.; HUNG, N.K.; THUILLIER, A.; GIMENEZ, F. Determination of the enantiomers of chlorpheniramine and its main monodesmethyl metabolite in urine using achiral-chiral liquid chromatography. J. Chromatogr. B: Biomed. Sci. Appl., v.707, p.235-240, 1998.
JEANNOT, M.A.; CANTWELL, F.F. Solvent microextraction into a single drop. Anal. Chem., v.68, p.2236-2240, 1996.
KAMAREI, F.; EBRAHIMZADEH, H.; YAMINI, Y. Optimization of solvent bar microextraction combined with gas chromatography for the analysis of aliphatic amines in water samples. J. Hazard. Mater., v.178, p.747-752, 2010.
KARAMI-OSBOO, R.; MAHAM, M.; MIRI, R.; SHOJAEE ALIABADI, M.H.; MIRABOLFATHY, M.; JAVIDNIA, K. Evaluation of dispersive liquid–liquid microextraction– HPLC–UV for determination of deoxynivalenol (DON) in
wheat lour. Food Anal. Methods, v.6, p.176-180, 2013.
KAZEMI, E.; SHOKOUFI, N.; SHEMIRANI, F. Indium
determination and preconcentration using iber optic linear
LEE, J.; LEE, H.K.; RASMUSEN, K.E.; PEDERSEN-BJERGARD, S. Environmental and bioanalytical applications of hollow fiber membrane liquid-phase microextraction: a review. Anal. Chim. Acta, v.624, p.253-268, 2008.
LIN, C.Y.; FUH, M.R.; HUANG, S.D. Application of liquid– liquid–liquid microextraction and high-performance liquid chromatography for the determination of alkylphenols and bisphenol-A in water. J. Sep. Sci., v.34, p.428-435, 2011.
MAHAM, M.; KARAMI-OSBOO, R.; KIAROSTAMI, V.; WAQIF-HUSAIN, S. Novel binary solvents-dispersive liquid-liquid microextraction (BS-DLLME) method for determination of patulin in apple juice using high-performance liquid chromatography. Food Anal. Methods, v.6, p.761-766, 2013a.
MAHAM, M.; KIAROSTAMI, V.; WAQIF-HUSAIN, S.; ABROOMAND-AZAR, P.; SABER-TEHRANI, M.; KHOEINI-SHARIFABADI, M.; AFROOZI, H.; SHAPOURI, M.R.; KARAMI-OSBOO, R. Extraction and determination of cyproheptadine in human urine by DLLME-HPLC method. Iran. J. Pharm. Res., v.12, p.311-318, 2013b.
MAHAM, M.; KIAROSTAMI, V.; WAQIF-HUSAIN, S.; KARAMI-OSBOO, R.; MIRABOLFATHY, M. Analysis of ochratoxin A in malt beverage samples using dispersive liquid-liquid microextraction coupled with liquid
chromatography-luorescence detection. Czech J. Food Sci.,
v.31, p.520-525, 2013c.
REZAEE, M.; ASSADI, Y.; MILANI HOSSEINI, M.R.; AGHAEE, E.; AHMADI, F.; BERIJANI, S. Determination of organic compounds in water using dispersive liquid– liquid microextraction. J. Chromatogr. A, v.1116, p.1-9, 2006.
ZHU, Y.R.; JIA, Y.Y.; JIANG, L.; WANG, C.; DING, L.K.; YANG, J.; LI, L.; ZHAO, P.X.; LIU, W.X.; DING, Y.; WANG, L.; WEN, A.D. Determination of azatadine in human plasma by liquid chromatography/tandem mass spectrometry. J. Chromatogr. B Analyt. Technol. Biomed. Life Sci., v.879, p.2189-2193, 2011.