Permafrost and active layer monitoring in the
maritime Antarctic: Preliminary
results from CALM sites on Livingston and Deception Islands
M. Ramos,
1G. Vieira,
2S. Gruber,
3J. J. Blanco,
1C. Hauck,
4M. A. Hidalgo,
1D. Tomé,
1M. Neves,
2and
A. Trindade
21Department of Physics, University of Alcala, Spain.
2Centre for Geographical Studies, University of Lisbon, Portugal.
3Glaciology and Geomorphodynamics Group, Department of Geography, University of Zurich, Switzerland. 4Institute for Meteorology and Climate Research, Forschungszentrum Karlsruhe/University of Karlsruhe, Germany.
Abstract This paper describes results obtained from scientific work and experiments performed on Livingston and
Deception Islands. Located in the South Shetland Archipelago, these islands have been some of the most sensitive regions over the last 50 years with respect to climate change with a Mean Annual Air Temperature (MAAT) close to -2 ºC. Three Circumpolar Active Layer Monitoring (CALM) sites were installed to record the thermal regime and the behaviour of the active layer in different places with similar climate, but with different soil composition, porosity, and water content. The study’s ultimate aim is to document the influence of climate change on permafrost degradation. Preliminary results, obtained in 2006, on maximum active-layer thickness (around 40 cm in the CALM of Deception Island), active layer temperature evolution, snow thickness, and air temperatures permit early characterization of energy exchange mechanisms between the ground and the atmosphere in the CALM-S sites.Citation: Ramos, M., G. Vieira, S. Gruber, J.J. Blanco, C. Hauck, M.A. Hidalgo, D. Tomé, M. Neves and A. Trindade (2007), Permafrost and Active
Layer Monitoring in the Maritime Antarctic: Preliminary Results from CALM sites on Livingston and Deception Islands, in Antarctica: A Keystone in a Changing World – Online Proceedings of the 10th ISAES X, edited by A.K. Cooper and C.R. Raymond et al., USGS Open-File Report 2007-1047,
Short Research Paper 070, 5 p.; doi:10.3133/of2007-1047.srp070
Introduction
Meteorological data collected over the past half century show that climate variability is not homogenous over the Antarctic continent. The climate of the Antarctic Peninsula (AP) has experienced a major warming trend over this period, with mean annual air temperature (MAAT) at the Faraday/Vernadsky station having
increased by 0.56 ºC/decade. The corresponding rate for winter is 1.09 ºC/decade. This situation is, however, in contrast to negative trends of MAAT in other continental areas (Turner et al., 2005). The MAAT rise at the Faraday station, +2.5 ºC in 50 years, is among the largest measured on Earth over the last 50 years (King, 1994).
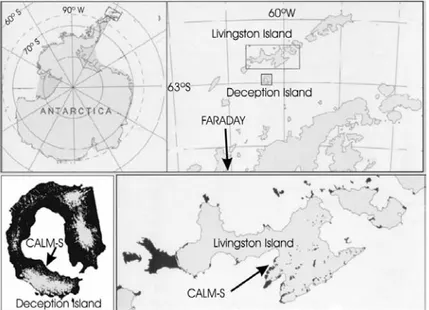
Figure 1. Location of the study area on Livingston and Deception Islands. While glaciers and ice-shelves in the region are being
monitored to evaluate the effects of climate change (Vaughan and Doake, 1996), permafrost, another important component of the Antarctic cryosphere
(Williams, 1989), has been neglected. There is a severe lack of data concerning the ground thermal regime in Antarctica although a few records exist for maritime Antarctica: in the eastern AP region, Orkay Islands
temperature records were collected by Chambers (1966), on Seymour Island (Corté, 1982; Fournier et al., 1978; Fukuda et al., 1991) and on James Ross Island (Hukuda, 1990) the permafrost distribution was studied. In South Shetland archipelago there are studies in King George Island (Zhu, C et al.., 1996; Kejna and Laska, 1999) on the relationship between periglacial forms and the active layer, as well as on Livingston and Deception Islands (Hall, 1997; Ramos and Vieira, 2003; Chambers, 1965; López-Martinez, 1996) and finally in continental Antarctica (Paetzold et al.; 2000, Bockheim and Hall, 2002; Guglielmin, 2006; Campbell and Claridge, 2006).
Permafrost is very sensitive to climate variability. In the study region in maritime Antarctica, where MAAT is close to –2 ºC with a low thermal amplitude (10 ºC monthly mean deviations) and summer mean air temperatures (December to March) above 0 ºC, permafrost thermal behaviour and distribution is influenced by the present climatic trends. Also this region is located in the approximate limit for the formation or maintenance of permafrost (Bockheim, 1995).
Changes in the soil thermal regime in response to climate variability directly affect the thickness of the active layer and permafrost temperature. Experimental control of the mechanical and thermal parameters that define the state of the active layer (maximum depth, temporal evolution of the thermal gradient, snow variability at the soil surface) is necessary to effectively study the impact of regional climate change on permafrost dynamics.
Two core Antarctic projects of the International Polar Year 2007-08 have been approved: Antarctic and Sub-Antarctic Permafrost, Soils and Periglacial Environments (ANTPAS - SCAR/IPA IPY-Project 33), and the Permafrost Observatory Project—A Contribution to the Thermal State of Permafrost (TSP – IPA IPY-Project 50). Among the objectives of these projects is the installation of a network of boreholes for permafrost temperature monitoring, a network of sites for monitoring active layer characteristics (CALM-S), and studies of the energy fluxes between the ground and the atmosphere. The PERMAMODEL project (Hauck et al., 2007), which involves monitoring and modelling permafrost and active-layer dynamics on Livingston and Deception Islands, is part of the ANTPAS and TSP projects and will contribute to the monitoring strategy by installing new boreholes and CALM-S sites on these islands.
This paper describes experimental designs established at the field research sites to record the thermal regime and the behaviour of the active layer in different places with similar climatology, but having different soil composition, porosity, and water content. The work was performed with special reference to the influence of climate change on permafrost degradation.
Study area
Livingston and Deception Islands are located in the subantarctic South Shetland Archipelago at 62º39'S;
60º21'W and 62º43'S, 60º57'W, respectively (Figure 1). The climate at sea level is cold oceanic, with frequent summer rainfall in low areas and a moderate annual temperature range. The climate reflects the strong influence of the circum-Antarctic low-pressure system. Meteorological conditions in summer are dominated by the continuous influence of polar frontal systems (Simonov, 1977; Styszynska, 2004). Relative humidity is very high, with average values ranging from 80 to 90%.
Data from different stations on King George Island (South Shetland Archipelago) show the mean annual air temperature to be approximately -1.6 ºC near sea level and the annual precipitation to be about 500 mm. Other air temperature data taken around Livingston and Deception Islands reflect a mean air temperature range (-3.2 ºC,-1.6 ºC) with average MAAT of -1.9 ºC. From April to November, average daily temperatures generally stay below 0 ºC and from December to March they are generally positive. The data describe two climate cycles corresponding to the annual cycle of soil freezing and thawing.
The recorded MAAT (2003 to 2006) at 275 m. asl on Reina Sofia Hill, is -4.2 ºC. This corresponds to a lapse rate of -0.8 ºC/100 m and to a freezing season about one month longer than at sea level. Permafrost in the South Shetland Islands is widespread above the Holocene raised-beaches (ca. 30 m asl) (Serrano and López-Martinez, 2000). Meteorological and geophysical data indicate, however, that environmental conditions in the islands are marginal for the maintenance of permafrost (Hauck et al., 2007). Moreover, in areas of volcanic activity (e.g. Deception Island), the geothermal heat flux is a strong determinant of the distribution of permafrost.
Data and methods
The Circumpolar Active Layer Monitoring (CALM) program is a network of permafrost observatories distributed over both Polar Regions and selected mid-latitude mountain ranges (Brown et al., 2000). CALM is an international global-change monitoring program concerned with active-layer dynamics and the shallow permafrost environment. CALM sites in the Southern Hemisphere are designated “CALM-S”.
Deception Island: On Deception Island, a CALM-S site was installed near Crater Lake at 112 m asl during the 2005-06 Antarctic campaign. The site is in flat terrain with volcanic debris and ash on the surface. Although very porous, the soil has high interstitial water content. Geophysical measurements indicate that permafrost is thin and varies between 15 m and 30 m thick; with maximum active-layer thickness (ALT) around 44 cm (see Figure 2). The study plot measures 100 m x 100 m (one hectare), and this area is subdivided into a grid of 10 m x 10 m cells. Its installation was completed in 2007, with air temperature and snow layer monitoring systems that complement the mechanical probing and ground temperature systems installed the previous year. During the 2005-06 campaign, two automatic temperature probes
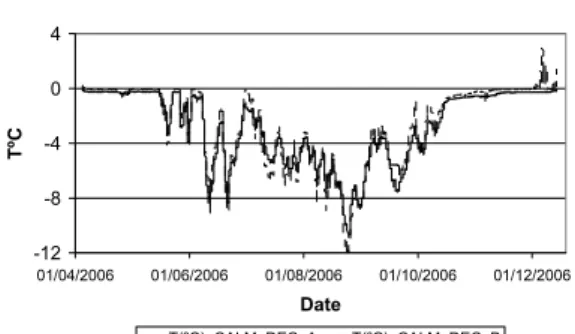
were placed about 15 cm, see location in Figure 2. Temperature variation during 2006 is illustrated in Figure 3.
Figure 2. Active layer depth measured (12 February 2006) by means of mechanical probing, grid at the CALM site on Deception Island, Crater Lake, 112 m asl. X on the graphic show soil temperature sensors at 15 cm deep.
Livingston Island: thermal profiles were measured in 2006 at the Incinerador and Sofia boreholes (Figure 4). The thermal gradient in the air interface layer was measured at the 5, 15, 25, 50 and 100 cm levels above the soil surface in three places: near the Incinerador and Sofia boreholes and at the Collado Ramos site. In Figures 5 and 6 we show the temperature differences between the sensors placed at 5 cm and 25 cm up to the soil with the upper most level at 100 cm (considered free of snow layer). Measurements were at hourly intervals throughout the year.
Two other CALM-S sites were installed during the 2007 campaign on Livingston Island: Reina Sofia Hill at 275 m asl (40 m x 40 m grid) and Collado Ramos at 150 m asl (50 m x 50 m grid). These sites are in the vicinity of the Reina Sofia (0.75 to 0.9 m active layer thickness with permafrost) and Incinerador (2.4 m of seasonal frost, with permafrost possible) boreholes, which were installed in 2000, providing a seven-year ground temperature series.
Two types of temperature sensors in our CALM-S sites have been installed: Tiny Talk (Gemini Co.,
http://www.geminidataloggers.com/) with a precision of
about 0.2 ºC, and iButtons (Maxim Co.,
http://www.maxim-ic.com/products/ibutton/),
micro-sensors with 0.4 ºC resolution, allowing them to be installed in small-diameter boreholes drilled during the 2007 campaign at the CALM-S sites. Finally, some snow layer probes have been installed which are based on the systematic register of the temporal evolution of the temperature at different levels above the soil surface. These experiments complement the mechanical and
thermal probing, allowing the snow layer’s influence on the thermal active layer evolution to be studied.
Preliminary results
Preliminary results on active layer temperature evolution, snow thickness, and air temperatures obtained in 2006 permit us preliminary characterization of energy-exchange mechanisms between ground and atmosphere at the CALM-S sites. At the Deception Island site, active-layer thickness, measured by mechanical probing at the end of the thawing season, is relatively homogeneous. The active layer in 2006 was between 29 cm and 44 cm thick, with average ALT of 36 cm (Figure 2). In contrast, probing data from 2007 show ALT between 22 cm and 38 cm, with a mean of 32 cm
CALM-S. Crater Lake. Decepcion
-12 -8 -4 0 4 01/04/2006 01/06/2006 01/08/2006 01/10/2006 01/12/2006 Date TºC T(ºC)_CALM_DEC_A T(ºC)_CALM_DEC_B
Figure 3. Thermal evolution at 15 cm depth during the 2006 freezing period, CALM-S Deception site.
Thermal parameters for this period are shown for the both temperature probes in Table 1. Freezing at both locations began almost simultaneously. The period in which the soil was affected by the zero-curtain effect (Outcalt et al., 1990) was similar at both locations and was appreciable owing to the high interstitial water content of the soil. The mean annual temperature into the soil (-15 cm) was -2.8 ºC and the freezing index varied between 668 ºC/day, for Probe Dec A and 719 ºC/day, for Probe Dec B.
Table 1. Freezing parameters registered by ground-temperature sensors at 15 cm depth at the CALM-S site on Deception Island, Crater Lake site, 112 m asl.
CALM-S Deception site
“Crater Lake” (112 m asl) Dec A Dec B
Freezing begins 06/04/2006 05/04/2006
Freezing ends 03/12/2006 14/12/2006
Freezing days 241 253
Zero curtain period in the
freezing process (days) 18 19
Zero curtain period in the
thawing process (days) 25 27
Mean temperature during
freezing (ºC) -2.8 -2.8
Minimum temperature
during freezing (ºC) -12.1 -10.9
Freezing Index Ic (ºCday) 668 719
0 20 40 60 80 100 0 10 20 30 40 50 60 70 80 90 100 20 cm 23 cm 26 cm 29 cm 32 cm 35 cm 38 cm 41 cm 44 cm CALM-S CRATER LAKE
12 February 2006
Table 2. Freezing parameters registered by a temperature sensor placed into the ground 15 cm deep at the CALM site on Livingston Island, Sofia Hill, 275 m asl.
CALM Sofia site “Reina Sofia Hill ” Sofia T(15)
Freezing begins 04/04/2006
Freezing ends 19/12/2006
Freezing days 259
Zero curtain period in the freezing process
(days) 2 Zero curtain period in the thawing process
(days) 21 Mean temperature during freezing (ºC) -3.5
Minimum temperature during freezing (ºC) -11.4
Freezing Index Ic (ºCday) 900
Comparison of data from the CALM-S site on Livingston Island to those from Deception Island (Tables 1 and 2), indicates similar thermal behaviour during the freezing period (Figures 3 and 4), although the zero-curtain effect lasted longer at Deception than at Livingston. This result indicates local differences in soil water content, but similar overall climatic regimes. Differences in mean temperature and the freezing index between the two sites at the 15 cm level may reflect differences in altitude. The number of freezing days is similar at the two sites. The duration of the zero-curtain effect in the thawing process is also similar at the two locations. This situation contrasts with that during the annual freezeback.
CALM-S SOFIA- 2006 Temperature 15 cm deep.
-12 -8 -4 0 4 24/03/2006 24/05/2006 24/07/2006 23/09/2006 23/11/2006 23/01/2007 Date Tº C T(15)
Figure 4. Thermal evolution during 2006 freezing period at 15 cm depth, Sofia CALM-S site, Livingston Island.
The installation of the thermal probes that register the air temperature at different levels of the air limit layer near the soil surface, allow the temporal evolution of the snow layer at the CALM-S sites to be controlled. The thermal snow layer probe compares simultaneous thermal signals taken at different positions up the soil surface. When the lower temperature sensors are covered by snow, they have more thermal inertia than the upper ones that are in direct contact with the air.
Thermal amplitude. Collado Ramos-2006.
-20 -15 -10 -5 0 5 10 14/12/2005 24/03/2006 02/07/2006 10/10/2006 18/01/2007 28/04/2007 Date ºC T(5)-T(100)
Figure 5. Hourly differences in thermal response at 5 cm and 100 cm above soil surface during 2006 at the Collado Ramos CALM-S site, Livingston Island.
When a quick change in air temperature is recorded, big differences appear between the instant thermal amplitude in the sensors covered by snow and the ones that are not covered. In Figures 5 and 6, the temporal evolution of the temperature differences can be seen between the sensors placed at 5 cm and 25 cm and the one at 100 cm above the soil surface (this latter sensor is believed not to be covered by snow at all times). When the temperature differences between the sensors (thermal amplitude) are considerable (more than 5 ºC), this is an indication that a layer of snow is covering the lower sensor. For example in Figure 5, it can be seen that the snow layer covered the 5 cm sensor approximately on 5/07/2006 and was continuously covered until 1/12/2006.
The 25 cm temperature sensor, however, was covered from 1/10/2006 to 10/11/2006. This information will be useful to study the importance of the snow layer on the energy balance exchange between the soil and the atmosphere in relation with the snowfall regime.
Thermal amplitude. Collado Ramos-2006
-20 -15 -10 -5 0 5 10 14/12/2005 24/03/2006 02/07/2006 10/10/2006 18/01/2007 28/04/2007 Date ºC T(25)-T(100)
Figure 6. Hourly differences in thermal response at 25 cm and 100 cm above soil surface during 2006 at the Collado Ramos CALM-S site, Livingston Island.
Summary
Instrumental climate records collected in the AP and surrounding islands from de mid 20th century, show that
this is a region of extreme climate variability that has undergone significant warming. Because the AP extends
far northward, the 0 ºC summer isotherm passes through the region. Small temperature raises will force this isotherm to the south. The effect of these changes on the active layer and thermal state of permafrost will be very interesting to study.
Livingston a Deception Islands for its privileged situation are good candidates to establish different CALM-S sites associates to the ANTPAS and TSP objectives and to participate in the CALM network of permafrost observatories.
The extreme sensibility of the permafrost in the maritime Antarctic to climate variability could be useful in understanding the key mechanisms of the energy exchange between the soil and the air boundary layer across its active layers.
Acknowledgements. We acknowledge the support from the MEC,
Office of Spanish Polar Programs through the grant: CGL2005-25112-E/ANT. We thank the field support of the staff of UTM and Spanish Army in the Spanish Antarctic stations Juan Carlos I and Gabriel de Castilla. We thank the reviewers in particular to Fritz Nelson for their comments on this manuscript.
References
Bockheim, J. (1995), Permafrost distribution in Southern circumpolar region and its relation to the environment: a review and recommendations for further research, Permafrost and Periglacial Processes, 6, 27-45.
Bockheim, J.G., and K.J. Hall (2002), Permafrost, active layer dynamics and periglacial environments of continental Antarctica, South Afr. J. Sci., 98, 82-90.
Brown, J., K.M. Hinkel, and F.E. Nelson (2000), The circumpolar active layer monitoring (calm) program: research designs and initial results, Polar Geography, 24 (3), 165-258.
Corté, A.E. (1982), Geomorfología criogénica de la Isla Seymour (Base Vicecomodoro Marambio)-Antártida Argentina, Revista de la Asociación Geológica Argentina, XXXVII(3), 331-347.
Campbell, I.B., and G.G.C. Claridge (2006), Permafrost properties, patterns and processes in the Transantarctic Mountains region of Antarctica, Permafrost and Periglacial Processes, 17, 215-232. Chambers, M.J.G. (1965), Inusual patterned ground on Deception
Island. South Shetland Islands, British Antarctic Survey Bulletin, 6, 15-19.
Chambers, M.J.G. (1966), Investigation on patterned ground at Signy Island, South Orkey Islands: Temperature regimes in active layer, British Antarctic Survey Bulletin, 9, 21-40.
Fournier, H.G., A.E. Corté, J.S. Gasco, and C.E. Moyano (1987), A very conductive layer below the permafrost of Seymour and Robertson islands in the eastern Antarctic Peninsula, Cold Regions Science and Technology, 14 (2), 155-161.
Fukuda, M., J. Strelin, K. Shimokawa, N. Takahashi, T. Sone, and D. Trombotto (1991), Permafrost occurrence in James Ross Island and Seymour Island, Antarctic Peninsula region, in Recent progress on
Antarctic Earth Sciences, edited by Yoshida, Y., et al., 6-160, Terra Scien. Publish., Tokio.
Guglielmin, M. (2006), Ground surface temperature (GST), active layer, and permafrost monitoring in continental Antarctica, Permafrost and Periglacial Processes, 17 (2), 133-143.
Hauck, C., G. Vieira, S. Gruber, J. Blanco, and M. Ramos (2007), Geophysical identification of permafrost in Livingston Island, maritime Antarctica, J. Geophys. Res., 112, F02S19, doi:10.1029/2006JF000544.
Hall, K. (1997), Rock temperatures and implications for cold region weathering: New data from Viking Valley, Alexander Island (Antarctica), Permafrost and Periglacial Processes, 8, 69-90.
Hukuda, M. (1990), Field investigations of permafrost in James Ross Island, Antarctic Peninsula area, Polar News, 26, 53-58.
King, J.C. (1994), Recent climate variability in the vicinity of Antarctic Peninsula, Int. J. Climatol., 14 (4), 357-369.
Kejna, M., and K. Laska (1999), Spatial differentiation of ground temperature in the region of Arctowski Station, King George Island, Antarctica in 1996, Polish Polar Research, 20 (3), 221-241.
López-Martinez, J., M. Ramos, C. Criado, E. Serrano, and P. Nicolás (1996), Anomalías geotérmicas y permafrost en la Isla Decepción, Antártida, in VI Simposio de Estudios Antárticos, edited by C.I.C.Y.T., 223-234, Madrid, Spain.
Outcalt, S.I., F. E. Nelson, and K. M. Hinkel (1990), The zero-curtain effect: heat and mass transfer across an isothermal region in freezing soil, Water Resources Research, 26 (7), 1509-1516.
Paetzold, R.F., M. Balks, J. Aislabie, J.M. Kimble, and I.B. Campbell (2000), Temperature and water content of some Antarctic soils, in Soil 2000: New Horizons for a New Century, edited by Adams, J.A., and Metherell, A.K., Australia and New Zealand Second Joint Soils Conference, 167-170, NZ Society of Soil Science, Christchurch, NZ. Ramos, M., and G. Vieira (2003), Active layer and permafrost
monitoring in Livingston Island, Antarctic. First results from 2000 to 2001, in Proceedings of the 8th International Conference on
Permafrost, edited by Phillips, M., Springman, S.M., and Arenson, L., 929-933, Balkema Publishers, Lisse, Zurich.
Serrano, E., and J. López-Martínez (2000), Rock glaciers in the South Shetland Islands, Western Antarctica, Geomorphology, 35, 145-162. Simonov, I.M. (1977), Physical geographic description of Fildes
Peninsula (South Shetland Islands), Polar Geography, 1, 223-242. Styszynska, A. (2004), The origin of coreless winters in the South
Shetlands area (Antarctica), Polish Polar Research, 25, 45-66. Turner, J., S. R. Colwell, G. J. Marshall, T. A. Lachlan-cope, A. M.
Carleton, P. D. Jones, V. L. Phil, A. Reid, and S. Iagovkina (2005), Antarctic climate change during the last 50 years, Int. J. Climatol., 25, 279-294.
Vaughan, D.G., and C.S.M. Doake (1996), Recent atmospheric warming and retreat of ice shelves on Antarctic Peninsula, Nature, 379 (6563), 328-331.
Williams, P.J. and M.W. Smith (1989), The Frozen Earth, Cambridge University Press, Cambridge, U.K.
Zhu, C., Z. Cui, and J. Zhang (1996), Relationship between the distribution of periglacial landforms and glaciation history, Fildes Peninsula, King George Island, Antarctica, Permafrost and Periglacial Processes, 7 (1), 95-100.