TCD
5, 2465–2481, 2011Thermal state of the active layer and
permafrost
Q. Wu et al.
Title Page Abstract Introduction Conclusions References
Tables Figures
◭ ◮
◭ ◮
Back Close
Full Screen / Esc
Printer-friendly Version Interactive Discussion
Discussion
P
a
per
|
Dis
cussion
P
a
per
|
Discussion
P
a
per
|
Discussio
n
P
a
per
|
The Cryosphere Discuss., 5, 2465–2481, 2011 www.the-cryosphere-discuss.net/5/2465/2011/ doi:10.5194/tcd-5-2465-2011
© Author(s) 2011. CC Attribution 3.0 License.
The Cryosphere Discussions
This discussion paper is/has been under review for the journal The Cryosphere (TC). Please refer to the corresponding final paper in TC if available.
Thermal state of the active layer and
permafrost along the Qinghai-Xizang
(Tibet) railway from 2006 to 2010
Q. Wu1, T. Zhang2,3, and Y. Liu1
1
State Key Laboratory of Frozen Soil Engineering, Cold and Arid Regions Environmental and Engineering Research Institute, Lanzhou, 730000, China
2
DOE Key Laboratory of West China’s Environment System, Lanzhou University, Lanzhou, 730000, China
3
National Snow and Ice Data Center, Cooperative Institute for Research in Environmental Sciences, University of Colorado, Boulder, Colorado, USA
Received: 31 May 2011 – Accepted: 25 August 2011 – Published: 22 September 2011 Correspondence to: T. Zhang (tzhang@nsidc.org)
TCD
5, 2465–2481, 2011Thermal state of the active layer and
permafrost
Q. Wu et al.
Title Page Abstract Introduction Conclusions References
Tables Figures
◭ ◮
◭ ◮
Back Close
Full Screen / Esc
Printer-friendly Version Interactive Discussion
Discussion
P
a
per
|
Dis
cussion
P
a
per
|
Discussion
P
a
per
|
Discussio
n
P
a
per
|
Abstract
In this study, we investigated changes in active layer thickness (ALT) and permafrost temperatures at different depths using data from permafrost monitoring network along the Qinghai-Xizang (Tibet) Railway since 2005. Among sites, average ALT is about 3.1 m with a range from about 1.1 m to 4.9 m. From 2006 through 2010, ALT has 5
increased at a rate of about 6.3 cm a−1. The mean rising rate of permafrost tem-perature at the depth of 6.0 m is about 0.02◦C a−1 estimated by linear regression using five years of data, and the mean rising rate of mean annual ground temper-ature (MAGT) at depth of zero amplitude is about 0.012◦C a−1. Changes for colder permafrost (MAGT<−1.0◦C) is greater than that for relatively warmer permafrost 10
(MAGT>−1.0◦C). This is consistent with results observed in the Arctic and Subarctic.
1 Introduction
Qinghai-Xizang (Tibet) Plateau, with an average elevation of more than 4000 m a.s.l., is the highest and the most extensive plateau in the world (Liu and Chen, 2000), known as “roof of the world”. Permafrost areas are estimated at about 1.3×10⁶km2 (Nan, 15
2005), approximately 70.6 % of the land area over the Qinghai-Xizang (Tibet) Plateau (Zhou et al., 2000). Although permafrost area in Qinghai-Xizang (Tibet) Plateau (QXP) is only about 5.7 % of the 22.79×10⁶km2 permafrost areas in the Northern Hemi-sphere (Zhang et al., 1999), it is estimated that China contains the biggest part of mountain permafrost area in the northern hemisphere (Zhang et al., 2003). So, it is 20
very important to understand the thermal state of active layer and permafrost in QXP for permafrost change in Northern Hemisphere.
Zhao et al. (2010) synthetically analyze the thermal state of the active layer and permafrost in Central Asia, including QXP, as part of the International Permafrost As-sociation’s (IPA) International Polar Year (IPY) project. This study is an additional con-25
TCD
5, 2465–2481, 2011Thermal state of the active layer and
permafrost
Q. Wu et al.
Title Page Abstract Introduction Conclusions References
Tables Figures
◭ ◮
◭ ◮
Back Close
Full Screen / Esc
Printer-friendly Version Interactive Discussion
Discussion
P
a
per
|
Dis
cussion
P
a
per
|
Discussion
P
a
per
|
Discussio
n
P
a
per
|
and active layer thickness in QXP. In our previous studies, we investigated changes of soil temperature within the active layer, permafrost temperature at 6.0 m depth from 1996 to 2006 (Wu and Zhang, 2008) and active layer thickness from 1995–2007 (Wu and Zhang, 2010) along the Qinghai-Xizang (Tibet) Highway. Due to the construction of the Qinghai-Xizang (Tibet) Railway, most of these sites were terminated. Most of all, 5
these sites are relatively shallow, usually about 6 to 8 m in depth. A new permafrost monitoring network was established in 2005 along the Qinghai-Xizang (Tibet) Railway with 28 sites and borehole depth is greater than 15 m. Therefore, in this study, we analyze variation of active layer thickness, soil temperature near the permafrost table, permafrost temperatures at 6.0 m depth and mean annual ground temperature during 10
the period of 2006–2010 using data from these new sites. This study can be referred as complementary to understand the thermal state of permafrost and active layer on Qinghai-Xizang (Tibet) Plateau during the International Polar Years.
2 Data and method
The data used in this study include soil temperatures along the Qinghai-Xizang High-15
way established in 1995/1998 and along the Qinghai-Xizang Railway established in 2005. Due to the main objective of monitoring engineering stability and permafrost change beneath embankment with asphalt pavement (Wu et al., 2010), borehole depths range from 6 to 8 m. Research results of these data and information of per-mafrost monitoring have been reported (Wu and Liu, 2004; Wu and Zhang, 2008; 20
and Wu and Zhang, 2010). During the construction of Qinghai-Xizang (Tibet) Railway from 2005, 43 monitoring sites and three whether stations were established to detect changes in the thermal state of permafrost beneath embankment and embankment stability (Wu et al., 2008). Although the main objective of these 43 sites is to mon-itor thermal state of permafrost under the railway embankment, sites away from the 25
TCD
5, 2465–2481, 2011Thermal state of the active layer and
permafrost
Q. Wu et al.
Title Page Abstract Introduction Conclusions References
Tables Figures
◭ ◮
◭ ◮
Back Close
Full Screen / Esc
Printer-friendly Version Interactive Discussion
Discussion
P
a
per
|
Dis
cussion
P
a
per
|
Discussion
P
a
per
|
Discussio
n
P
a
per
|
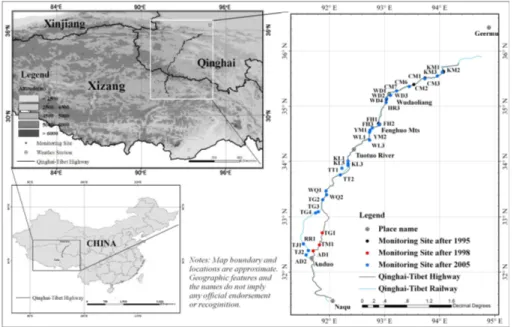
change on permafrost (Wu et al., 2008). There are 28 sites of monitoring permafrost change under natural surface along the Qinghai-Tibet Railway (Fig. 1) (Wu et al., 2008). In this study, soil temperature data from these 28 sites under natural surface are used to analyze the change in active layer thickness and the thermal state of permafrost from 2005 to 2010. In this article, we mainly descript these 28 sites along the Qinghai-5
Xizang Railway.
2.1 Site description
These 28 monitoring sites along the 542 km of the QTR, from Xidatan to Anduo, span about 3.4 latitudinal degrees and about 2.6 longitudinal degrees on the eastern Qinghai-Xizang Plateau (Fig. 1). The elevation of these sites vary from 4500 m a.s.l. 10
at Chumaer River high-plain sites to 4970 m a.s.l. at the Tanggula Mountain site, with an average elevation of about 4710 m a.s.l. These observed sites are distributed in various terrains, including high altitude mountains, high plains, and basins from north to south of the plateau. In the high altitude mountains along the QTR, that is, the Kun-lun Mountains, Kekexili Mountains, Fenghuo Mountains, and Tanggula Mountains, the 15
MAGTs are lower than−1.0◦C or−2.0◦C, the active layer thickness ranges from 1.2 m to 2.0 m, the permafrost thickness is larger than 60 m (Wu et al., 2010) and ice-rich permafrost exists from the permafrost table to 10 m deep below the ground surface. In the high plain along the QTR, that is, the high plain of the Chumaer River, the MAGTs range from−0.5◦C to −1.5◦C, the active layer thickness ranges from 2.0 m to 3.0 m, 20
the permafrost thickness is lower than 50 m (Wu et al., 2010), and ice-rich permafrost is widespread from the permafrost table to 10 m deep below the ground surface. In the basins along the QTR, that is, the Beilu River, Yamer River, Wuli, Tuotuo River, Kaixin-ling, Zajiazangbu River and Anduo, the MAGTs are higher than−0.5◦C, exceptionally lower than−0.5◦C, most of the active layer thickness is larger than 3 m, but some is 25
TCD
5, 2465–2481, 2011Thermal state of the active layer and
permafrost
Q. Wu et al.
Title Page Abstract Introduction Conclusions References
Tables Figures
◭ ◮
◭ ◮
Back Close
Full Screen / Esc
Printer-friendly Version Interactive Discussion
Discussion
P
a
per
|
Dis
cussion
P
a
per
|
Discussion
P
a
per
|
Discussio
n
P
a
per
|
2.2 Soil temperature measurements
Soil temperature was measured at depth 0 to 20 m for all sites. All measurements were made by a string of thermistors with an increment of 0.5 m with depth. These thermis-tors were made by the State Key Laboratory of Frozen Soil Engineering (SKLFSE) and temperature sensitivity of these thermistor sensors in the Laboratory is±0.05◦C. 5
The measurements in-situ was automatically collected by a data-log, CR3000, made by Campbell Co., USA at 10:10 a.m. Beijing Standard Time in each day. A string of thermistors is widespread used to monitor soil temperature (Cheng, 1980). There are about 20 yr for the application in the SKLFSE and all soil temperature monitoring in permafrost regions used a string of thermistors at present, including literatures dealing 10
with permafrost temperature monitoring along Qinghai-Xizang Railway (Sheng et al., 2002; Zhao et al., 2004; Cheng Guodong, 2005; Cheng et al., 2007; Zhang et al., 2008; Wu and Zhang, 2008; Zhao et al., 2010).
2.3 Method
In this study, we analyze the temporal trend of ALT and permafrost temperature from 15
2006 to 2010. Because of soil temperature monitoring had been beginning since June 2005, ALT was estimated from 2005 to 2010. The changing rate of ALT was es-timated using linear regression using six years of ALT data for each site withP <0.05. Annual mean temperature data near permafrost table was estimated using daily tem-perature data at the monitoring depth approaching to the depth of multi-year average 20
TCD
5, 2465–2481, 2011Thermal state of the active layer and
permafrost
Q. Wu et al.
Title Page Abstract Introduction Conclusions References
Tables Figures
◭ ◮
◭ ◮
Back Close
Full Screen / Esc
Printer-friendly Version Interactive Discussion
Discussion
P
a
per
|
Dis
cussion
P
a
per
|
Discussion
P
a
per
|
Discussio
n
P
a
per
|
3 Variation of active layer thickness
ALT on Qinghai-Xizang (Tibet) Plateau has a sensitive response to climate change (Jin et al., 2000; Zhao et al., 2000; Cheng and Wu, 2007; Zhao et al., 2008) and its change was consistent with changes in air temperature (Zhao et al., 2004; Zhao et al., 2008; Wu and Zhang, 2010). Based on daily soil temperatures from the 28 sites, all sites 5
average ALT from 2005 to 2009 along the Qinghai-Tibet Railway is 3.10 m; average ALT varied from less than 1.1 m at the CM3 site to greater than 4.9 m at TG2 site (Table 2). ALT from 2006 to 2010 along Qinghai-Tibet Railway has experienced a significant inter-annual variation. ALT increase from 2006 to 2010 along the Qinghai-Xizang Railway, but ALT at the sites of CM6, WQ1 and TG4 decrease from 2006 to 2010 (Table 2). 10
Except for the decreasing of ALT at sites of CM6, WQ1 and TG4, the change of ALT increasing rate ranges from 1.2 cm a−1at the site of CM5 to 26.1 cm a−1at the site of WL3, with an average rate of 6.3 cm a−1 (Table 2). Continuously monitoring data of
soil temperatures at the sites respectively established in 1995 and 1998 indicated that ALT experience a significant inter-annual variation from 1995 to 2010 (Fig. 2a), and the 15
change of ALT increasing rate ranges from 2.2 cm a−1to 16.12 cm a−1, with an average
rate of 7.8 cm a−1(Fig. 2b), which is basically consistent with change rate of ALT in 28 sites along the Qinghai-Xizang (Tibet) Railway.
4 Variation of permafrost temperatures
For permafrost temperature at the 6.0 m depth, the variation trend of six sites is un-20
obvious (Table 3) with P >0.05. Variation of permafrost temperature at the 6.0 m depth shows an increasing trend, ranging from about 0.001◦C a−1 at site of TG3 to
0.08◦C a−1 at FH2 with an average of about 0.02◦C a−1 (Table 3). Over mountain ar-eas, variation of permafrost temperature at 6 m depth shows a complicated process. Permafrost temperature at 6 m depth shows a decreasing trend, with a decreasing 25
TCD
5, 2465–2481, 2011Thermal state of the active layer and
permafrost
Q. Wu et al.
Title Page Abstract Introduction Conclusions References
Tables Figures
◭ ◮
◭ ◮
Back Close
Full Screen / Esc
Printer-friendly Version Interactive Discussion
Discussion
P
a
per
|
Dis
cussion
P
a
per
|
Discussion
P
a
per
|
Discussio
n
P
a
per
|
increasing trend, with an increasing rate of 0.08◦C a−1 at FH2. The variation trend of permafrost temperature at 6 m depth at WD3 and WD4 is unobvious (Table 3). In high plain and basin, permafrost temperature at 6.0 m depth shows an increasing trend ex-cept for at site of CM6 and RR1, ranging from less than 0.001◦C a−1at TG3 to greater than 0.049◦C a−1at WL1, with an average of 0.016◦C a−1.
5
Continuously monitoring data of soil temperatures at the sites respectively estab-lished in 1995 and 1998 indicated that permafrost temperature at 6.0 m depth expe-rience a significant inter-annual variation from 1995 to 2010 (Fig. 3a), and rising rate of permafrost temperature ranges from 0.008◦C a−1at the site of TG1 to 0.055◦C a−1
at the site of FH1, with an average rate of 0.029◦C a−1 (Fig. 3b), which is basically 10
consistent with change rate of permafrost temperature at 6.0 m depth in 29 sites along the Qinghai-Xizang (Tibet) Railway.
MAGT shows an increasing trend, ranging from less than 0.001◦C a−1 at the site of AD2 to greater than 0.06◦C a−1 at the site of FH2, with an average of 0.012◦C a−1 (Table 4). However, increasing rate of MAGT in mountain areas is much higher than 15
in high plain and basins. The rate of MAGT change in mountain regions ranged from 0.003◦C a−1 at the site of WD3 to 0.06◦C a−1 at the site of FH2, with an average of 0.026◦C a−1(Table 4). Over high plains and basins, the rate of MAGT change ranged
from 0.001◦C a−1at the site of AD1 to 0.029◦C a−1at the site of YM2, with an average of 0.008◦C a−1(Table 4).
20
5 Discussions and summary
This study examined variation of ALT, temperature near the permafrost table, per-mafrost temperature at 6.0 m depth and mean annual ground temperature along the Qinghai-Tibet Railway using daily soil and permafrost temperature measurements from 2006 to 2010. Our results show that ALT and permafrost temperatures have extensive 25
TCD
5, 2465–2481, 2011Thermal state of the active layer and
permafrost
Q. Wu et al.
Title Page Abstract Introduction Conclusions References
Tables Figures
◭ ◮
◭ ◮
Back Close
Full Screen / Esc
Printer-friendly Version Interactive Discussion
Discussion
P
a
per
|
Dis
cussion
P
a
per
|
Discussion
P
a
per
|
Discussio
n
P
a
per
|
Based on data from these 28 sites over 6 yr along the Qinghai-Tibet Railway, average ALT is about 3.1 m with a range of 1.06 m to 4.99 m. Except for the decreasing of ALT at sites of CM6, WQ1 and TG4, the mean increasing rate of ALT is about 6.3 cm a−1 with a range from 1.2 to 26.1 cm a−1. The average temperature near permafrost table is about−0.62◦C with a range of 0.0 to−2.7◦C. The average permafrost temperature at 5
6.0 m depth is about−0.76◦C with a range from−0.08 to−2.84◦C. Except for lowering of permafrost temperature at the depth of 6.0 m at sites of KM1 and CM6, the mean rising rate of permafrost temperature at the depth of 6.0 m is about 0.02◦C a−1 with a range from 0.001 to 0.08◦C a−1. The average MAGT is about−0.82◦C with a range of −0.06 to−3.04◦C. The mean rising rate of MAGT is about 0.012◦C a−1with a range of 10
0.001 to 0.06◦C a−1
. The variation of cold permafrost thermal state with MAGT lower than−1.0◦C is larger than that of warm permafrost thermal state with MAGT higher than−1.0◦C.
Surprisingly, the change of ALT at the site of WL3 is up to 26.1 cm a−1
, its change was due to add a sand protection facilities, rock pane sandfence in natural surface. This 15
rock pane sandfence raised surface temperature to lead the increase of thaw depth. The decreasing of ALT at the site of CM6, WQ1 and TG4 may depend on local effect, but we cannot explain which factors control the decreasing of ALT.
It is widely hypothesized that ALT and permafrost temperature will increase in re-sponse to climate warming. It may be complex for the rere-sponse of ALT and permafrost 20
temperature to climate change; however, the seasonality of air temperature change is possibly predominant for ALT and permafrost temperature variation over the Qinghai-Tibet Plateau (Wu and Zhang, 2010). ALT variation is disaccord with variation of tem-perature near permafrost table, and variation fluctuation of permafrost temtem-perature at the different depth is disaccord. These differences may indicate that local factors may 25
control on ALT and permafrost temperature variation in local scale.
TCD
5, 2465–2481, 2011Thermal state of the active layer and
permafrost
Q. Wu et al.
Title Page Abstract Introduction Conclusions References
Tables Figures
◭ ◮
◭ ◮
Back Close
Full Screen / Esc
Printer-friendly Version Interactive Discussion
Discussion
P
a
per
|
Dis
cussion
P
a
per
|
Discussion
P
a
per
|
Discussio
n
P
a
per
|
and active layer thickness in local scale, making spatial and temporal change disaccord under the effect of climate change. Spatial and temporal change of permafrost will result from a different feedback of permafrost change to climate change. Therefore, we should study the feature and mechanics of permafrost change under the effect of local factors and the relationships between permafrost and climate change.
5
Acknowledgements. This work was supported by the Global Change Research Program of China (Grant No. 2010CB951402) and the Program for Innovative Research Group of Natural Science Foundation of China (Grant No. 40821001).
References
Cheng, G.: Application of thermistor in measuring permafrost temperature, Journal of
Glaciol-10
ogy and Geocryology, 2, 66–68, 1980 (in Chinese).
Cheng, G. and Wu, T.: Responses of permafrost to climate change and their environ-mental significance, Qinghai-Xizang (Tibet) Plateau, J. Geophys. Res., 112, F02S03, doi:10.1029/2006JF000631, 2007.
Cheng, G. D.: A roadbed cooling approach for the construction of Qinghai-Tibet Railway, Cold
15
Reg. Sci. Technol., 42, 169–176, 2005.
Cheng, G. D., Lai, Y., Sun, Z., and Jiang, F.: The “thermal semiconductor” effect of crushed rocks, Permafrost Periglac., 18, 151–160, 2007.
Jin, H. J., Li, S. X., Cheng, G. D., Wang, S. L., and Li, X.: Permafrost and climate change in China, Global Planet. Change, 26, 387–404, 2000.
20
Liu, X. D. and Chen, B. D.: Warming in the Tibetan Plateau during recent decades, Int. J. Climatol., 20, 1729–1742, 2000.
Nan, Z. T., Li, S. X., and Cheng, G. D.: Prediction of permafrost distribution on Qinghai-Tibet Plateau in the next 50 and 100 yr, Sci. China Ser. D, 48, 797–804, 2005.
Sheng Yu, Zhang Jianming, and Liu Yongzhi: Thermal regime in the embankment of
Qinghai-25
Tibetan highway in permafrost regions, Cold Reg. Sci. Technol., 35, 35–44, 2002.
Wang, S. L., Jin, H. J., Li, S. X., and Zhao, L.: Permafrost degradation on the Qinghai-Xizang (Tibet) Plateau and its environmental impacts, Permafrost Periglac., 11, 43–53, 2000. Wu, Q. B. and Liu, Y. Z.: Ground temperature monitoring and its recent change in Qinghai –
Tibet Plateau, Cold Reg. Sci. Technol., 38, 85–92, 2004.
TCD
5, 2465–2481, 2011Thermal state of the active layer and
permafrost
Q. Wu et al.
Title Page Abstract Introduction Conclusions References
Tables Figures
◭ ◮
◭ ◮
Back Close
Full Screen / Esc
Printer-friendly Version Interactive Discussion
Discussion
P
a
per
|
Dis
cussion
P
a
per
|
Discussion
P
a
per
|
Discussio
n
P
a
per
|
Wu, Q. and Zhang, T.: Recent Permafrost Warming on the Qinghai-Tibetan Plateau, J. Geo-phys. Res., 113, D13108, doi:10.1029/2007JD009539, 2008.
Wu, Q. and Zhang, T.: Changes in Active Layer Thickness over the Qinghai-Tibetan Plateau from 1995–2007, J. Geophys. Res., 115, D09107, doi:10.1029/2009JD012974, 2010. Wu Qingbai, Liu Yongzhi, and Yu Hui.: Monitoring Network of the Permafrost Conditions and
5
Embankment Performance along the Qinghai-Tibet Railway, Proceedings of 9th International Conference on Permafrost, 1963–1968, 2008.
Wu Qingbai, Zhang Zhongqiong, and Liu Yongzhi: Long-term thermal effect of asphalt pave-ment on permafrost under embankpave-ment, Cold Reg. Sci. Technol., 60, 221–229, 2010. Zhang, T., Barry, R. G., Knowles, K., Heginbottom, J. A., and Brown, J.: Statistics and
charac-10
teristics of permafrost and ground-ice distribution in the Northern Hemisphere, Polar Geogr., 23, 132–154, 1999.
Zhang, T., Barry, R., Knowles, K., Ling, F., and Armstrong, R.: Distribution of seasonally and perennially frozen ground in the Northern Hemisphere, in Proceedings: The 8th International Conference on Permafrost, 21–25 July, 2003, Zurich, Switzerland, Vol. 2, edited by: Phillips,
15
M., Springman, S. M., and Arenson, L. U., A. A. Balkema, Brookfield, Vt., 1289–1294, 2003. Zhang, T., Baker H. W., Guo-Dong Cheng, and Qingbai Wu: The Qinghai-Tibet Railroad: A
milestone project and its environmental impact, Cold Reg. Sci. Technol., 53, 229–240, 2008. Zhao, L., Cheng, G., and Li, S.: Thawing and freezing processes of active layer in Wudaoliang
region of Tibetan Plateau, Chinese Sci. Bull., 45, 2181–2186, 2000.
20
Zhao Lin, Ping, C., Yang, D., Cheng, G., Ding, Y., and Liu, S.: Changes of climate and sea-sonally frozen ground over the past 30 yr in Qinghai-Xizan (Tibetan) Plateau, China, Global Planet. Change, 43, 19–31, 2004.
Zhao, L., Tonghua Wu, Yongjian, D., and Changwei, X.: Monitoring permafrost changes on the Qinghai-Tibet Plateau, in: Extended Abstracts, Proceedings Ninth International
Confer-25
ence on Permafrost, Vol. 2, edited by: Kane, D. L. and Hinkel, K. M., Institute of Northern Engineering, University of Alaska, Fairbanks, 2071–2076, 2008.
Zhao Lin, Wu Qingbai, Marchenko, S. S., and Sharkhuu, N.: Thermal state of Permafrost and active layer in Central Asia during the International Polar Year, Permafrost Periglac., 21, 198–207, 2010.
30
TCD
5, 2465–2481, 2011Thermal state of the active layer and
permafrost
Q. Wu et al.
Title Page Abstract Introduction Conclusions References
Tables Figures
◭ ◮
◭ ◮
Back Close
Full Screen / Esc
Printer-friendly Version Interactive Discussion
Discussion
P
a
per
|
Dis
cussion
P
a
per
|
Discussion
P
a
per
|
Discussio
n
P
a
per
|
Table 1.The geographical data and information of 29 sites along the Qinghai-Xizang Railway.
Areas Sites Location Altitude Soil Types Vegetation ALT MAGT name Longitude◦ Latitude◦ [m] Cover [%] [m] [◦C]
Kunlun Mts. KM2 94.05 35.62 4757 clay 10 to 15 1.83 −3.04 Budongquan BD1 93.96 35.55 4636 sandy clay 10 to 20 2.47 −0.60 Chumaer River CM3 93.73 35.50 4547
sandy clay 20 to 30
1.06 −1.20 High Plain CM5 93.45 35.36 4507 2.84 −1.20 CM6 93.45 35.36 4504 3.06 −0.95 CM7 93.22 35.28 4589 4.80 −0.41 Kekexili Mts. WD3 93.11 35.2 4613
clay 60 to 80 1.93 −1.53 WD4 93.04 35.14 4734 0.92 −2.56 Hongliang River Basin HR3 93.03 35.07 4675 clay 20 to 30 2.36 −1.11 Fenghuo Mt.s FH2 92.9 34.67 4894
clay 70 to 80 1.76 −2.02 FH3 92.78 34.61 4715 4.01 −0.65 Yamaer River Basin YM1 92.74 34.57 4654
sandy clay 20 to 30 3.32 −0.39 YM2 92.73 34.53 4616 5.86 −0.25 Wuli Basin WL1 92.73 34.39 4587
sandy clay 20 to 30 3.09 −0.63 WL3 92.73 34.39 4587 5.45 −0.50 Kaixinling Basin KL1 92.34 34.01 4672
clay 40 to 50
2.40 −0.69 KL3 92.34 33.96 4622 2.83 −0.72 KL5 92.34 33.93 4622 3.38 −0.60 Tuotuo River Basin TT1 92.23 33.88 4640 sandy clay 30 to 40 2.60 −0.33 TT2 92.20 33.76 4647 0.16 Wengquan Basin WQ1 91.94 33.47 4778 clay 30 to 40 4.65 −0.09 WQ2 91.95 33.40 4817 3.36 −0.32 Tanggula Mts. TG2 91.88 33.31 4841
sandy clay 20 to 30
4.99 0.71 TG3 91.80 33.09 4926 4.56 0.27 TG4 91.75 33.07 4974 2.77 −1.15 Zajiazangbu River Basin TJ1 91.53 32.51 4868
TCD
5, 2465–2481, 2011Thermal state of the active layer and
permafrost
Q. Wu et al.
Title Page Abstract Introduction Conclusions References
Tables Figures
◭ ◮
◭ ◮
Back Close
Full Screen / Esc
Printer-friendly Version Interactive Discussion
Discussion
P
a
per
|
Dis
cussion
P
a
per
|
Discussion
P
a
per
|
Discussio
n
P
a
per
|
Table 2.Multi-year mean, max, min and changing rate of ALT along Qinghai-Xizang Railway.
ALT
Areas Sites mean max min changing rate name [m] [m] [m] [cm a−1]
TCD
5, 2465–2481, 2011Thermal state of the active layer and
permafrost
Q. Wu et al.
Title Page Abstract Introduction Conclusions References
Tables Figures
◭ ◮
◭ ◮
Back Close
Full Screen / Esc
Printer-friendly Version Interactive Discussion
Discussion
P
a
per
|
Dis
cussion
P
a
per
|
Discussion
P
a
per
|
Discussio
n
P
a
per
|
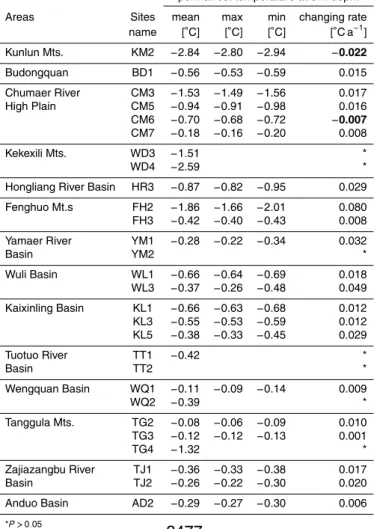
Table 3.Multi-year mean, max, min, and changing rate of permafrost temperature at the 6.0 m
depth permafrost temperature at 6 m depth.
permafrost temperature at 6 m depht Areas Sites mean max min changing rate
name [◦C] [◦C] [◦C] [◦C a−1]
Kunlun Mts. KM2 −2.84 −2.80 −2.94 −0.022
Budongquan BD1 −0.56 −0.53 −0.59 0.015 Chumaer River CM3 −1.53 −1.49 −1.56 0.017 High Plain CM5 −0.94 −0.91 −0.98 0.016
CM6 −0.70 −0.68 −0.72 −0.007
CM7 −0.18 −0.16 −0.20 0.008 Kekexili Mts. WD3 −1.51 * WD4 −2.59 * Hongliang River Basin HR3 −0.87 −0.82 −0.95 0.029 Fenghuo Mt.s FH2 −1.86 −1.66 −2.01 0.080 FH3 −0.42 −0.40 −0.43 0.008 Yamaer River YM1 −0.28 −0.22 −0.34 0.032
Basin YM2 *
Wuli Basin WL1 −0.66 −0.64 −0.69 0.018 WL3 −0.37 −0.26 −0.48 0.049
Kaixinling Basin KL1 −0.66 −0.63 −0.68 0.012 KL3 −0.55 −0.53 −0.59 0.012 KL5 −0.38 −0.33 −0.45 0.029 Tuotuo River TT1 −0.42 *
Basin TT2 *
Wengquan Basin WQ1 −0.11 −0.09 −0.14 0.009 WQ2 −0.39 * Tanggula Mts. TG2 −0.08 −0.06 −0.09 0.010 TG3 −0.12 −0.12 −0.13 0.001 TG4 −1.32 * Zajiazangbu River TJ1 −0.36 −0.33 −0.38 0.017 Basin TJ2 −0.26 −0.22 −0.30 0.020 Anduo Basin AD2 −0.29 −0.27 −0.30 0.006
TCD
5, 2465–2481, 2011Thermal state of the active layer and
permafrost
Q. Wu et al.
Title Page Abstract Introduction Conclusions References
Tables Figures
◭ ◮
◭ ◮
Back Close
Full Screen / Esc
Printer-friendly Version Interactive Discussion
Discussion
P
a
per
|
Dis
cussion
P
a
per
|
Discussion
P
a
per
|
Discussio
n
P
a
per
|
Table 4.Multi-year mean, max, min and changing rate of MAGT.
MAGT
Areas Sites mean max min changing rateo name [◦C] [◦C] [◦C] [◦C a−1]
Kunlun Mts. KM2 −3.04 −2.99 −3.1 0.027 Budongquan BD1 −0.60 −0.61 −0.58 0.007 Chumaer River CM3 −1.20 −1.19 −1.21 0.004
High Plain CM5 −1.20 −1.16 −1.23 0.016
CM6 −0.95 −0.94 −0.97 −0.003
CM7 −0.41 −0.38 −0.44 0.014 Kekexili Mts. WD3 −1.53 −1.50 −1.57 0.017 WD4 −2.56 −2.50 −2.61 0.025 Hongliang River Basin HR3 −1.11 −1.06 −1.19 0.03 Fenghuo Mt.s FH2 −2.02 −1.9 −2.16 0.06 FH3 −0.65 −0.64 −0.67 0.003 Yamaer River YM1 −0.39 −0.37 −0.41 0.012 Basin YM2 −0.25 −0.20 −0.34 0.029 Wuli Basin WL1 −0.63 −0.63 −0.64 0.003 WL3 −0.50 −0.49 −0.5 0.003 Kaixinling Basin KL1 −0.69 −0.67 −0.71 0.009 KL3 −0.72 −0.7 −0.74 0.009 KL5 −0.60 −0.58 −0.63 0.012 Tuotuo River TT1 −0.33 −0.32 −0.33 0.003
Basin TT2 0.16 0.17 0.16 0.004 Wengquan Basin WQ1 −0.09 −0.08 −0.1 0.003 WQ2 −0.32 −0.29 −0.36 0.029 Tanggula Mts. TG2 0.71 * TG3 0.27 0.27 0.26 0.003 TG4 −1.15 −1.13 −1.16 0.004 Zajiazangbu River TJ1 −0.06 * Basin TJ2 −0.08 −0.09 −0.06 0.007 Anduo Basin AD2 −0.08 −0.08 −0.09 0.001
TCD
5, 2465–2481, 2011Thermal state of the active layer and
permafrost
Q. Wu et al.
Title Page Abstract Introduction Conclusions References
Tables Figures
◭ ◮
◭ ◮
Back Close
Full Screen / Esc
Printer-friendly Version Interactive Discussion
Discussion
P
a
per
|
Dis
cussion
P
a
per
|
Discussion
P
a
per
|
Discussio
n
P
a
per
|
Fig. 2. ALT along the Qinghai-Xizang (Tibet) Highway, (a) active layer thickness; and (b)
TCD
5, 2465–2481, 2011Thermal state of the active layer and
permafrost
Q. Wu et al.
Title Page Abstract Introduction Conclusions References
Tables Figures
◭ ◮
◭ ◮
Back Close
Full Screen / Esc
Printer-friendly Version Interactive Discussion
Discussion
P
a
per
|
Dis
cussion
P
a
per
|
Discussion
P
a
per
|
Discussio
n
P
a
per
|
Fig. 3. Variation of permafrost temperature at 6.0 m depth along the Qinghai-Xizang (Tibet)