A SAM-based Model, constructed from the SNA, to be used for studying
the distributional impacts of government policies in Portugal.
Susana Santos
ISEG (School of Economics and Management)/TULisboa – Technical University of Lisbon; UECE – Research Unit on Complexity and Economics and DE – Department of Economics Rua Miguel Lupi, 20, 1249-078 Lisboa, Portugal
Tel.: +351 21 392 59 53 Fax: +351 21 397 11 96 E-mail: [email protected].
Key Words: Social Accounting Matrix; SAM-based Models; Income distribution. JEL Classification: D58; E10; E01; E61.
(May 2008)
Presented to the EcoMod2008 - International Conference on Policy Modeling, held in Berlin, Germany, on 3 July 2008.
Financial support by FCG (Fundação Calouste Gulbenkian) and FCT (Fundação para a
Abstract
An attempt will be made to study the impacts of government policies on the distribution of income, paying close attention to the corresponding response of the different macroeconomic aggregates and balances.
The Social Accounting Matrix (SAM) will be chosen as the working instrument. A numerical version of the SAM, constructed from the System of National Accounts (SNA), will serve as the basis for the construction of an algebraic version of the same matrix for Portugal.
This methodological choice was linked to the fact that, underlying the SAM, there are interrelated subsystems that, in the numerical version of the matrix, provide an analytical picture of the circular flow or general equilibrium interactions of the market economy, when studied during a particular accounting period. On the other hand, in the algebraic version of the SAM, it is possible to measure and quantify the economy-wide effects of changes in the particular nominal flows represented by the numerical version (injections from and leakages into the system), which might be the result of policy measures.
To this end, a computable (numerically solvable) general (economy-wide) equilibrium (macroeconomic balance) approach will be adopted.
A SAM-based model will be constructed in perfect consonance with the SNA, in which each cell is defined with a linear equation or system of equations, whose components are all the known and quantified transactions of that system, using the parameters of the numerical SAM that served as the basis for this model.
Scenarios will be defined and analysed from experiments carried out in relation to the distributional impact of government policies.
A SAM-based model, constructed from the SNA, to be used for studying the distributional impacts of government policies in Portugal. S. Santos
CONTENTS
1. Introduction ... 1
2. The numerical version of the SAM ... 2
3. The algebraic version of the SAM ... 13
3.1. Framework and assumptions ... 13
3.2. Specification by SAM blocks of sub-matrices ... 14
3.2.1. Compensation of factors of production ... 15
3.2.2. Production ... 17
3.2.3. External Trade ... 18
3.2.4. Net indirect taxes or net taxes on production and imports ... 18
3.2.5. Trade and Transport Margins ... 20
3.2.6. Domestic Trade ... 20
3.2.6.1. Intermediate Consumption ... 21
3.2.6.2. Final Consumption ... 21
3.2.6.3. Gross Capital Formation ... 22
3.2.7. Current Transfers ... 22
3.2.8. Capital Transfers ... 23
3.2.9. Gross Saving ... 24
3.2.10. Financial Transactions ... 24
3.3. Closure – Net borrowing/lending ... 24
3.4. Clearing ... 25
4. Macroeconomic aggregates and balances ... 27
5. The structural indicators of the distribution and use of income ... 30
6. Experiments and scenarios with the distributional impact of government policies ... 34
7. Summary and concluding remarks ... 42
References ... 45
A SAM-based model, constructed from the SNA, to be used for studying the distributional impacts of government policies in Portugal. S. Santos
1. Introduction
The main purpose of this paper is to study the impacts of government policies on the distribution of income, paying close attention to the corresponding response of the different macroeconomic aggregates and balances.
Because of this aim, the author was obliged to work with data that were more than a decade out of date, since 1995 was the only year for which there existed workable data. However, the task to be carried out in this study is seen as an experiment that has never previously been undertaken for Portugal, while, furthermore, it seeks to demonstrate the importance and potentialities of the working instrument used.
The Social Accounting Matrix (SAM) is the working instrument, i.e. a square matrix in which, by convention, the entries made in rows represent resources, incomes, receipts or changes in assets, whilst the entries made in columns represent uses, outlays, expenditures or changes in liabilities and net worth. Therefore, for each row there is a corresponding column, with the totals of each of these being equal. These figures will include both production and institutional accounts, which are subdivided into yet other accounts.
A numerical version of the SAM, constructed from the System of National Accounts (SNA), will serve as the basis for the construction of an algebraic version of the same matrix.
This methodological choice was linked to the fact that, underlying the SAM, there are interrelated subsystems that, in the numerical version of the matrix, provide an analytical picture of the circular flow or the general equilibrium interactions of the market economy, when studied during a particular accounting period. On the other hand, in the algebraic version of the SAM, it is possible to measure and quantify the economy-wide effects of changes in the particular nominal flows represented by the numerical version (injections into and leakages from the system), which might be the result of policy measures.
Section 2 provides a rapid presentation of the numerical version of the SAM, constructed in perfect consonance with the System of National Accounts (SNA) through a top-down approach1.
1 A detailed presentation of this SAM was made to the EcoMod2006 - International Conference on Policy Modelling, held in Hong Kong, China, on 29 June 2006, under the title “Constructing a database for economic modelling from the System of National Accounts: a Social Accounting Matrix for Portugal”. The paper presented at that conference is also published in the Working Paper Series of the Social Science Research Network (Santos S., 2006).
A SAM-based model, constructed from the SNA, to be used for studying the distributional impacts of government policies in Portugal. S. Santos
In turn, Section 3 presents an algebraic version of the above-mentioned SAM, within a static short-term framework, adopting a computable (numerically solvable) general (economy-wide) equilibrium (macroeconomic balance) approach.
Like the numerical version, this algebraic version of the SAM, which will also be referred to as a SAM-based model, is constructed in perfect consonance with the SNA, with each cell being defined through a linear equation or system of equations, whose components are all the known and quantified transactions of that system. This model will be calibrated using parameters and exogenous variables calculated from the database, i.e. the numerical version of the SAM, presented in Section 2.
Sections 4 and 5 show how macroeconomic aggregates and balances, as well as the structural indicators of the distribution and use of income (which can be constructed from the available information), can be calculated from both versions of the SAM.
Section 6 defines and analyses scenarios arising from experiments that have been carried out into the distributional impact of government policies. For this purpose, some parameters and the exogenous variables used to calibrate the model will be subjected to shocks, the SAM-based model will then be processed and the impacts will be studied by considering the relative differences between the aggregates, balances and indicators presented in Sections 4 and 5, after and before the experiments.
Section 7 ends the paper with a summary and some concluding remarks designed to emphasise the importance of the SAM as a working instrument.
2. The numerical version of the SAM
The main purpose of this paper and the available information were the determinants of the classification adopted for the accounts of the numerical and, consequently, the algebraic versions of the SAM. Thus, in the case of the domestic economy, “Production” was divided into factors of production, activities and products, and “Institutions” into current, capital and financial accounts. Besides these accounts, we also have an aggregate account for the “rest of the world”.
The criterion used by the author for ordering the accounts was the one underlying the basic SAM represented in Table 1.
Nowadays, the SNA in general and the Portuguese National Accounts in particular provide several (mutually exclusive) possibilities for the disaggregation of products and activities,
A SAM-based model, constructed from the SNA, to be used for studying the distributional impacts of government policies in Portugal. S. Santos
only a few possibilities for the institutional accounts, and even fewer possibilities for the factors of production.
The SNA that has been used in Portugal since 1995 has been the European System of National and Regional Accounts in the European Community of 1995 – ESA 95 (Eurostat, 1996), which is based on the 1993 version of the International United Nations System of National Accounts – SNA 93, prepared by the Inter-Secretariat Working Group and published by the United Nations Statistical Office (ISWG, 1993).
Table 2 shows the Portuguese SAM that it was possible to construct from the SNA, with the particular purpose described in the introduction, and which will be broken down even further, albeit using other sources of information.
This macro-SAM was constructed from blocks of sub-matrices or sets of sub-matrices, whose transactions have common characteristics. These blocks can be specified through the identification of the transactions involved in the National Accounts, which is performed in Section 3 on the occasion of their formalisation. A systematised description of the sources of information and the method of calculation used is provided by Santos in “SAMs and SNA: An Application” (2005) and “Constructing a Database for Economic Modelling from the SNA: a SAM for Portugal” (2006). The first of these also includes a description of the SAM cell contents, although this relates to a SAM calculated for 1999.
As can be seen from its totals, Table 2, which represents the so-called macro-SAM, is a possible disaggregation of Table 1, which represents the so-called basic SAM (the completely aggregated macro-SAM).
If we look at the world around us, it is easy to agree with the statement that “the determinants of the distribution of income and the mechanisms by which it changes represent one of the most difficult theoretical and empirical problems facing the science of economics” (Dervis et al., 1982). If it were an easy task, then certainly the world today would be a fairer place.
Working on the empirical side, the author believes that “SAMs provide an invaluable statistical framework for the analysis of the mapping between the different kinds of distributions one may want to consider” (Dervis et al., 1982).
A SAM-based model, constructed from the SNA, to be used for studying the distributional impacts of government policies in Portugal. S. Santos
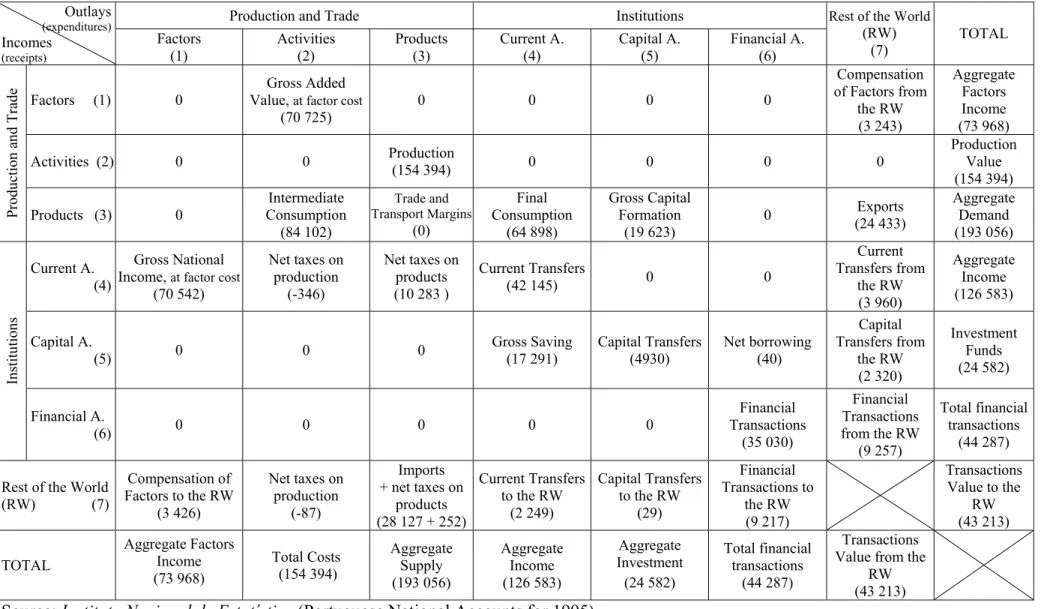
Table 1. Portuguese basic SAM (Social Accounting Matrix) for 1995 (in millions of euros)
Production and Trade Institutions
Outlays
(expenditures)
Incomes
(receipts)
Factors
(1) Activities (2) Products (3) Current A. (4) Capital A. (5) Financial A. (6)
Rest of the World
(RW)
(7) TOTAL
Factors (1) 0 Value, Gross Added at factor cost
(70 725) 0 0 0 0 Compensation of Factors from the RW (3 243) Aggregate Factors Income (73 968) Activities (2) 0 0 Production (154 394) 0 0 0 0 Production Value (154 394) Pr odu ction an d Tr ad e
Products (3) 0 Consumption Intermediate
(84 102) Trade and Transport Margins (0) Final Consumption (64 898) Gross Capital Formation (19 623) 0 Exports (24 433) Aggregate Demand (193 056) Current A. (4) Gross National Income, at factor cost
(70 542) Net taxes on production (-346) Net taxes on products (10 283 ) Current Transfers (42 145) 0 0 Current Transfers from the RW (3 960) Aggregate Income (126 583) Capital A.
(5) 0 0 0 Gross Saving (17 291) Capital Transfers(4930) Net borrowing (40)
Capital Transfers from the RW (2 320) Investment Funds (24 582) In stitu tion s Financial A. (6) 0 0 0 0 0 Financial Transactions (35 030) Financial Transactions from the RW (9 257) Total financial transactions (44 287) Rest of the World
(RW) (7) Compensation of Factors to the RW (3 426) Net taxes on production (-87) Imports + net taxes on products (28 127 + 252) Current Transfers to the RW (2 249) Capital Transfers to the RW (29) Financial Transactions to the RW (9 217) Transactions Value to the RW (43 213) TOTAL Aggregate Factors Income (73 968) Total Costs (154 394) Aggregate Supply (193 056) Aggregate Income (126 583) Aggregate Investment (24 582) Total financial transactions (44 287) Transactions Value from the
RW (43 213)
Source: Instituto Nacional de Estatística (Portuguese National Accounts for 1995)
A SAM-based model, constructed from the SNA, to be used for studying the distributional impacts of government policies in Portugal. S. Santos
Table 2. Portuguese macro-SAM (Social Accounting Matrix) for 1995 (in millions of euros)
A SAM-based model, constructed from the SNA, to be used for studying the distributional impacts of government policies in Portugal. S. Santos
Table 2. Portuguese macro-SAM (Social Accounting Matrix) for 1995 (in millions of euros) (continued)
A SAM-based model, constructed from the SNA, to be used for studying the distributional impacts of government policies in Portugal. S. Santos
Perhaps in a rather simplistic way, but at least to begin with, the author accepts that the study of income distribution in a society involves the study of how the national pie is divided up and how it can then be sliced. The first aspect can be analysed from one or more snapshots of the economy, provided by a suitably disaggregated SAM, and the second from the modelling of that same SAM. Therefore, of crucial importance here is the way in which the primary and secondary distribution of income, as well as the use that is made of it, are dealt with. The factors of production account and the current account of the institutions are the accounts that cover such issues.
“In the SAM, the institution entitled ‘households’ really represents all the people in society” (Dervis et al., 1982). Its disaggregation therefore needs to be performed. On the other hand, the distribution of the (primary) incomes that accrue as a result of the involvement in processes of production or the ownership of assets among institutions (and activities) is covered by the factors of production account, so that its disaggregation must also be performed.
The question thus arises “how should these disaggregations be performed?” This will not, however, be discussed here, because our dependence on the available data is total2, although, despite the fact that the information is not up-to-date, it is nonetheless sufficient for us to be able to at least study some aspects of the distribution of income.
The workable data made available to the author for studying and modelling income distribution in Portugal consisted of an incomplete disaggregated National Accounting Matrix (NAM) and a previous (provisional) version for 1995, constructed as a result of the collaboration of the Portuguese Statistical Institute (Instituto Nacional de Estatística) in the work undertaken by the Leadership Group on Social Accounting Matrices, under the coordination of Statistics Netherlands (LEG, 2003).
In that NAM, labour was broken down into six types, according to the gender and education level of workers, and households were broken down into four types, according to their main source of income. Such disaggregation was performed using specific data sources, such as household budget surveys, the labour force survey and administrative data (employment records, income tax and social security files, etc.)3.
In this paper, gender will not be considered and the factors of production will be disaggregated into two main groups: labour (or employees) and own assets; the latter being
2 Dervis et al. (1982), for instance, discuss this aspect (see Chapter 12, Modelling Distributional Mechanisms). 3 The document resulting from that work (LEG, 2003) highlights the limitations and the methodological details
A SAM-based model, constructed from the SNA, to be used for studying the distributional impacts of government policies in Portugal. S. Santos
further disaggregated into labour (employers and own-account workers) and capital. This disaggregation was based on the data available in the National Accounts, since the primary distribution of income account does not distinguish account labour (employers and own-account workers) from capital.
In turn, households were disaggregated into the same four types.
Thus, one of the many advantages of the SAM approach could be referred to here, to use the words of Pyatt (1991): by “reducing the social accounts to the essential”, the SAM approach “provides a useful starting point for understanding the assumptions and manipulations that have been built into the secondary source material which is typically employed by the majority of analysts”.
This top-down approach made it possible to compile a numerical version of the SAM with 34 rows and 34 columns, which has the particularity of being balanced and perfectly consonant with the national accounts when aggregated at the level of 26 rows and columns – the case of the macro-SAM represented by Table 2. However the disaggregation into 34 rows and columns was also performed from credible sources, with its differences from the aggregated level (26 x 26) not being very significant, generally speaking.
If we consider T to be the matrix of the SAM transactions, represented by tij, or a payment from column account j to row account i, and y to be the vector of row sums, which equal the vector of column sums x:
=∑ j ij i t y (2.1) =∑ i ij j t x (2.2) and yi =xj, when i = j (2.3) the tij´s of the macro-SAM (26x26), with the factors of production and the current account of households completely aggregated and perfectly consonant with the national accounts and balanced (Table 2), can be considered as the “control” total of the tij´s of the SAM (34x34). Therefore the SAM will have sub-matrices that are disaggregations of cells (the “control” totals) of the macro-SAM, whose initial versions will be considered as Zij, with typical element zij.
An adjusted SAM T´ij will be obtained from the adjustment of the sub-matrices Zij. In order to do this, these sub-matrices will be adjusted one by one, using the RAS (Richard A. Stone)
A SAM-based model, constructed from the SNA, to be used for studying the distributional impacts of government policies in Portugal. S. Santos
method, and an adjusted SAM T´ij will be obtained from the adjustment of the sub-matrices Zij.
Therefore, each element, derived from a sub-matrix Zij, of the adjusted matrix T´ij will be represented by the following equation:
t´ij = ri * zij * sj (2.4) with, ri = ∑ j ij i z c (2.5) and sj = ∑ i ij j z d (2.6) where: t´ij = (adjusted) SAM cell
ri = row multiplier ci = row control total
zij = typical element of the sub-matrix Zij sj = column multiplier
dj = column control total
i and j = disaggregations of the factors of production accounts and of the current account of households
As specified by Round (2003), this procedure results from the minimisation of
∑ ij ij ij ij z ´ t ln * ´ t (2.7) subject to: i j t´ij =c ∑ ; j i t´ij =d ∑ ; zij > 0.
The calculations were performed iteratively, with the sub-matrices Zij in the last iteration, in which ri and sj are equal to 1, being the ones that are included in Table 3 – the numerical version, or the database, of the algebraic version, or the model, to be defined and worked with in the next section.
A SAM-based model, constructed from the SNA, to be used for studying the distributional impacts of government policies in Portugal. S. Santos
Table 3. Portuguese SAM (Social Accounting Matrix) for 1995 (in millions of euros)
A SAM-based model, constructed from the SNA, to be used for studying the distributional impacts of government policies in Portugal. S. Santos
Table 3. Portuguese SAM (Social Accounting Matrix) for 1995 (in millions of euros) (continued)
A SAM-based model, constructed from the SNA, to be used for studying the distributional impacts of government policies in Portugal. S. Santos
Table 3. Portuguese SAM (Social Accounting Matrix) for 1995 (in millions of euros) (continued)
A SAM-based model, constructed from the SNA, to be used for studying the distributional impacts of government policies in Portugal. S. Santos
3. The algebraic version of the SAM 3.1. Framework and assumptions
Now that the details inherent in the SAM that will serve as the database for the model to be designed below have been specified, the starting idea will be the one outlined in the article “Macroeconomic Modelling Based on Social-Accounting Principles” and expressed in the following words:
“A dictum usually attributed to Lord Keynes posits that every economic model has a corresponding accounting framework. For macroeconomic models, this accounting framework must be complete in the sense that every receipt must be offset by a corresponding expenditure. One consequence is that all the transactions in a model can be expressed within a SAM framework. The values assumed by all the different types of transactions can therefore be set out as the elements of a SAM” (Drud et al., 1986: 112). Therefore, a static model will be defined and conceived as a starting point for both a comparative static and dynamic approach. On the other hand, since it will not be possible to calculate and work with price and volume indexes, a fixed-price model will be designed. Linear equations will be worked with, thereby avoiding elasticities, marginal propensities and other parameters that should be estimated from an empirical base, which is not available. Thus, the main concern will be to capture (to begin with in a very simple way) all the national accounting transactions considered in the numerical version of the SAM (the database for this model), and, after its calibration, to conduct some experiments and define some scenarios for the aspects that the author intends to study.
The process of calibration will involve determining the parameters and exogenous variables that are to be specified, so that, after processing the model, the base SAM (presented in Section 2) is exactly replicated. The software used to process the model was the GAMS (General Algebraic Modelling System) and the quantification of the whole process took into consideration all the available information, involving the values calculated using the information contained in that same base SAM, further supplemented by additional data. These values will be assumed as valid for the “experiments and scenarios with the distributional impact of government policies”, which are to be outlined in Section 6, except for those which will be subject to shocks.
Since the purpose of this model is to study income distribution, some usual specifications for the model will not be considered. These specifications include the ones that are also
A SAM-based model, constructed from the SNA, to be used for studying the distributional impacts of government policies in Portugal. S. Santos
constructed within a general equilibrium framework, usually to study trade issues, such as the distinction between domestically produced and imported products, while external trade will be considered exogenous in this version of the model.
For the purposes of simplification, it will also be assumed that all domestically produced output is market output, and therefore any output produced for own final use and other non-market output will be considered as non-existent4.
On the other hand, it will be assumed that there is sufficient production capability available in the economy to enable domestic output to respond to aggregate demand. Such a response will be considered exclusive, since (for the time being) imports are exogenous.
Many fixed parameters will be adopted and some variables will be calculated from exogenous parameters and other variables, in order to enable future experiments to be carried out with their changes.
This model is considered to be a step forward in comparison with the ones that the author has previously worked with, and, at the same time, a (necessary) stage along a path that she would like to pursue in SAM modelling. From her own experience, the author feels that SAM modelling does have a convenient path. Thus, on the one hand, when working on SAM modelling or with SAM-based models, some knowledge of SAM construction is considered to be a necessary, although not a sufficient, condition. On the other hand, underlying SAM modelling is a process of gradual maturation, which should begin with the construction and decomposition of accounting and fixed-price multipliers and the conducting of experiments with them. That is what the author has done, based essentially on the works of Pyatt, 1988; Pyatt and Roe, 1977; and Pyatt and Round, 1985. For an illustration of this work, see Santos, 1999; 2001; 2003; 2003a; 2004; 2004a; 2005a; and 2007.
This work is the beginning of the materialisation of the step after multipliers.
3.2. Specification by SAM blocks of sub-matrices
As this model is supported by a SAM database, constructed in perfect consonance with the national accounts, its specifications will either obey or be derived from the SNA, as described below.
4 In the year of this study, these two components together accounted for almost 13% of total output. However, considering that this model is the preliminary version of a model that will be progressively improved, they will not be considered at this stage.
A SAM-based model, constructed from the SNA, to be used for studying the distributional impacts of government policies in Portugal. S. Santos
By convention, the parameters will be stated in lower case and the variables in upper case (at least the first letter). Endogenous variables will be written in normal letters, whereas exogenous variables, as well as the parameters, will be written in italics. The indices of each variable and parameter (the sets in the Appendix) – identified in lower-case subscripts – describe the SAM accounts, the first index representing the row and the second one the column, being separated by commas. The symbols used in the description of the model will be listed alphabetically and without any indices, according to their type (endogenous or exogenous variables and parameters) in the Appendix.
The entire model will be worked upon in gross terms, so that the consumption of fixed capital will therefore not be considered.
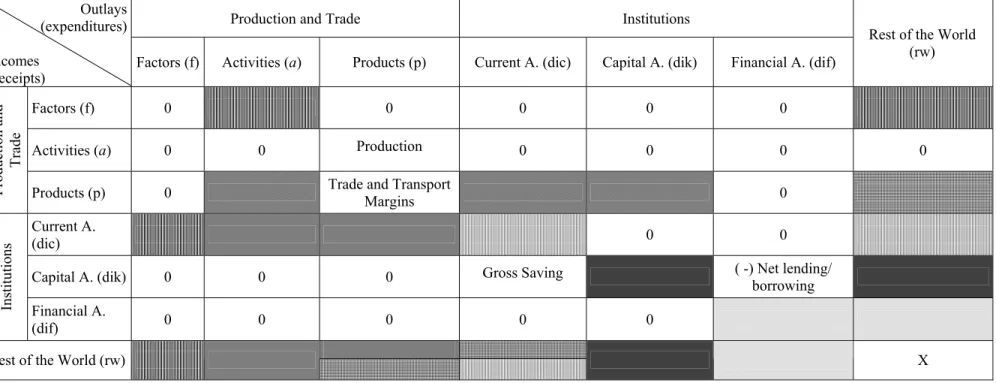
The SAM blocks, identified in Table 4, are sub-matrices or sets of sub-matrices (as seen in the Basic SAM – Table 1) with common characteristics. The specification of these blocks will be carried out below and involves, on the one hand, an identification of the transactions of the National Accounts that are considered in the calculation of the same in the numerical SAM and, on the other hand, a definition of the equation, or system of equations, to be considered in the algebraic SAM or SAM-based model.
3.2.1. Compensation of factors of production
This block consists of the income of the institutional sectors originating from the compensation of the services provided through their real and financial assets to the activities of production and to the rest of the world, namely:
− Compensation of employees (transaction D1 of the National Accounts), which is broken down into wages and salaries (in cash or in kind; transaction D11) and employers’ social contributions (actual and imputed social contributions; transaction D12) (SNA 93, paragraphs 7.21-7.47; ESA 95, paragraphs 4.02-4.13).
− Compensation of own-account assets, i.e. all the above-mentioned income that is not derived from the compensation of employees, including the compensation of employers and/or own-account workers, and of capital, namely property income (transaction D4 of the National Accounts). (SNA 93, paragraphs 7.87-7.133; ESA 95, paragraphs 4.41-4.76).
A SAM-based model, constructed from the SNA, to be used for studying the distributional impacts of government policies in Portugal. S. Santos
Table 4. Basic SAM by blocks
Production and Trade Institutions
Outlays (expenditures)
Incomes
(receipts) Factors (f) Activities (a) Products (p) Current A. (dic) Capital A. (dik) Financial A. (dif)
Rest of the World (rw)
Factors (f) 0 0 0 0 0
Activities (a) 0 0 Production 0 0 0 0
Pr odu ction an d Trade
Products (p) 0 Trade and Transport Margins 0
Current A.
(dic) 0 0
Capital A. (dik) 0 0 0 Gross Saving ( -) Net lending/ borrowing
In stitu tion s Financial A. (dif) 0 0 0 0 0
Rest of the World (rw) X
Blocks with more than one sub-matrix:
Compensation of the factors of production Current Transfers
Domestic Trade Capital Transfers
External Trade Financial Transactions
A SAM-based model, constructed from the SNA, to be used for studying the distributional impacts of government policies in Portugal. S. Santos
3.2.1.1. Gross Added Value
GAVa = βa*VPa (3.1)
GAVfle,a = d1s fle,a*GAVa (3.2)
D1a = ΣfleGAVfle,a (3.3)
GAVfle = ΣaGAVfle,a (3.4)
GAVfoal,a= b3s foal,a*GAVa (3.5)
B3ga = ΣfoalGAVfoal,a (3.6)
GAVfoal = ΣaGAVfoal,a (3.7)
GAVfoak,a = b2gpfoak,a*(D1a + B3ga) (3.8)
B2ga = ΣfoakGAVfoak,a (3.9)
GAVfoak = ΣaGAVfoak,a (3.10)
3.2.1.2. Compensation of factors from the rest of the world
CFRfle,rw = D1RWfle CFRfoak,rw = D4RW
3.2.1.3. Gross National Income
GNIfle = GAVfle+CFRfle,rw-CFSrw,fle (3.11)
GNIdic,fle= cedic,fle*GNIfle (3.12)
GNIfoal = GAVfoal (3.13)
GNIdic,foal= coadic,foal*GNIfoal (3.14)
GNIfoak = GAVfoak+CFRfoak,rw-CFSrw,foak (3.15)
GNIdic,foak= skdic,foak*GNIfoak (3.16)
GNIdic = ΣfleGNIdic,fle+ΣfoalGNIdic,foal+GNIdic,foak (3.17)
GNI = ΣdicGNIdic (3.18)
3.2.1.4. Compensation of factors to the rest of the world
CFSrw,fle = clrrw,fle*GAVfle (3.19)
CFSrw,foak = D4PRW
3.2.2. Production
This matrix/block represents the output of goods and services (transaction P1 of the National Accounts) (SNA 93, paragraphs 6.38-6.51; ESA 95, paragraphs 3.14-3.68).
A SAM-based model, constructed from the SNA, to be used for studying the distributional impacts of government policies in Portugal. S. Santos
As assumed in section 3.1, all output will be considered as market output, which will respond exclusively to aggregate demand, since there is sufficient production capability available in the economy.
VPp = ADp-TMTp-NTPp-IMp (3.20)
VPa,p = VPp*αa,p (3.21)
VPa =ΣpVPa,p (3.22)
3.2.3. External Trade
This block represents the transactions in goods and services (purchases, barter, gifts or grants) from non-residents to residents, or imports (transaction P7 of the National Accounts – IMrw,p), and from residents to non-residents, or exports (transaction P6 of the National Accounts –
EXp,rw) (ESA 95, paragraphs 3.128-3.1465).
Although the National Accounts consider direct purchases abroad by residents (FCrw,dic) as an import, in this model they will be considered as a current transfer from households to the rest of the world, considering that they will not be traded in the domestic market.
Imports are valued at c.i.f. (cost-insurance-freight included) prices (at the border of the importing country), whereas exports are valued at f.o.b. (free on board) prices (at the border of the exporting country) (ESA 95, paragraph 3.138).
In this version of the model external trade will be considered to be exogenous, as assumed in section 3.1.
3.2.4. Net indirect taxes or net taxes on production and imports
Net indirect taxes or the net taxes on production and imports have two main components: net taxes on production and net taxes on products, which will be treated separately in this model. On the other hand, the amount of each component will represent a receipt not only of the Portuguese general government, through the domestic institutions’ current account (dicg), but also of the European Union institutions, through the rest of the world account (rw), which will also be treated separately in the model.
5 The SNA 93 does not deal directly with these transactions, which are dealt with in all the other transactions with the rest of the world in its section XIV – The Rest of the World Account (external transactions account).
A SAM-based model, constructed from the SNA, to be used for studying the distributional impacts of government policies in Portugal. S. Santos
3.2.4.1. Net Taxes on Production
This part represents the (other) taxes on production (transaction D29 of the National Accounts) minus the (other) subsidies to production (transaction D39 of the National Accounts). The former consists of all the taxes that enterprises incur as a result of engaging in production, regardless of the quantity or value of the goods and services produced or sold (SNA 93, paragraph 7.70; ESA 95, paragraphs 4.22-4.24), while the latter consists of subsidies, except those subsidies to products which resident producer units may receive as a consequence of engaging in production (SNA 93, paragraph 7.79; ESA 95, paragraphs 4.36-4.40).
NTAdic,a= ntagdic,a*NTAAa (3.23)
NTArw,a= ntarwrw,a*NTAAa (3.24)
NTAdic= ΣaNTAdic,a (3.25)
NTAa= ΣdicNTAdic,a (3.26)
NTArw= ΣaNTArw,a (3.27)
NTA = ΣdicNTAdic+NTArw (3.28)
3.2.4.2. Net Taxes on Products
This part represents the taxes on products (transaction D21 of the National Accounts) minus the subsidies on products (transaction D31 of the National Accounts). The former consists of taxes that are payable per unit of a good or service produced or transacted (SNA 93, paragraphs 7.62-7.69; ESA 95, paragraphs 4.16-4.21), while the latter consists of subsidies payable per unit of a good or service produced or imported (SNA 93, paragraphs 7.73-7.78; ESA 95, paragraphs 4.33-4.35). NTPp = tpp*DTp (3.29) NTPdic,p= ntpgdic,p*NTPp (3.30) NTPrw,p= ntprwrw,p*NTPp (3.31) NTPdic= ΣpNTPdic,p (3.32) NTPrw = ΣpNTPrw,p (3.33) NTP = ΣdicNTPdic +NTPrw (3.34)
A SAM-based model, constructed from the SNA, to be used for studying the distributional impacts of government policies in Portugal. S. Santos
3.2.5. Trade and Transport Margins
Trade and transport margins are realised on goods purchased for resale. They are a part of the production of wholesale trade services, retail trade services and the repair services of motor vehicles, motorcycles and personal and household goods. They are recorded as part of the trade in products and are therefore included under the various components of aggregate demand. They amount to zero, since they are negative in relation to the three above-mentioned activities (because the corresponding value has already been recorded in the production sub-matrix), but are positive and have the same amount in relation to all the other ones (SNA 93, paragraphs 6.110-6.114, 15.40-15.44; ESA 95, paragraphs 3.60, 9.38-9.41). Being realised on goods purchased for resale, and therefore excluding services (p3-p6 – SAM accounts 11-14), trade and transport margins will be considered as a function of the value of domestically transacted goods (imported and domestically produced and not exported, at c.i.f./basic prices), based on an exogenously fixed rate (tm).
On the other hand, being a part of the production of wholesale trade services, retail trade services and the repair services of motor vehicles, motorcycles and personal and household goods (p4 and SAM account 12), which is considered in the production sub-matrix, the trade and transport margins sub-matrix will have only one non-zero row (p4 and SAM account 12). This is the one relating to the products that result from the above-mentioned resale activity, which, with the addition of a value of correction (TMc), will amount to zero, since the positive entries for the columns relating to the resale of goods (p1-p2 and SAM accounts 9-10) will be cancelled out by a negative entry introduced (in column p4 – SAM account 12) to avoid the double entry of the production of these activities, as referred to above.
TMp,p = tmp,p*DTp (3.35)
TMcp,p = tmcp,p*DTp (3.36)
TMTp = ∑p (TMp,p + TMcp,p ) (column sum) (3.37)
3.2.6. Domestic Trade
Domestic trade is represented by the value of domestically transacted products, either domestically produced or imported. It is represented by the sub-matrices of intermediate and final consumption, as well as gross capital formation – transactions that are valued at market or purchasers’ prices, i.e. having added the trade and transport margins and the net taxes on
A SAM-based model, constructed from the SNA, to be used for studying the distributional impacts of government policies in Portugal. S. Santos
products to the basic prices of domestically produced products or to the c.i.f. prices of imported products.
DTmpp = VICp + FCp + GCFp (3.38)
DTp = DTmpp - TMTp - NTPp (3.39)
3.2.6.1. Intermediate Consumption
The intermediate consumption (transaction P2 of the National Accounts) matrix/block consists of the value of the goods and services consumed as inputs by a process of production, excluding those fixed assets whose consumption is recorded as consumption of fixed capital. The goods and services may be either transformed or used up by the production process (SNA 93, paragraphs 6.147-6.178; ESA 95, paragraphs 3.69-3.73).
VICa = γa*VPa (3.40)
VICp,a = icpp,a*VICa (3.41)
VICp= ΣaVICp,a (3.42)
VIC = Σp ΣaVICp,a (3.43)
3.2.6.2. Final Consumption
Final consumption (transaction P3 of the National Accounts) consists of the expenditure incurred by resident institutional units on those goods or services that are used for the direct satisfaction of individual needs or wants or of the collective needs of members of the community. Such consumption takes place within the domestic territory or abroad. (SNA 93, paragraphs 9.45-9.71; ESA 95, paragraphs 3.75-3.80).
Direct purchases abroad by residents (FCrw,dic) are defined here, but are included in the current transfers to the rest of the world (the current transfers block).
Direct purchases by non-residents in the domestic market are included in exports (the external trade block).
FCdic = apcdic* DIdic (3.44)
FCp,dic = fcsp,dic*FCdic (3.45)
FCrw,dic = fcsrwrw,dic*FCdic (3.46)
A SAM-based model, constructed from the SNA, to be used for studying the distributional impacts of government policies in Portugal. S. Santos
3.2.6.3. Gross Capital Formation
The gross capital formation (transaction P5 of the National Accounts) matrix/block consists of gross fixed capital formation (transaction P51), changes in inventories (transaction P52), and acquisitions minus disposals of valuables (transaction P53) (SNA 93, paragraphs 10.32-10.130; ESA 95, paragraphs 3.100-3.127).
GCFp,dik = gfcfp,dik*P51dik + P52p*chinvp,dik + advp,dik*P53dik (3.47)
GCFdik = Σp GCFp,dik (3.48)
P52p = chinvcp*ASp (3.49)
P53dik = advcdik*Sdik (3.50)
3.2.7. Current Transfers
Current transfers include:
− Current taxes on income, wealth, etc. (transaction D5 of the National Accounts) (SNA 93, paragraphs 8.43-8.54; ESA 95, paragraphs 4.77-4.82).
− Social benefits and contributions (transaction D6 of the National Accounts). Social benefits are transfers to households, in cash (transaction D62) or in kind (transaction D63), intended to relieve them of the financial burden of a number of risks or needs, made either through collectively organised schemes or outside such schemes by government units and non-profit institutions serving households; they include payments from general government to producers which individually benefit households and which are made in the context of social risks or needs. Social contributions (transaction D61) include (employers’ and employees’) actual social contributions transferred to general government (SNA 93, paragraphs 8.67-8.83 and 8.99-8.106; ESA 95, paragraphs 4.83-4.108). Because the amount of social transfers in kind represents a final consumption expenditure of the government and the non-profit institutions serving households, it is not considered here, since it is included in the final consumption block.
− Other current transfers (transaction D7 of the National Accounts) (SNA 93, paragraphs 8.84-8.98; ESA 95, paragraphs 4.109-4.140).
− Adjustment made for the change in the net equity of households in pension fund reserves (transaction D8 of the National Accounts) (SNA 93, paragraphs 9.14-9.20; ESA 95, paragraphs 4.141-4.144).
A SAM-based model, constructed from the SNA, to be used for studying the distributional impacts of government policies in Portugal. S. Santos
As already mentioned and specified above, in the section on final consumption, direct purchases abroad by residents (FCrw,dic) will be added to the current transfers from households to the rest of the world.
CTdic,dic= d5sdic,dic*D5dic + d61sdic,dic*D61dic +d62sdic,dic*D62Pdic +
+ d7dic,dic*D7Pdic +D8dic,dic (3.51) CTrw,dic = d62rwsrw,dic *D62Pdic +d7rwsrw,dic *D7Pdic (3.52)
CTdic,rw = D62RWdic,rw +D7RWdic,rw (3.53)
CTRdic = Σdic CTdic,dic (row sum) (3.54)
CTPdic= Σdic CTdic,dic (column sum) (3.55)
D5dic = tidic*AIdic (3.56)
D61dic = scdic*GNIdic (3.57)
3.2.8. Capital Transfers
Capital transfers6 (transaction D9 of the National Accounts) cover capital taxes, investment grants and other capital transfers (SNA 93, paragraphs 10.131-10.141; ESA 95, paragraphs 4.146-4.167). Acquisitions less disposals of non-financial non-produced assets (transaction K2 of the National Accounts) – non-financial non-produced assets consisting of land and other tangible non-produced assets that may be used in the production of goods and services, as well as intangible non-produced assets (SNA 93, paragraphs 10.120-10.130; ESA 95, paragraphs 6.06-6.13) – are also covered.
KTdik,dik = d91dik,dik *D91Pdik +D92Rdik*d92dik,dik + D99Rdik*d99dik,dik (3.58)
KTrw,dik = D92Prw,dik+ D99Prw,dik + K2 rw,dik (3.59)
KTdik,rw = D92Rdik *d92rw dik,rw + D99Rdik*d99rwdik,rw (3.60)
D91Pdik = tkdik * D99Rdik (3.61)
D92Rdik = cgfcf dik*P51dik (3.62)
KTRdik = ΣdikKTdik,dik (row sum) (3.63)
KTPdik = ΣdikKTdik,dik (column sum) (3.64)
6 Capital transfers are different from current transfers because they involve the acquisition or disposal of an asset, or assets, by at least one of the parties to the transaction. Whether made in cash or in kind, such transfers should result in a commensurate change in the financial, or non-financial, assets shown in the balance sheets of one or both parties to the transaction (ESA 95, paragraphs 4.145).
A SAM-based model, constructed from the SNA, to be used for studying the distributional impacts of government policies in Portugal. S. Santos
3.2.9. Gross Saving
Gross saving measures the portion of aggregate income that is not used for final consumption expenditure and current transfers to Portuguese institutions or to the rest of the world (saving: SNA 93, paragraphs 9.17-9.20; ESA 95, paragraph 8.96).
Savings will therefore be the part of the disposable income (DI) that is not consumed and will represent the current budget balance of domestic institutions.
Sdic = (1-apcdic)*DIdic (3.65)
Sdik,dic = sidik,dic*Sdic (3.66)
Sdik = ΣdikSdik,dic (3.67)
3.2.10. Financial Transactions
Financial transactions (F1-7 of the National Accounts) are transactions in financial assets and liabilities between institutional units, and between these and the rest of the world. They are classified as monetary gold and special drawing rights; currency and deposits; securities other than shares; loans; shares and other equity; insurance technical reserves; and other accounts receivable/payable.
The outlays (expenditures) side of the (financial) account records changes in the assets, i.e. acquisitions less disposals of financial assets. The incomes (receipts) side of the same account records changes in liabilities and net worth, i.e. the incurrence of liabilities minus their repayment. The balancing item of the financial account, i.e. the net acquisition of financial assets minus the net incurrence of liabilities, is net lending (+)/net borrowing (-) (SNA 93, paragraphs 11.1-11.111; ESA 95, paragraphs 5.01-5.151) – this will be the only endogenous part of this block in this version of the model.
FTRWdif,rw = FTrw,dif + NLBdif (3.68)
3.3. Closure - Net borrowing/lending
The net lending (+) or borrowing (-) of the total economy is the sum of the net lending or borrowing of the institutional sectors. It represents the net resources that the total economy makes available to the rest of the world (if it is positive) or receives from the rest of the world (if it is negative). The net lending (+) or borrowing (-) of the total economy is equal (but with an opposite mathematical sign) to the net borrowing (-) or lending (+) of the rest of the world (ESA 95, paragraph 8.98).
A SAM-based model, constructed from the SNA, to be used for studying the distributional impacts of government policies in Portugal. S. Santos
Here, those amounts that fall short of (+) or exceed (-) the investment funds used to cover aggregate investment are registered in the capital and financial accounts, since they are financial transactions either from (in the case of net borrowing) or to (in the case of net lending) the rest of the world – this is why the mathematical signs defined in the first paragraph of this item (ESA 95, paragraph 8.98) have been exchanged.
The net borrowing/lending represents the total budget balance of domestic institutions – a deficit in the case of net borrowing and a surplus in the case of net lending.
NLBdik,dif = AINVdik – (Sdik +KTRdik+KTdik,rw) (3.69)
NLBdif = Σdik NLBdik,dif (3.70)
3.4. Clearing 3.4.1. Row totals
Aggregate factors income (received):
AFIRfle = GAVfle + CFRfle,rw (3.71)
AFIRfoal = GAVfoal (3.72)
AFIRfoak = GAVfoak + CFRfloak,rw (3.73)
Production value: VPTa = ΣpVPap (3.74)
Aggregate demand:
ADp = VICp + FCp + GCFp + EXp,rw (3.75)
Aggregate income:
AIdic = GNIdic + NTAdic + NTPdic + CTRdic +CTdic,rw (3.76) Investment funds:
INVFdik = Sdik+ KTRdik + NLBdik,dif + KTdik,rw (3.77)
Total financial transactions:
TFTRdif = FTdif,dif + FTRWdif,rw (3.78)
Value of transactions to the rest of the world:
TVRWPrw = ΣfleCFSrw,fle + CFSrw,foak + ΣaNTArw,a+ Σp(NTPrw,p + IMrw,p) +
A SAM-based model, constructed from the SNA, to be used for studying the distributional impacts of government policies in Portugal. S. Santos
3.4.2. Column totals
Aggregate factors income (paid):
AFIPfle = GNIfle + CFSrw,fle (3.80)
AFIPfoal = GNIfoal (3.81)
AFIPfoak = GNIfoak + CFSrw,foak (3.82)
Total costs:
VCTa = GAVa + VICa + NTAa + NTArw,a (3.83) Aggregate supply:
ASp = VPp + TMTp + NTPp + IMrw,p (3.84)
Aggregate income:
AIPdic = FCdic + CTPdic + Sdic + (CTrw,dic+ FCrw,dic) (3.85) Aggregate investment:
AINVdik = GCFdik + KTPdik + KTrw,dik (3.86)
Total financial transactions:
TFTPdif = NLBdif+ FTdif,dif + FTrw,dif (3.87)
Value of transactions from the rest of the world:
TVRWRrw = ΣfleCFRfle,rw + CFRfoa,rw + ΣpEXp,rw+ ΣdicCTdic,rw+
+ Σdik KTdik,rw+ FTRWdif,rw (3.88)
3.4.3. Row totals = column totals
AFIR fle = AFIPfle (3.89)
AFIR foal = AFIPfoal (3.90)
AFIR foak = AFIPfoak (3.91)
VPTa = VCTa (3.92)
ADp = ASp (3.93)
AIdic = AIPdic (3.94)
A SAM-based model, constructed from the SNA, to be used for studying the distributional impacts of government policies in Portugal. S. Santos
TFTRdif = TFTPdif (3.96)
TVRWPrw = TVRWRrw (3.97)
4. Macroeconomic aggregates and balances
From the two versions of the SAM that have already been defined, it is possible to deduce macroeconomic aggregates, such as the ones described below.
Gross domestic product at market prices:
GDP = Σa GAVa + NTP+ NTA (4.1)
GDP = 80,827 million euros, from the numerical version. Gross national income (at market prices):
GNIMP = GNI+ Σdic NTPdic + Σdic NTAdic (4.2)
GNIMP = 80,479 million euros, from the numerical version. Gross disposable income:
DI = Σdic DIdic (4.3)
DIdic = GNIdic+ NTAdic+ NTPdic + CTRdic + CTdicrw – CTPdic– CTrwdic (4.4) DI = 83,517 million euros, from the numerical version.
Gross saving:
S = Σdic Sdic (4.5)
S = 17,291 million euros, from the numerical version. Net lending/borrowing (of the economy): NLBdif
From the numerical version, the Portuguese economy had a net borrowing of 40 million euros (0.05% of GDP).
On the other hand, the main items in the budget of all institutions, namely of the government, can be calculated from the respective accounts. Thus: the total budget balance is the respective net lending/borrowing – NLBdik,dif.; the current budget balance is the respective gross saving – Sdik; and the capital budget balance is the difference between the first and the second.
From the numerical version, Table 5 was constructed for the government and households – the same procedure could also be carried out for the other institutions.
From that table, as well as from Table 3 – cells: (28,33) – (32,33), it can be seen that the net borrowing of the government is almost completely covered by the net lending of households,
A SAM-based model, constructed from the SNA, to be used for studying the distributional impacts of government policies in Portugal. S. Santos
although all the other institutions have a relatively small amount of net lending. In other words, the government is the institution that has a total budget balance with a deficit, which is almost completely covered by the other institutions, with households being in a highly significant position, which is, however, not sufficient to avoid a net borrowing for the economy of 40 million euros (0.05% of GDP). In terms of the current balance, or gross saving (see also Table 3 – cells: (28,20) – (32,27)), the government is again the institution that has a deficit, although, within households, the group labelled as “others” (those whose main source of income is not wages and salaries, mixed income including property income or income in connection with old age) also has a deficit. Therefore, with the exception of the government, all the institutions covered their needs in terms of investment funds, as well as a substantial part of those of the government.
From Table 5, it is easy to see how current transfers from Portuguese institutions and net taxes on products are the main sources of the government’s receipts, while current transfers to Portuguese institutions and final consumption are the main sources of its expenditure. In the case of households, the income generated by these (or gross national income) and final consumption are, respectively, the main sources of receipts and expenditure.
In turn, the main items of the balance of payments can also be calculated from the rest of the world account. However, this will not be done here, because the relations with the rest of the world were not considered relevant within the framework of this paper – see Santos, 2006.
A SAM-based model, constructed from the SNA, to be used for studying the distributional impacts of government policies in Portugal. S. Santos
Table 5. The Government and Households Budget in the Portuguese SAM for 1995 (in millions of euros)
Resources or Receipts (row) Uses or Expenditure (column) Balance
Government Households Government Households Government Households
1. Current
Account (a) 31 081 76 413 32 742 68 461 - 1661 7 952
Gross National Income at
factor cost (a) - 2558 59 614 Final Consumption 15 032 49 905
Net taxes on production - 346 - Current transfers to Portuguese institutions 17 371 18 141
Net taxes on products 10 283 - Current transfers to the RW 339 416
Current transfers from
Portuguese institutions 23 092 13 506 Current transfers from
the RW 609 3 293
2. Capital
Account 3 375 1 166 6 136 5 095 - 2 761 - 3929
Capital transfers from
Portuguese institutions 2 100 1 018 Gross Capital Formation 3 018 5 755
Capital transfers from
the RW 1 275 147
Capital transfers to Portuguese
institutions 3 075 63
Capital transfers to the RW 43 - 723
3 = 1 + 2 (b) 34 456 77 579 38 878 73 556 - 4 423 4 023
Source: Table 2 (rows/columns 18 and 23)
(a) Balance = Gross saving (Sdikg for government; Sdikh for households).
A SAM-based model, constructed from the SNA, to be used for studying the distributional impacts of government policies in Portugal. S. Santos
5. The structural indicators of the distribution and use of income
Considering that the distributional relationships across production sectors or activities and social groups are determined by the macro behaviour, which, in turn, is determined by the behaviour of individuals within and on behalf of institutions, this means that if we are to study the distributional impact of exogenous shocks resulting from any policy, as proposed in the Introduction (Section 1) and exemplified in Section 6, it is important to have some indicators that, in addition to the macroeconomic aggregates and balances, synthesise that impact as much as possible. Therefore, two aspects will be considered: the distribution of generated income and the distribution and use of disposable income.
Due to a lack of information about the total number of persons by groups of households, only the structures of the distribution and use of income will be considered here – leaving the identification of inequality for a subsequent stage.
A. Distribution of generated income
A.1. Among factors of production and activities
The functional distribution of income can be studied here through an analysis of the division of gross added value at factor cost (excluding indirect taxes) between labour and capital, disaggregated by activity. It is also important to distinguish between types of labour (Dervis et al., 1982) – in this case by the level of education of workers.
Digavfle,a = (D1a / GAVa)*100 (5.1)
Digavfoal,a = (B3ga / GAVa)*100 (5.2)
Digavfoak,a = (B2ga / GAVa)*100 (5.3)
Digavfle= (Σa D1a / Σa GAVa)*100 (5.4)
Digavfoal= (Σa B3ga / Σa GAVa)*100 (5.5)
Digavfoak= (Σa B2ga / Σa GAVa)*100 (5.6)
Digavflefle,a = (GAVfle,a/ D1a)*100 (5.7)
Digavfoalfoal,a = (GAVfoal,a / B3ga)*100 (5.8)
Digavflefle = (GAVfle / Σa D1a)*100 (5.9)
Digavfoalfoal = (GAVfoal / Σa B3ga)*100 (5.10)
The following tables were constructed from the numerical version of the SAM – the links to the algebraic version are shown between brackets.
A SAM-based model, constructed from the SNA, to be used for studying the distributional impacts of government policies in Portugal. S. Santos
Table 6. Distribution of gross added value, at factor cost, among factors of production and activity, in the Portuguese SAM for 1995 (in percentage terms).
a1 a2 a3 a4 a5 a6 Total
Labour – employees
(Digavfle,a ; Digavfle, for Total ) 16.4 53.5 52.9 46.5 43.0 80.0 54.5 Labour – employers and/or
own-account workers
(Digavfoal,a; Digavfoal, for Total)
61.4 1.8 2.0 6.4 2.6 6.3 7.5
Own assets
Capital
(Digavfoak,a;Digavfoak, for Total) 22.2 44.8 45.0 47.1 54.4 13.7 38.0
Total 100.0 100.0 100.0 100.0 100.0 100.0 100.0
Source: Table 3.
Table 7. Distribution of gross added value, at factor cost, generated by labour by the level of education of workers and activity, in the Portuguese SAM for 1995 (in percentage terms).
a1 a2 a3 a4 a5 a6 Total
low education level 72.5 55.2 86.7 58.9 34.2 33.1 48.3 medium education
level 24.4 33.6 5.6 27.9 34.8 40.9 33.0
high education level 3.1 11.2 7.8 13.2 31.0 26.0 18.7 Employees
with (Digavflefle,a; Digavflefle , for
(row) Total) Total 100.0 100.0 100.0 100.0 100.0 100.0 100.0 low education level 61.8 59.3 89.0 60.3 25.3 40.1 55.7 medium education
level 35.8 25.5 4.5 23.8 38.5 41.3 33.3
high education level 2.5 15.2 6.5 15.8 36.2 18.6 11.0 Employers and/or own-account workers with (Digavfoalfoal,a; Digavfoalfoal,
for (row) Total) Total 100.0 100.0 100.0 100.0 100.0 100.0 100.0 Source: Table 3.
Key to activities:
a1 – agriculture, hunting and forestry; fishing and operation of fish hatcheries and fish farms;
a2 – industry, including energy;
a3 – construction;
a4 – wholesale and retail trade, repair of motor vehicles and household goods, hotels and restaurants; transport and communications;
a5 – financial, real estate, renting and business activities;
A SAM-based model, constructed from the SNA, to be used for studying the distributional impacts of government policies in Portugal. S. Santos
Thus, wages and salaries, or the compensation of labour received by employees, represent 54.5% of generated income, whereas the compensation of labour received by the employers and/or own-account workers represents 7.5%. Within these two parts of generated income, almost half (48.3%), in the first case and more than half (55.7%), in the second case, is received by workers with a low education level while, in both cases, workers with a medium education level receive 33.3% and those with a high education level receive the remainder. Capital, therefore, represents 38% of generated income. This general structure is the result of a relative heterogeneity in the distributions (of generated income) among activities. The group of activities of “agriculture, hunting and forestry; fishing and operation of fish hatcheries and fish farms” (a1) is the one that contributes most to that heterogeneity, with wages and salaries representing only 16.4% and the compensation of labour received by employers and/or own-account workers representing 61.4% – resulting in one of the lowest shares for the compensation of capital (22.2%, after the other service activities – group a6 – with 13.7%). This group of activities also has one of the highest shares of workers with a low education level (employees – 72.5% – and employers and/or own-account workers – 61.8%, after construction – group a3 – with 86.9% and 89%, respectively).
A.2. Among institutions and socioeconomic groups, within households
By excluding from the gross added value at factor cost generated in the domestic economy the compensation of the factors of production sent to the rest of the world, and by including the compensation of the factors of production received from the rest of the world (in accordance with equation (3.17)), the gross national income is obtained and its institutional distribution can be studied.
Dignidic = (GNIdic / GNI) *100 (5.11)
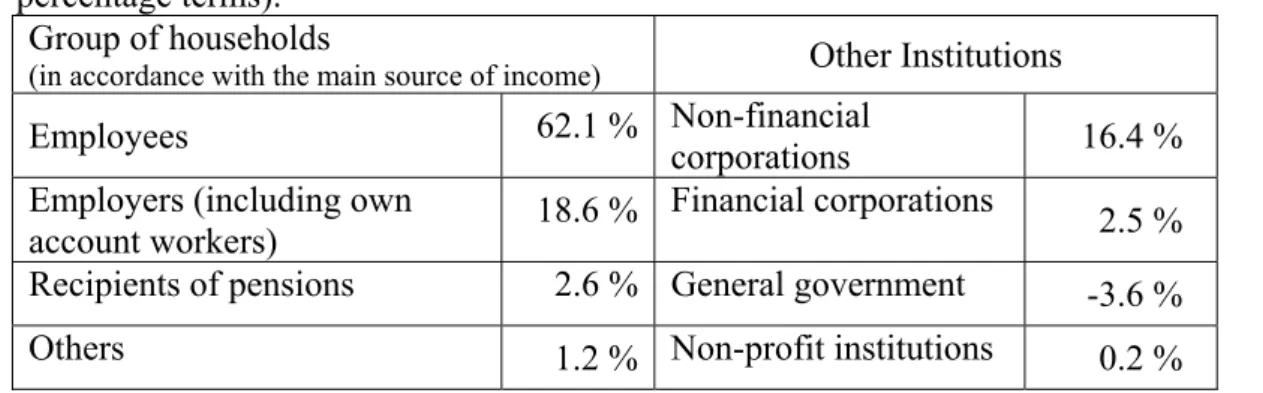
Table 8. Distribution of gross national income, at factor cost, among institutions and socioeconomic groups, within households, in the Portuguese SAM for 1995 (in percentage terms).
Group of households
(in accordance with the main source of income) Other Institutions
Employees 62.1 % Non-financial corporations 16.4 % Employers (including own
account workers) 18.6 % Financial corporations 2.5 % Recipients of pensions 2.6 % General government -3.6 %
A SAM-based model, constructed from the SNA, to be used for studying the distributional impacts of government policies in Portugal. S. Santos
serving households
Total (households) 84.5 % Total (all Institutions) 100.0 % Source: Table 3.
As a result of what was seen with regard to the position of the compensation of labour in generated income, households receive 84.5% of gross national income, with 62.1% corresponding to the group whose main source of income is wages and salaries (employees). Non-financial corporations receive 16.4%, with the remainder being distributed amongst the other institutions and with the general government recording a negative share.
B. Distribution and use of disposable income, among institutions and socioeconomic groups, within households.
By excluding from gross national income the current transfers paid to other institutions and to the rest of the world, and by including the current transfers received from the other institutions and from the rest of the world and, in the case of the government, the net indirect taxes (in accordance with equation (4.4)), the institutional distribution of gross disposable income can also be studied. In turn, the use made of gross disposable income is divided into final consumption and saving, although non-financial and financial corporations do not have any final consumption.
Dididic = (DIdic / DI) *100 (5.12)
UdiFCdic = (FCdic / DIdic) *100 (5.13)
UdiSdic = (Sdic / DIdic) *100 = 100 - UdiFCdic (5.14) From the numerical version:
Table 9. Distribution and use of disposable income, among institutions and socioeconomic groups, within households, in the Portuguese SAM for 1995 (in percentage terms). Use of Disposable Income Distribution of Disposable Income Final Consumption Saving Employees 41.9 98.2 1.8
Employers (including own
account workers) 16.1 52.4 47.6 Recipients of pensions 9.6 86.6 13.4 Others 1.8 108.0 - 8.0 Group of households (in accordance with the main source of
income) Total (households)
A SAM-based model, constructed from the SNA, to be used for studying the distributional impacts of government policies in Portugal. S. Santos
Use of Disposable Income Distribution of Disposable Income Final Consumption Saving Non-financial corporations 11.2 0.0 100.0 Financial corporations 1.9 0.0 100.0 General government 16.0 112.4 -12.4
Non-profit institutions serving households 1.7 92.8 7.2
Total 100.0 79.3 20.7
Source: Table 3.
Therefore, households have 69.3% of disposable income, with the group whose main source of income is wages and salaries (employees) having 41.9%. The general government has a share of 16% (similar to the group of households whose main source of income is the compensation of labour received by employers, including own account workers), while the share of non-financial corporations is 11.2%; the other shares are less significant. Except in the case of the non-financial and financial corporations, final consumption absorbs the most significant part of disposable income, even exceeding it in the case of both the general government and the group “others” amongst the households (those whose main source of income is not wages and salaries, mixed income including property income or income in connection with old age).
More specific and exact conclusions would require specification of the households’ composition – number of workers by household, size, age composition, dependency ratios, etc. (Dervis et al., 1982).
6. Experiments and scenarios with the distributional impact of budget policies
Considering the framework, assumptions and purposes of this version of the algebraic SAM, two experiments were carried out involving current transfers from/to households.
Because the intention was to study the distributional impacts of government policies, two scenarios were defined. The first scenario (scenario A) considered a 1% reduction in the direct tax rate (ti) paid by households to the government, while scenario B was based on a 1% increase in social benefits other than social transfers in kind (D62P) paid by the government to households.
A SAM-based model, constructed from the SNA, to be used for studying the distributional impacts of government policies in Portugal. S. Santos
With the help of Table 5 (and 3), it can be seen that in scenario A, the reduction in the current taxes on income, wealth, etc. will involve a leakage from the government’s main source of receipts (current transfers from households) and an injection (of receipts, resulting from the reduction in expenditure) into one item of the expenditure of households (current transfers to the government), although not the most important one. In turn, the increase in social benefits other than social transfers in kind, occurring in scenario B, will involve an injection into one source of the receipts of households (current transfers from government), although not the most important one, and a leakage (of receipts, resulting from the increase in expenditure) from the main item of government expenditure (current transfers to households).
The immediate purpose of these two experiments is to improve the financial situation of households.
Table 10 shows the base values and the corresponding relative importance of the flows that were subjected to the above-mentioned shocks.
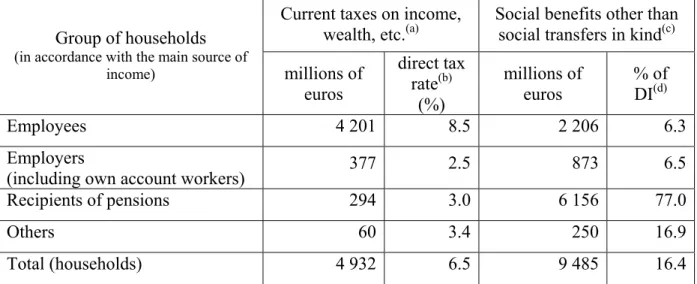
Table 10. Current taxes on income, wealth, etc. paid by households to the government and social benefits other than social transfers in kind paid by the government to households, in Portugal in 1995.
Current taxes on income, wealth, etc.(a)
Social benefits other than social transfers in kind(c) Group of households
(in accordance with the main source of
income) millions of euros direct tax rate(b) (%) millions of euros % of DI(d) Employees 4 201 8.5 2 206 6.3 Employers
(including own account workers) 377 2.5 873 6.5
Recipients of pensions 294 3.0 6 156 77.0
Others 60 3.4 250 16.9
Total (households) 4 932 6.5 9 485 16.4
Source: Instituto Nacional de Estatística (Portuguese National Accounts and Portuguese Pilot SAM - National Accounting Matrix, for 1995)
Notes:
(a) Transaction D5 of the National Accounts. See Section 2 for the methodology used in adjusting the total value to the values of the groups of households.
(b) Current taxes on income, wealth, etc. paid by households to the government, per unit of received aggregate income (ti).
(c) Transaction D62 of the National Accounts (D62P). See Section 2 for the methodology used in adjusting the total value to the values of the groups of households.