Sequential injection flow system with improved sample
throughput: determination of glycerol and ethanol in wines
Marcela A. Segundo, António O.S.S. Rangel
∗Escola Superior de Biotecnologia, Universidade Católica Portuguesa, Rua Dr. António Bernardino de Almeida, 4200-072 Porto, Portugal
Abstract
The performance of sequential injection (SI) systems has often been criticized for its low sampling frequency. The present work describes a SI system where an injection valve and an additional pump were incorporated to enhance sample throughput rate. The proposed system was applied to the enzymatic determination of glycerol and ethanol in wines, using spectrophotomet-ric detection and immobilized glycerol and alcohol dehydrogenases. The method proposed was applied to the determination of ethanol between 0.10 and 0.50% (v/v) and glycerol between 0.03 and 0.30 g l−1. These ranges were appropriate for determi-nation in table and port wines, since samples were diluted 50 times before introduction into the system. The results obtained from 15 wine samples were statistically comparable to those obtained by the reference methods, with good repeatability (R.S.D. < 3.4%, n = 10). The sampling rate was 22.5 h−1, corresponding to 45 determinations per hour. This way, the time required for each determination was decreased by 30% when compared to a conventional SI system. © 2002 Elsevier Science B.V. All rights reserved.
Keywords: Glycerol; Ethanol; Wine; Sequential injection; Glycerol dehydrogenase; Alcohol dehydrogenase; Port wine
1. Introduction
Since its introduction in 1990 by Ruzicka and Marshall [1], sequential injection analysis (SIA) has been successfully applied to perform several determi-nations, some of them cumbersome, involving gas dif-fusion [2], dialysis [3], extraction or preconcentration [4]. Simplicity is one of the main features attributed to a SI system, conceived as a single manifold, composed of a single pump, one valve and a single channel [5]. Flexibility is another attribute of this sys-tem, as the same manifold can be adapted to perform different assays by changing parameters in the
con-∗Corresponding author. Tel.:+351-22-5580064;
fax:+351-22-5090351.
E-mail address: [email protected] (A.O.S.S. Rangel).
trolling software [4,6]. These two characteristics and reduction of reagent consumption make SIA an attrac-tive alternaattrac-tive to flow injection analysis (FIA) [7]. A lower sampling frequency is the major disadvantage of SIA when compared to other flow techniques [4,6]. In this work, a SIA system with an increased throughput rate is presented; this was achieved by coupling an injection valve and an additional pump. Injection valves have already been used in SIA sys-tems for different purposes. For instance, they were used to solve flowing-out problems in gas diffusion units [8,9] and they have been applied in systems where sequential injection-wetting film extraction were performed [10–13]. Recently, two injection valves were incorporated into a manifold for renew-able column packing and disposal, which was applied in sorbent extraction separations of radionuclides
Fig. 1. Injection valve configuration including two loops (a and b). The arrows indicate the flow direction. SV: selection valve; AP: auxiliary pump; D: detection system; W: waste; A, B: injection valve positions; a, b: loops.
[14]. The inclusion of an injection valve to enhance throughput has only been reported once, Guzman and Compton [15] used it to switch between a peristaltic and a piston pump to deliver solutions through the holding coil. Effective use of time was achieved when the system was cleaned up by use of the peristaltic pump while the piston pump was refilled.
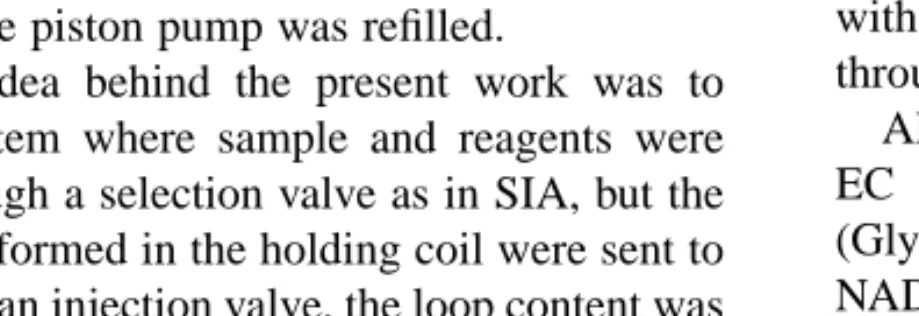
The main idea behind the present work was to develop a system where sample and reagents were aspirated through a selection valve as in SIA, but the stacked zones formed in the holding coil were sent to fill the loop of an injection valve, the loop content was then injected into a carrier stream and directed to the detector, as occurs in FIA. Therefore, the eight-port in-jection valve was incorporated in such a way that two loops were formed as depicted in Fig. 1. After sequen-tial aspiration of sample and reagent into the holding coil, the stacked zones were sent to one of the loops while the other was swept by carrier from an auxiliary pump, pushing its content to the detector. After switch-ing the position of the injection valve, the first loop content was flushed to the detector while the other loop was filled with another segment of sample and reagent. To demonstrate the feasibility of the proposed system, we applied it to the determination of glyc-erol and ethanol in wines. The method was based on the spectrophotometric determination of NADH at 340 nm after oxidation of glycerol and ethanol in
the presence of NAD+ by action of glycerol
dehy-drogenase and alcohol dehydehy-drogenase, respectively. This methodology was chosen for two reasons. First, as the reactions yield the same product, the same wavelength could be applied. Secondly, the enzymes could be immobilized, packed in a reactor and easily adapted to each loop of the injection valve.
2. Experimental section
2.1. Reagents and solutions
All chemicals used were of analytical reagent grade with no further purification, and deionized water
with a specific conductance<0.1 S cm−1 was used
throughout.
Alcohol dehydrogenase (ADH, 300 U mg−1,
EC 1.1.1.1, ref. 127540), glycerol dehydrogenase
(GlyDH, 25 U mg−1, EC 1.1.1.6, ref. 258555) and
NAD+ (grade III, 90%, ref. 710113) were purchased
from Boehringer (Manheim, Germany). Aminopropyl glass (average pore size: 500 Å; 200–400 mesh, ref. G-4643) was obtained from Sigma (St. Louis, MO).
For immobilization of enzymes, a 0.1 mol l−1
potassium dihydrogenphosphate buffer (pH 7.0) and a 2.5% glutaraldehyde solution (Merck, Schuchardt, Germany) in buffer were prepared.
For the flow system, the carbonate buffer carrier solution was prepared by dissolving 5.0 g of potas-sium hydrogencarbonate in 1 l of water and adjusting the pH to 9.5 by dropwise addition of concentrated potassium hydroxide solution. An aqueous solution of
20 mmol l−1NAD+was prepared daily.
Mixed standard solutions in the concentration
range 0.030–0.300 g l−1 glycerol and 0.100–0.500%
(v/v) ethanol were prepared from pure glycerol and ethanol. The wine samples were diluted 50-fold in water before introduction into the system.
2.2. Enzyme immobilization and reactor preparation
Suspended GlyDH (4.0 mg) and ADH (15 mg) were immobilized separately on 0.5 g of aminopropyl
derivatised controlled pore glass following the pro-cedure described by Masoom and Townshend [16] with some modifications [17]. The immobilized
en-zymes were stored wet in phosphate buffer at 4◦C in
a tightly closed tube and remained stable for about 2 months. The reactors were prepared by filling a piece of Gilson (Villiers-le-Bel, France) PVC pumping tube (i.d. 3.5 mm) using a syringe containing immobilized enzyme dispersed in phosphate buffer. Ordinary dish-washing foam was placed at both ends of the reactor to entrap the controlled pore glass. When not in use,
the reactors were kept at 4◦C in phosphate buffer at
pH 7.0.
2.3. Apparatus
Two Gilson Minipuls 3 peristaltic pumps, equipped with Gilson PVC pumping tubes propelled the so-lutions. One of the pumps was connected to the central channel of an eight-port electrically actuated selection valve (Valco VICI C25-3118E, Schenkon, Switzerland). The other pump was connected to one of the ports of an eight-port injection valve (Valco VICI C12-3118E).
A Unicam (Cambridge, UK) 8625 UV–VIS spec-trophotometer equipped with a Helma (Müllheim, Balden, Germany) 178.711QS flow-through cell
(in-ternal volume 30l) was used as the detection system
and the wavelength was set at 340 nm. The analytical
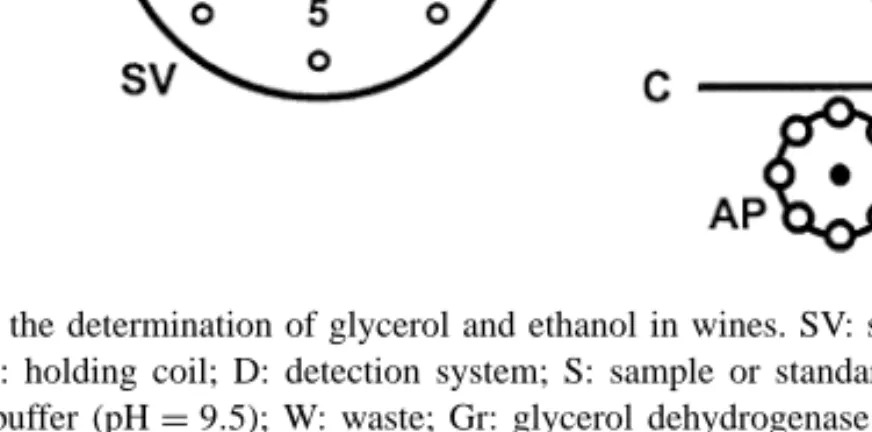
Fig. 2. Manifold for the determination of glycerol and ethanol in wines. SV: selection valve; IV: injection valve; PP: peristaltic pump; AP: auxiliary pump; HC: holding coil; D: detection system; S: sample or standard; NAD+= 20 mmol l−1 NAD+solution; C= 0.05 mol l−1 hydrogencarbonate buffer (pH= 9.5); W: waste; Gr: glycerol dehydrogenase reactor; Ar: alcohol dehydrogenase reactor.
signals were recorded in a Kipp and Zonen (Delft, The Netherlands) BD 111 strip chart recorder.
A 386 personal computer equipped with an Advantec (Taipei, Taiwan) PCL818L interface card, running software written in QuickBasic 4.5 (Micro-soft), controlled the position of the valves and both the direction and speed of rotation on the peristaltic pump connected to the selection valve.
For the reference ethanol determination, a distil-lation apparatus and a Denis Alcoholmeter (Arnou-ville, France) were used, as described for the usual methods of the OIV [18]. For the reference glycerol determination, the spectrophotometric mea-surements were carried out at 340 nm using the Unicam spectrophotometer.
2.4. Manifold and procedure
The system components were arranged as shown schematically in Fig. 2. The connections were made from Omnifit (Cambridge, UK) PTFE tubing (0.8 mm i.d.) with Gilson end-fittings and connectors. All con-nections were 20 cm long, except for the connection between the injection valve and detector (36 cm) and the tubing placed before the reactors. In this case, their length was 60 cm, three times longer than the tub-ing connecttub-ing the two valves. In this way, effective washing of this last connection was achieved as it was possible to send three times its volume through the
Table 1
Protocol sequence for determination of glycerol and ethanol in winesa
Selection valve Operation time (s) Injection valve
Position Description Position Description
1 Aspiration of 45l of NAD+solution 11.1 A Washing of ADH reactor
2 Aspiration of 45l of sample/standard solution 11.1 A Washing of ADH reactor
7 Propulsion of HC content towards the GlyDH loop 25.0 A Washing of ADH reactor
7 – 30.0 B Detection of glycerol peak
1 Aspiration of 15l of NAD+solution 3.7 B Washing of GlyDH reactor
2 Aspiration of 15l of sample/standard solution 3.7 B Washing of GlyDH reactor
7 Propulsion of HC content towards the ADH loop 30.0 B Washing of GlyDH reactor
7 – 30.0 A Detection of ethanol peak
aHC: holding coil.
two loops [6], without pushing the NAD+plus sample
segment to waste.
The protocol of flow and timing sequence for the determination of glycerol and ethanol in wines is listed in Table 1.
First, NAD+ and sample were sequentially
aspi-rated into the holding coil, after flow reversal, the stacked zones were sent through the loop where the GlyDH reactor was placed. During these operations, the loop containing the ADH reactor was continu-ously washed with carrier propelled by the auxiliary pump. Subsequently, the position of the injection valve was changed and the carrier from the auxiliary pump flowed through the GlyDH reactor, pushing the NADH formed towards the detector. After a certain period of time, the previous operations were repeated, but this time the stacked zones were sent to the ADH reactor, while the carrier from the auxiliary pump washed the GlyDH reactor. The position of the injec-tion valve was then switched, and the NADH formed in the ADH reactor was measured.
The flow rate used to aspirate both NAD+and
sam-ple/standards was 0.24 ml min−1. The other steps were
performed at 1.0 ml min−1.
2.5. Reference methods
The reference method for glycerol in wine was performed using the test kit “Glycerol UV method for the determination of glycerol in foodstuffs and other materials” from Boehringer (ref. 148270). The measurements were done after the procedure “Deter-mination of glycerol in wine” which is described in
the test kit package. Prior to the analysis, the samples were diluted 50-fold with deionized water. The refer-ence method for ethanol was performed by the usual hydrometric method of the OIV [18], based on the specific gravity of the wine distillate.
3. Results and discussion
3.1. Development of the sequential injection system
The following studies were performed using a ADH reactor 25 mm long and a GlyDH reactor 30 mm long, except when indicated otherwise.
3.1.1. Composition of carrier buffer
Both hydrogencarbonate concentration and pH value were evaluated. Hydrogencarbonate
concen-tration was varied between 0.005 and 0.2 mol l−1,
keeping the pH at 9.5. With the GlyDH reactor placed
in loop a (Fig. 1), 30l of 10 mmol l−1 NAD+ plus
the same amount of 0.500 g l−1 standard were
in-jected. Up to 0.050 mol l−1 HCO3−, the absorbance
increased, for higher concentrations, the values were about the same. Keeping the original
hydrogencar-bonate concentration at 0.050 mol l−1, the pH was
changed between 8.5 and 10.5. This study was per-formed separately for each reactor, placed in loop a. The same procedure was employed for the GlyDH reactor; for the ADH reactor, the volumes used were 15l of 10 mmol l−1 NAD+ plus 15l of 0.250% ethanol standard. As previously reported [19], the sig-nal increased with tested pH values for both enzymes.
However, when consecutive injections were per-formed at pH 10.0, placing reactor ADH in loop b and GlyDH in loop a, the signal from the GlyDH reactor decreased by 30% after 35 injections, indicating poor enzyme stability; the signal from the ADH reactor decreased by only 4%. As a compromise between en-zyme stability and sensitivity, the pH chosen was 9.5.
3.1.2. NAD+concentration
The NAD+ concentration was studied between
10 and 50 mmol l−1; the GlyDH reactor was placed
in loop a and the ADH reactor was placed in loop
b. For the glycerol determination, 30l of NAD+
plus 30l of 0.500 g l−1glycerol standard were
aspi-rated, for the ethanol determination, 15l of NAD+
plus 15l of 0.500% ethanol standard were used.
For the glycerol determination, the signals obtained
for NAD+ concentration of 10, 20 and 30 mmol l−1
were 57, 81 and 90% of the signal obtained for
the 50 mmol l−1 NAD+ solution, respectively. For
the ethanol determination, under the same condi-tions, the signals were 44, 68 and 83% of the signal
obtained for the 50 mmol l−1NAD+ solution. These
results indicated that the signal increased with NAD+
concentration and this effect was more pronounced in
the ethanol determination. Nevertheless, as NAD+is
a rather expensive reagent, the concentration chosen
was 20 mmol l−1to minimize its consumption.
3.1.3. Reactor placement in loops a and b
The flow direction was the same in loop a during loop filling and washing but, for loop b, it was re-versed as depicted in Fig. 1. To evaluate the possible difference between the two positions, the ADH
re-actor was placed in each loop, 15l of NAD+ and
15l of standard (concentrations between 0.050 and 0.750% in ethanol) were sent through both loops, for 25 s in loop a and 30 s in loop b. The signals obtained for loop b were about 40% of those obtained in loop a, probably owing to higher dispersion caused by the flow reversal occurred in loop b [8].
3.1.4. Glycerol determination
With the previous conditions set, the sensitivity for the glycerol determination was not satisfactory. To improve it, besides placing the GlyDH reactor in loop a, its length was increased to 40 and 50 mm. Better sensitivity was achieved for both reactors when
compared to the 30 mm reactor previously used, the length chosen was 40 mm. With the same objective,
the volumes were increased to 45l and then to
60l. Higher signals were obtained for both volumes but interference from the wine matrix was observed
when 60l was used. Hence, the volumes chosen for
NAD+and sample were 45l.
3.1.5. Ethanol determination
For this determination, the conditions previously de-scribed and the reactor placement in loop b provided the sensitivity and working range desired for the de-termination in wines, using the same dilution for both glycerol and ethanol determinations.
3.2. Evaluation of the method and its application to wine samples
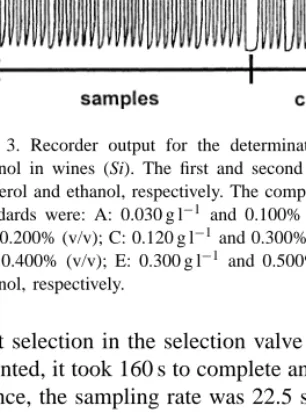
The performance of the proposed system for the de-termination of both glycerol and ethanol in wines was evaluated regarding to application range, detection limit, sampling frequency, accuracy and repeatability. A recorder output corresponding to the injection of a set of standards and wine samples is presented in Fig. 3.
Two log (absorbance) versus log (concentration) graphs were plotted, defining one concentration range for each determination. The standards concentration
varied between 0.030 and 0.300 g l−1of glycerol and
between 0.100 and 0.500% (v/v) of ethanol. These ranges were appropriate for determination in table and port wines, since its values multiplied by 50 yielded the values expected in such wines.
3.2.1. Detection limit
The detection limit was calculated as the con-centration corresponding to the blank signal plus three times the standard deviation of 10 consecutive blank injections [20]. The blank signal was obtained by replacing the standards with water. For glycerol determination, the calculated detection limit was
0.008 g l−1, for ethanol determination, the detection
limit was 0.005% (v/v).
3.2.2. Sample throughput
The time required for a complete analytical cycle is not merely the summation of the time required for each step performance. As the time spent for proper
Fig. 3. Recorder output for the determination of glycerol and ethanol in wines (Si). The first and second peaks correspond to glycerol and ethanol, respectively. The compositions of the mixed standards were: A: 0.030 g l−1 and 0.100% (v/v); B: 0.060 g l−1 and 0.200% (v/v); C: 0.120 g l−1and 0.300% (v/v); D: 0.210 g l−1 and 0.400% (v/v); E: 0.300 g l−1 and 0.500% (v/v) glycerol and ethanol, respectively.
port selection in the selection valve must also be ac-counted, it took 160 s to complete an analytical cycle. Hence, the sampling rate was 22.5 samples per hour, corresponding to 45 determinations per hour.
3.2.3. Comparison with the recommended procedure
In order to evaluate the accuracy of the proposed system, 15 samples of table and port wines were
an-alyzed. The results (Cp) were compared with those
furnished by the recommended procedures (Cr) [18];
they are presented in Table 2. The relative deviations between the recommended procedures and the
pro-posed methodology were<3.4% for the glycerol
de-termination and<3.7% for the ethanol determination.
For comparison purposes, a linear relationship (Cp = C0 + SCr) was established. The equation
parameters, as well as the 95% confidence limits, are
Table 2
Results obtained by the proposed methodology (Cp) and by the
reference methods (Cr) for the determination of glycerol (g l−1)
and ethanol percentage (v/v), and the R.D. (%) between the two methodsa
Sample Glycerol Ethanol
Cr Cp R.D. Cr Cp R.D. 1 5.67 5.76 1.6 8.97 9.30 3.7 2 5.77 5.80 0.5 10.4 10.4 0.0 3 5.14 5.15 0.2 10.3 10.4 1.0 4 6.17 6.17 0.0 10.9 10.5 −3.7 5 6.95 6.86 −1.3 11.5 11.6 0.9 6 6.64 6.48 −2.4 10.5 10.4 −1.0 7 5.47 5.63 2.9 19.0 19.6 3.2 8 5.16 5.29 2.5 19.7 19.9 1.0 9 4.67 4.67 0.0 19.5 19.4 −0.5 10 5.34 5.22 −2.2 19.8 19.9 0.5 11 5.81 5.79 −0.3 19.4 20.0 3.1 12 5.63 5.75 2.1 19.8 20.2 2.0 13 5.09 4.98 −2.2 19.6 18.9 −3.6 14 5.28 5.10 −3.4 18.4 18.1 −1.6 15 6.09 5.96 −2.1 19.5 18.8 −3.6
a1–3: White table wines; 4–6: red table wines; 7–15 port
wines.
presented in Table 3. From these figures it is clear that the estimated slope and intercept do not differ significantly from the values 1 and 0, respectively. Thus, there is no evidence for systematic differences between the two sets of results obtained by the pro-posed methodology and by the reference method, for both determinations [21].
Table 3
Parameters of the equationCp = C0+ SCr for comparing the
results obtained by the proposed methodology (Cp) and by the
reference methods (Cr), and the values for R.S.D. (%), (n = 10)
for wine samples
C0 S R.S.D.a Glycerol 0.267 (± 0.593)b 0.950 (± 0.104)b 1.6 (5.75) 1.6 (3.64) 1.1 (7.80) Ethanol 0.024 (± 0.870)b 0.999 (± 0.053)b 1.8 (20.2) 2.3 (18.9) 3.4 (11.1)
aMeasured for three wines, with the glycerol and ethanol
concentrations (g l−1 and percentage (v/v), respectively) given in parentheses.
3.2.4. Repeatability
This was estimated by calculating the R.S.D. of re-sults from 10 consecutive injections of wine samples.
R.S.D were <1.6% for the determination of glycerol
and<3.4% for the determination of ethanol (Table 3).
3.2.5. Enzyme reactor stability
The reactors were stable for about 2 weeks. During this time, 20 wine samples were analyzed, correspond-ing to more than 300 injections per reactor, includcorrespond-ing standard injections for system calibration.
4. Conclusions
The proposed system was able to simultaneously determine glycerol and ethanol in wines, with results comparable to those obtained by the reference meth-ods, good repeatability, minimum sample treatment
(dilution) and low NAD+ consumption. As several
ports of the selection valve are not used, on-line analysis could be implemented by connecting one of the ports to a bioreactor sampling line; the required sample dilution could also be performed in-line by coupling a mixing chamber to other available port.
Considering a conventional SIA system including a selection valve, a single pump, a holding coil connect-ing them and each enzymatic reactor placed in differ-ent ports of the selection valve, the operation steps to perform an analytical cycle would be, aspiration of
NAD+, aspiration of sample, peak detection and
re-actor washing. Taking into account the operation time values presented in Table 1, the analytical cycle would take 114 s for each determination. Comparing the time required for both determinations (228 s) with the value obtained for the proposed system, the time required for each determination has decreased about 30%. Hence, the operation mode described can be regarded as an effective means to enhance the sample throughput rate, despite the increase in the cost of the apparatus for including another pump and an injection valve.
Concerning the ethanol determination, a SI system for its determination using the same methodology was previously described and applied to fermentation
sam-ples [22]. The proposed system requires less NAD+
(0.3mol) for each ethanol determination when
com-pared to the previous system (0.5mol). Although the
former system had a higher sampling rate (26 h−1), it
took 140 s to perform only an ethanol determination against 160 s that our system requires to determine two different analytes.
It also should be emphasized that the proposed con-figuration is better when two different determinations are performed, one in each loop. As filling and wash-ing of loop a occurred in the same direction and, for loop b, these operations were performed in opposite directions, the two loops are not equivalent.
Acknowledgements
The authors acknowledge the financial support from PRAXIS XXI/Agência de Inovação through Project P076-P31B-09/97-INSIA. M. A. Segundo thanks FCT for the Grant PRAXIS XXI BD/13648/97. The kind interest and helpful advice received from Ildikó Tóth are highly appreciated.
References
[1] J. Ruzicka, G.D. Marshall, Anal. Chim. Acta 237 (1990) 329. [2] M.A. Segundo, A.O.S.S. Rangel, Anal. Chim. Acta 427
(2001) 279.
[3] A.N. Araújo, J.L.F.C. Lima, A.O.S.S. Rangel, M.A. Segundo, Talanta 52 (2000) 59.
[4] R.E. Taljaard, J.F. van Staden, Lab. Rob. Autom. 10 (1998) 325.
[5] T. Gübeli, G.D. Christian, J. Ruzicka, Anal. Chem. 63 (1991) 2407.
[6] J. Ruzicka, T. Gübeli, Anal. Chem. 63 (1991) 1680. [7] V. Cerdá, J.M. Estela, R. Forteza, A. Cladera, E. Becerra, P.
Altimira, P. Sitjar, Talanta 50 (1999) 695.
[8] M.T. Oms, A. Cerdà, A. Cladera, V. Cerdà, R. Forteza, Anal. Chim. Acta 318 (1996) 251.
[9] M.T. Oms, A. Cerdà, V. Cerdà, Electroanalysis 8 (1996) 387. [10] Y. Luo, R. Al-Othman, J. Ruzicka, G.D. Christian, Analyst
121 (1996) 601.
[11] S. Nakano, Y. Luo, D. Holman, J. Ruzicka, G.D. Christian, J. Flow Injection Anal. 13 (1996) 148.
[12] S. Nakano, Y. Luo, D.A. Holman, J. Ruzicka, G.D. Christian, Microchem. J. 55 (1997) 392.
[13] Y. Luo, S. Nakano, D.A. Holman, J. Ruzicka, G.D. Christian, Talanta 44 (1997) 1563.
[14] O. Egorov, M.J. O’Hara, J.W. Grate, J. Ruzicka, Anal. Chem. 71 (1999) 345.
[15] M. Guzman, B.J. Compton, Talanta 40 (1993) 1943. [16] M. Masoom, A. Townshend, Anal. Chim. Acta 166 (1984)
111.
[18] Office International de la Vigne et du Vin (OIV), Recueil des Méthodes Internationales d’Analyse des Vins et des Moûts, OIV, Bordeaux, 1990.
[19] I.L. Mattos, J.M. Fernandez-Romero, M.D. Luque de Castro, M. Valcárcel, Analyst 120 (1995) 179.
[20] International Union of Pure and Applied Chemistry (IUPAC) Anal. Chem. 48 (1976) 2294.
[21] J.C. Miller, J.N. Miller, Statistics for Analytical Chemistry, 3rd Edition, Ellis Horwood, Chichester, 1993 (Chapter 5). [22] M. Hedenfalk, B. Mattiasson, Anal. Lett. 29 (1996) 1109.