The Impact of Visual Advertising
Techniques on Consumers’ Purchase
Intention of a Chocolate Bar:
The Mediating Role of Taste
Perception
Sara Silva Simão
152118176
Dissertation written under the supervision of
Prof. Paulo Romeiro
Dissertation submitted in partial fulfilment of requirements for the MSc in
Management with Specialization in Strategic Marketing, at the Universidade
ii
ABSTRACT
The Impact of Visual Advertising Techniques on Consumers’ Purchase Intention of a Chocolate Bar: The Mediating Role of Taste Perception
Sara Silva Simão
Billions and billions of dollars are annually spent on advertisement. The Food Packaged Goods industry is no exception.
This is because advertising is a powerful weapon to influence the consumers’ purchase intention and taste perception. Complementarily, it is also known that taste is a key-attribute in food acquisition.
Albeit, food advertisement is mainly used to induce buying intentions and rarely attempts to affect taste perceptions.
But what if taste perception explains the relationship between consumer exposure to visual ads and their intention to purchase Food Packaged Goods? What if marketers can skew these taste perceptions through the usage of different advertising techniques?
This research sought to answer these questions using Endorsement and Sensory Marketing. Each of these practices had a Traditional advert (i.e. only presenting the product) serving as control.
Accordingly, seven pictorial adverts were created from the ground up based on three research procedures: Pre-Online Survey, Focus Group and Semi-Structured Interviews. Subsequently, the hypotheses were tested using a cross-sectional online questionnaire.
Findings suggest that taste perception largely mediates the relationship between visual advertising and purchase intention. Moreover, Sensory Marketing demonstrated to be extremely effective when deployed in adverts. On the other hand, Endorsement is surprisingly inadvisable since it achieved similar outcomes to Traditional advertising, or even inferior. Given this, it is believed that managers should invest on techniques that subtly influence consumers, going unnoticed as marketing intending to persuade.
The advertising world has been changing, and this research is proof of that.
Keywords: Visual Advertising, Taste Perception, Endorsement, Sensory Marketing, Olfactory Stimulation, Food Packaged Goods, Chocolate Bar
iii
SUMÁRIO
O Impacto de Técnicas de Publicidade Visual na Intenção de Compra de Barras de Chocolate pelos Consumidores: O Papel Mediador da Perceção de Sabor
Sara Silva Simão
Biliões e biliões de dólares são anualmente gastos em publicidade. Na indústria de produtos alimentares embalados não é exceção.
De facto, a publicidade é uma arma poderosa para influenciar intenções de compra e perceções de sabor. Complementarmente, também se sabe que o sabor é um atributo chave para a aquisição destes bens.
Todavia, a publicidade é maioritariamente utilizada para promover intenções de compra, invulgarmente tencionando afetar o sabor percebido.
Mas e se a perceção de sabor explicar a relação entre anúncios pictóricos e a intenção de adquirir produtos alimentares? E se os marketers puderem afetar essas perceções através da utilização de técnicas de publicidade?
Esta investigação visa responder a estas questões utilizando Endorsement e Marketing Sensorial. Cada uma destas práticas foi acompanhada por um anúncio Tradicional (isto é, apenas apresentando o produto) servindo como controlo.
Por conseguinte, sete anúncios foram criados tendo por base três estudos: Pré-Questionário Online, Grupo de Foco e Entrevistas Semi-Estruturadas.
Posteriormente, as hipóteses foram testadas através de um questionário online transversal. Os resultados revelaram que a perceção de sabor medeia consideravelmente a relação entre publicidade visual e a intenção de compra.
Ademais, a utilização de Marketing Sensorial em anúncios provou ser extremamente eficaz. Por outro lado, Endorsement demonstrou ser surpreendentemente desaconselhável visto alcançar semelhantes, ou até piores, resultados que publicidade Tradicional. Dado isto, acredita-se que os managers devem apostar em técnicas que influenciem os consumidores subtilmente, passando despercebidas como técnicas de marketing.
O mundo da publicidade está em transformação e esta pesquisa é a prova disso.
Palavras-Chave: Publicidade Visual, Perceção de Sabor, Endorsement, Marketing Sensorial, Estimulação Olfativa, Produtos Alimentares Embalados, Barra de Chocolate
iv
ACKNOWLEDGEMENTS
First of all, I would like to express my very great appreciation to my advisor, Professor Paulo Romeiro, for his guidance and support throughout the development of this research project. Thank you for your constant willingness to so generously invest your time. It was a real privilege to learn from you.
I would also like to express my deep gratitude to Professor Fernando Machado for all his valuable advice and assistance.
My appreciation extends to the professional photographer, Liliana Silva, and the image editor, João Paiva, who made it possible to transform my ideas into reality. I will surely never forget the hours you spent helping me creating the adverts. Undoubtedly, without you I would not be so proud of the final result.
I would also like to thank those who participated in my Focus Group (Adrian Geislinger, Beatriz Santos, Caroline Pülm, Jan Boge, Joana Dias, Johannes Schriefers, Kieran Genovese and Oriane Eymery), those that I interviewed (Anabela Zambaux, Emerson Kachiungo, Fátima Palma, Fernando Aguiar, Maria Luísa Bernal, Maria Simão, Michiel Wolf, Pedro Rodrigues, Rita Sousa and Violette Devergies), those who promptly accepted to be photographed (Sofia Borges and Chef Miguel Rodrigues) and all those who responded to the surveys. Your contribution was crucial to the findings of this research.
My heartfelt thanks to Patrícia Lopes, my friend and Master’s partner at Católica-Lisbon. You made this journey even better. I would also like to thank all of my amazing friends for the encouragement and support.
My special thanks to my partner in love, Artur Dias, who enthusiastically supports all the projects I am dedicated to.
I also have no words to express my gratitude to my wonderful family: Avó Henriqueta, Avó Lola, Avô José, Avô Vitor and Tia Duxa.
The best comes at the end, Mum and Dad, this dissertation is dedicated to you. I could not be more grateful to anyone. Thank you for your unconditional love and encouragement in pursuing my dreams!
“I would maintain that thanks are the highest form of thought, and that gratitude is happiness doubled by wonder”– Gilbert K. Chesterton
v TABLE OF CONTENTS ABSTRACT ... ii SUMÁRIO ... iii ACKNOWLEDGEMENTS ... iv TABLE OF CONTENTS ... v
TABLE OF FIGURES ... vii
TABLE OF TABLES ... viii
TABLE OF APPENDICES ... ix
GLOSSARY ... xi
CHAPTER 1: INTRODUCTION ... 1
1.1BACKGROUNDANDPROBLEMSTATEMENT ... 1
1.2RELEVANCE ... 2
1.3RESEARCHMETHODS ... 2
1.4DISSERTATIONOUTLINE ... 3
CHAPTER 2: LITERATURE REVIEW AND CONCEPTUAL FRAMEWORK ... 4
2.1ADVERTISING ... 4 2.1.1 ENDORSEMENT ... 5 2.1.2 SENSORY MARKETING ... 8 2.2PURCHASEINTENTION ... 10 2.3TASTEPERCEPTION ... 11 2.4CONCEPTUALFRAMEWORK ... 12 CHAPTER 3: METHODOLOGY ... 13 3.1RESEARCHAPPROACH ... 13 3.2SECONDARYDATA ... 14 3.3PRIMARYDATA ... 14 3.3.1 CATEGORY IDENTIFICATION ... 14 3.3.2 ENDORSERS SELECTION ... 17 3.3.3 STIMULI INTERPRETATION ... 19 3.3.4 MAIN STUDY ... 29
CHAPTER 4: RESULTS AND DISCUSSION ... 32
4.1DATA-PREPARATIONPROCESS ... 32
4.2SAMPLECHARACTERIZATION ... 33
vi
4.4RESULTSFROMTHEHYPOTHESESTESTING ... 34
4.4.1 ENDORSEMENT ... 35
4.4.2 SENSORY MARKETING ... 38
4.4.3 FULL-MODEL ... 39
4.4.4 FURTHER RESULTS ... 41
CHAPTER 5: CONCLUSIONS AND LIMITATIONS ... 43
5.1MAINFINDINGS&CONCLUSIONS ... 43
5.1.1 WHICH ENDORSEMENT TYPE IS THE MOST EFFICIENT? ... 44
5.1.2 AMONG ENDORSEMENT AND SENSORY MARKETING WHICH HAS THE STRONGEST EFFECT IN ADVERTISING? ... 45
5.1.3 DOES TASTE PERCEPTION EXPLAIN THE RELATIONSHIP BETWEEN VISUAL ADVERTISING TECHNIQUES AND THE CONSUMERS’ PURCHASE INTENTION? ... 46
5.2MANAGERIALIMPLICATIONS ... 47
5.3ACADEMICIMPLICATIONS ... 47
5.4LIMITATIONSANDFURTHERRESEARCH ... 48
5.4.1 ENDORSEMENT ... 49
5.4.2 SENSORY MARKETING ... 49
REFERENCE LIST ... I APPENDICES ... IX
vii
TABLE OF FIGURES
Figure 1: Conceptual Framework ... 12
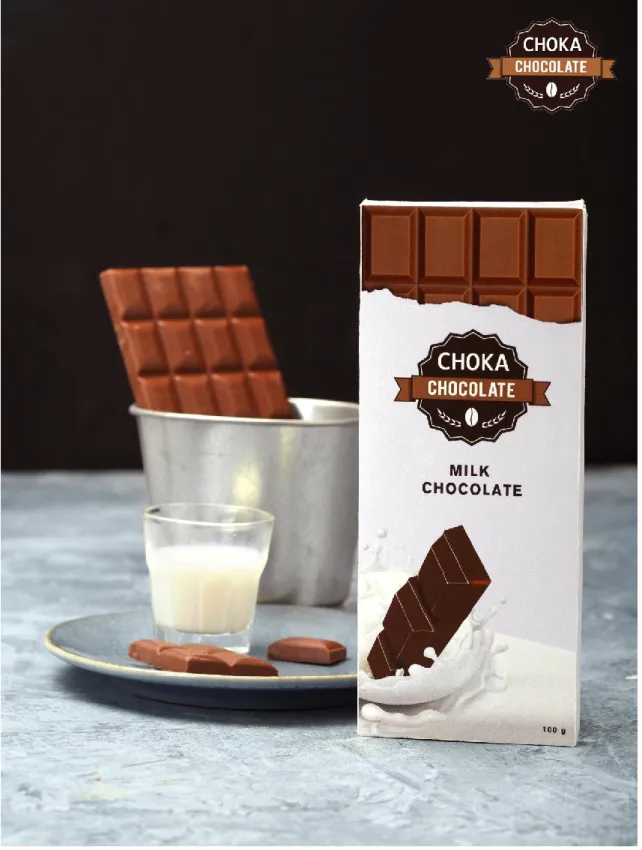
Figure 2: Choka Milk Chocolate Bar – Product Images ... 16
Figure 3: Q Score ... 18
Figure 4: Celebrity Expertise ... 18
Figure 5: Focus Group Results ... 19
Figure 6: Stimuli Scenarios ... 19
Figure 7: Endorsement – Celebrity Expert ... 20
Figure 8: Endorsement – Non-Celebrity Expert ... 21
Figure 9: Endorsement – Celebrity Non-Expert ... 22
Figure 10: Endorsement – Non-Celebrity Non-Expert ... 23
Figure 11: No Endorsement (Control Group) ... 24
Figure 12: Sensory Marketing – No Smell Stimulation (Control Group) ... 25
Figure 13: Sensory Marketing – Smell Stimulation (Version 1) ... 26
Figure 14: Sensory Marketing – Smell Stimulation (Version 2) ... 28
Figure 15: Model 4 – Mediation with a Multicategorical Independent Variable ... 31
Figure 16: Distribution of Valid Responses by Block ... 32
Figure 17: Statistical Model – Estimated Model Coefficients ... 41
Figure 18: Created Visual Stimuli ... 43
Figure 19: Research Question 1 – Conclusion ... 44
Figure 20: Research Question 2 – Conclusion ... 46
viii
TABLE OF TABLES
Table 1: Operational Model ... 30 Table 2: Cronbach’s Alphas ... 34
ix
TABLE OF APPENDICES
Appendix 1: Category Identification – Survey ... IX Appendix 2: Category Identification – Sample Characteristics (n=196) ... XII Appendix 3: Category Identification – Internal Consistency Reliability ... XIII Appendix 4: Category Identification – Taste Perception Mean by Food Product ... XIV Appendix 5: Focus Group – Participants Characterization ... XV Appendix 6: Focus Group – Discussion Guide ... XV Appendix 7: Focus Group – Results ... XVII Appendix 8: Interviews – Participants Characterization ... XVIII Appendix 9: Interviews – Script, Analysis and Results ... XVIII Appendix 10: Main Study – Survey ... XX Appendix 11: Main Study – Sample Characteristics (n=629) ... XXIV Appendix 12: Main Study – Chocolate Type Preferences: Descriptive Statistics... XXVI Appendix 13: Main Study – Chocolate Type Preferences: Frequency Statistics ... XXVI Appendix 14: Main Study – Cronbach’s Alphas ... XXVI Appendix 15: Test of Normality – Kolmogorov-Smirnov ... XXVII Appendix 16: Main Study – Endorsement H1.a: Kruskal-Wallis H Test ... XXVII Appendix 17: Main Study – Endorsement H1.a: Pairwise Comparisons ... XXVII Appendix 18: Main Study – Endorsement H1.a: Descriptive Statistic ... XXVII Appendix 19: Main Study – Endorsement H1.b: Kruskal-Wallis H Test ... XXVIII Appendix 20: Main Study – Endorsement H1.b: Pairwise Comparisons ... XXVIII Appendix 21: Main Study – Endorsement H1.b: Descriptive Statistics ... XXVIII Appendix 22: Main Study – Endorsement H2.a: Descriptive Statistics ... XXVIII Appendix 23: Main Study – Endorsement H2.a: Ranks ... XXVIII Appendix 24: Main Study – Endorsement H2.a: Test Statistics ... XXIX Appendix 25: Main Study – Endorsement H2.b: Descriptive Statistics ... XXIX Appendix 26: Main Study – Endorsement H2.b: Ranks ... XXIX Appendix 27: Main Study – Endorsement H2.b: Test Statistics ... XXIX Appendix 28: Main Study – Endorsement H3.a: Descriptive Statistics ... XXIX Appendix 29: Main Study – Endorsement H3.a: Ranks ... XXX Appendix 30: Main Study – Endorsement H3.a: Test Statistics ... XXX Appendix 31: Main Study – Endorsement H3.b: Descriptive Statistics ... XXX Appendix 32: Main Study – Endorsement H3.b: Ranks ... XXX Appendix 33: Main Study – Endorsement H3.b: Test Statistics ... XXX Appendix 34: Main Study – Endorsement H4.a: Kruskal-Wallis H Test ... XXX Appendix 35: Main Study – Endorsement H4.a: Pairwise Comparisons ... XXXI
x Appendix 36: Main Study – Endorsement H4.a: Descriptive Statistics ... XXXI Appendix 37: Main Study – Endorsement H4.b: Kruskal-Wallis H Test ... XXXI Appendix 38: Main Study – Endorsement H4.b: Pairwise Comparisons ... XXXI Appendix 39: Main Study – Endorsement H4.b: Descriptive Statistics ... XXXII Appendix 40: Main Study – Sensory Marketing H5.a: Descriptive Statistics ... XXXII Appendix 41: Main Study – Sensory Marketing H5.a: Ranks ... XXXII Appendix 42: Main Study – Sensory Marketing H5.a: Test Statistics ... XXXII Appendix 43: Main Study – Sensory Marketing H5.b: Descriptive Statistics ... XXXII Appendix 44: Main Study – Sensory Marketing H5.b: Ranks ... XXXIII Appendix 45: Main Study – Sensory Marketing H5.b: Test Statistics ... XXXIII Appendix 46: Main Study – Mediation: Matrix Procedure ... XXXIII Appendix 47: Main Study – Mediation: Indicator Coding of Categorical X ... XXXV Appendix 48: Main Study – Mediation: Estimated Coefficients ... XXXV Appendix 49: Main Study – Further Results: Crosstabs (Gender*Milk Chocolate) ... XXXV Appendix 50: Main Study – Further Results: Chi-Square Tests (Gender*Milk Chocolate) ... XXXV Appendix 51: Main Study – Further Results: Symmetric Measures (Gender*Milk Chocolate) ...XXXVI Appendix 52: Main Study – Further Results: Crosstabs (Age*Milk Chocolate) ...XXXVI Appendix 53: Main Study – Further Results: Chi-Square Tests (Age*Milk Chocolate) ... XXXVII Appendix 54: Main Study – Further Results: Symmetric Measures (Age*Milk Chocolate) ... XXXVII Appendix 55: Main Study – Further Results: Chi-Square Tests (Education*Milk Chocolate) .. XXXVII Appendix 56: Main Study – Further Results: Chi-Square Tests (Income*Milk Chocolate) ... XXXVII Appendix 57: Main Study – Further Results: Spearman's Correlation ... XXXVIII
xi
GLOSSARY
1
CHAPTER 1: INTRODUCTION
1.1 Background and Problem Statement
The advertising world has changed. Long gone are the times when advertisers could only rely on mass media outlets.In this day and age, companies communicate more and more through online formats. The proof lies in the evolution of its definition. What began as “selling through print” (Starch, 1923) is nowadays well beyond that; it is about impacting people (Dahlen & Rosengren, 2016).
However, one aspect remains inalterable: advertising efficiency is of the utmost importance for marketing managers (Cheong, De Gregorio, & Kim, 2014) as it is considered an investment (Danaher & Rust, 1994). Indeed, billions and billions of dollars are spent in advertisement. The Food Packaged Goods industry is no exception. To give a sense, the forecasts for the year 2020 predicted an expense of 5,37 billion U.S. dollars advertising food in the United States alone (Statista, 2019).
In fact, these campaigns are a powerful weapon to influence companies’ sales revenues (Harlan E. Spotts, Marc G. Weinberger, 2019), as they affect both the consumers’ intent to purchase and their judgements about product quality (Mela, Gupta, & Lehmann, 1997).
It is also known that taste perception, which is conceptually related to quality (Elder & Krishna, 2010), is considered a key driver for consumers’ intention to buy FPG (Glanz, Basil, Maibach, Goldberg, & Snyder, 1997; Jo & Lusk, 2018; Tepper & Trail, 1998).
Despite food advertisement being mainly used to induce buying intentions, it rarely tries to influence taste perceptions (Elder & Krishna, 2010).
But what if taste perception explains the relationship between consumer exposure to ads and the intention to purchase FPG? What if managers can skew these taste perceptions through the usage of different advertising techniques?
This investigation aims at exploring whether visual advertising techniques – Endorsement and Sensory Marketing – exert their effect on consumers’ purchase intention through taste perceptions.
In more detail, it discusses the role of Endorsement and Sensory Marketing in driving advertisement efficiency. In regard to Endorsement, the study is based on a 2 (Celebrity: Yes, No) * 2 (Expert: Yes, No) matrix. As for Sensory Marketing, only the olfactory stimulation is addressed, given the pure pictorial advertising context of this study.
2
In summary, the problem statement can be defined as:
How does taste perception impact the relationship between food visual advertising techniques and the consumers’ purchase intention?
The research questions framed to solve the above problem statement are the following: RQ1: Which Endorsement type is the most efficient?
RQ2: Among Endorsement and Sensory Marketing, which has the strongest effect in advertising?
RQ3: Does taste perception explain the relationship between visual advertising techniques and the consumers’ purchase intention?
1.2 Relevance
The impact of diverse advertising techniques on purchase intention is broadly explored in literature. Simultaneously, it has been shown that taste perception is a key-factor in consumers’ desire to purchase FPG. However, there is a profound lack of investigation about the taste perception role in the efficiency of FPG advertising campaigns.
If the main hypothesis of this study is confirmed, managers must radically change their focus and start to develop ads to affect taste perceptions. This issue is of the utmost relevance in an industry with such a high ad expenditure as this.
Moreover, academic literature rarely compares the efficiency of different advertising techniques, which is crucial in obtaining actionable managerial recommendations. For this reason, this research compares Endorsement and Sensory Marketing techniques.
In terms of Sensory Marketing, little attention has been paid to the influence of olfactory inputs on consumer decision-making. Simultaneously, scholars request research addressing sensory perceptions in a purely visual advertising context (Elder & Krishna, 2012). Consequently, this research ventures out in a little-explored field of research.
Moreover, some recommendations might be extended to restaurant ads, thereby enlarging the relevance sphere of this dissertation.
In brief, the aim of this study is to shed a new light on food advertisement efficiency. 1.3 Research Methods
With the goal of solving the research problem at hand, both secondary and primary data will be gathered. The preliminary step will be to critically review the existing literature to date, in the form of secondary data, so that studied relationships between the underlying variables are
3
identified. This will pave the way to generating hypotheses and further on analyzing the primary data results. Subsequently, the model will have to bloom from a conceptual to an operational level. In order to successfully accomplish this transition, four primary data studies will be carried out. Firstly, an online survey will be used to choose the most proper food category for pursuing this investigation. Secondly, a focus group will be conducted for the selection of the most appropriate Celebrity endorsers to be employed in the main study. In the light of these results, the visual stimuli will be developed from the ground up. Thirdly, to ensure these ads will convey the desired messages, semi-structured interviews will be conducted. Lastly, to test the hypotheses, a cross-sectional questionnaire with a built-in experimental design will be employed. It will be distributed via the Internet to simulate a virtual advertising context. Respondents will be randomly assigned to one of seven groups, each corresponding to one of the visual advertising stimuli created:
a) Endorsement – Celebrity Expert, Celebrity Expert, Celebrity Expert, Non-Celebrity Non-Expert and No Endorser (serving as control group)
b) Sensory Marketing - Smell Stimulation and No Smell Stimulation (serving as control group)
Furthermore, this questionnaire includes sections to assess: (1) respondents’ consumption and buying behavior, (2) their preferences within the food category (3) their perceptions about the taste of the advertised product, (4) the inherent intention to purchase it, (5) and their demographic characteristics.
1.4 Dissertation Outline
The present dissertation is divided into five chapters. The following chapter is vital to the development of the hypotheses underlying this investigation, since it presents a literature review that comprises a critical analysis at the existing academic knowledge regarding advertising, including Endorsement and Sensory Marketing, purchase intention and taste perception. The third chapter aims at providing a detailed description of the methodology for carrying out this investigation. In order to enable one to replicate this project, every study is extensively described, including immanent specifications about how data is collected, measured and analyzed. Here the results from the pre-survey, focus group and interviews are presented. The purpose of the fourth chapter is to present the results originated from the explanatory study, specifying how data should be interpreted. The fifth and final chapter consists of a conclusion that comprises the main discoveries in the light of the literature review, managerial and academic implications from this research, limitations and proposals for further research.
4
CHAPTER 2: LITERATURE REVIEW AND CONCEPTUAL FRAMEWORK
This chapter consists of a theoretical framework on the themes under investigation. Here, the existing knowledge about the research topics is summarized, compared and critically analyzed, providing a basis to formulate hypotheses.
Firstly, the concept of advertising is addressed and subdivided into Endorsement and Sensory Marketing techniques. Subsequently, purchase intention literature is discussed, followed by taste perception.
Lastly, the conceptual framework is presented, providing a big picture of the proposed relationships between variables and the inherent hypotheses.
2.1 Advertising
Gone are the days when advertising had one single and consensual definition. The first recognized conceptualization of the term was created in 1923 by Daniel Starch, for whom advertising was “selling through print” (Richards & Curran, 2002). Albeit basic, it was aligned with the exclusive media format accessible at the time (Dahlen & Rosengren, 2016).
As time went by, literature was divided into two mainstream currents of thought, based on whether the purpose of research was to define the word or to understand how ads affect consumers. Concerning the first current, by the end of the 20th century, several definitions were emerging, with the same roots: (1) paid, (2) non-personal communication, (3) known sponsor, (4) mass media format and (5) persuasion/influence (Richards & Curran, 2002). Simultaneously and in contrast, academic journals studying advertising hierarchy of effects deemed ads as an input for generating a response from consumers (Vakratsas & Ambler, 1999).
An undeniable fact for both literature approaches is that technology and media progress trigger the evolution of advertising, and that is the reason why definitions and ad effects need to be constantly updated (Kerr & Schultz, 2010). Thus, instead of the technological developments having murdered advertisement as predicted (Rust & Oliver, 1994), they fostered its expansion (Dahlen & Rosengren, 2016).
As a result of these advances, Richards and Curran (2002) defined it as “a paid, mediated form of communication from an identifiable source, designed to persuade the receiver to take some action, now or in the future”.
However, over time, three dynamics were evolving in the real-world of advertising business: (1) novel media and formats, (2) changes in consumer behavior and (3) prolonged ad effects (Laczniak, 2016). To integrate these elements, advertising was re-conceptualized as a communication started by a brand with the purpose of impacting people (Dahlen & Rosengren,
5
2016). This definition follows a marketing scholar’s mindset, considering paid and mediated too restrictive to approach advertising research (Dahlen & Rosengren, 2016).
Contrarily, there is a mass communication mindset for which the new conceptualization is not appropriate, since advertising should be differentiated from other communication types (Huh, 2016). Therefore, the working definition was criticized for being too vast (Stewart, 2016) and over-inclusive (Huh, 2016), in such a way that it no longer sounds like advertising (Rust, 2016). Nonetheless, simultaneously, some consider that it clearly distinguishes what is and is not advertising (Eisend, 2016).
Despite this unconformity, research segments advertising into visual and verbal (Hirschman, 1986; Mitchell, 1986) or into copy and executional elements (David A. Aaker, 1993). The visual component is characterized by being processed more unconsciously and automatically than verbal elements (Elder & Krishna, 2010).
2.1.1 Endorsement
Endorsement is a widespread advertising technique (Kamins, 1990) used to promote products and services (Halonen-Knight & Hurmerinta, 2010) with the aim of influencing consumer behavior (Dean, 1999). In fact, it can affect purchase intentions, product evaluations (Coelho do Vale & Verga Matos, 2017), brand attitudes, attitudes towards ads (Amos, Holmes, & Strutton, 2008), message recalls (Friedman & Friedman, 1979), brand recognition (Petty, Cacioppo, & Schumann, 1983) or even risk perceptions (Biswas, Biswas, & Das, 2006). For this reason, literature has invoked several explanations for its efficiency, such as the Meaning Transfer Model, Source Model Theory, Match-Up Hypothesis and Processes of Identification versus Internalization.
Endorsement, regardless of type, was demonstrated to be more effective than Traditional advertising (i.e. without Endorsement) (Friedman, Termini, & Washington, 1976), inducing both purchase intention and taste perception. But there are different types of endorsers (e.g. Celebrity, Expert and Typical Consumers (Fireworker & Friedman, 1977)), and its choice should lie in the campaign’s objective, the endorser themselves (Friedman & Friedman, 1979) and company related factors (Coelho do Vale & Verga Matos, 2017). This research is based on a matrix with endorser familiarity and expertise factors and, therefore, four types of endorsers are examined: Celebrity Expert, Celebrity Expert, Celebrity Expert and Non-Celebrity Non-Expert (i.e. Typical Consumer).
6
2.1.1.1 Celebrity Non-Expert Endorsement
Celebrity Non-Experts are public figures who benefit from their recognition to appear with advertised products (McCracken, 1989). These individuals are famous due to their achievements in other areas than that of the advertised product category (Friedman et al., 1976). Celebrity advertisement can impact consumers through an identification process (Biswas et al., 2006). This is a process of social influence which occurs when people try to embody the endorser’s identity by adopting their beliefs and actions (Kelman, 1961). This is also related with The Meaning Transfer Model, in which Celebrities convey their symbolic characteristics and inherent meanings (Erdogan, 1999) to endorsed products which, in turn, transfer these meanings, values or qualities to consumers (McCracken, 1989).
For this reason, the associations transferred by Celebrities are more powerful and profound than those from Non-Celebrities (McCracken, 1989). Even though, Celebrities are not always more effective (Biswas et al., 2006) since research suggests that it depends upon several factors, such as the product category being endorsed.
2.1.1.2 Celebrity Expert Endorsement
Some Celebrities have come to be known to the public due to successful achievements in the advertised product area (Frieden, 1984), being considered Celebrity Experts. To be effective, their knowledge does not need to be realistic, but rather only be perceived as so by the audience (Erdogan, 1999; Ohanian, 1991).
Considering the Source-Effects Theory, expertise was found to be the third highest influential source on the effectiveness of Celebrity Endorsement (Amos et al., 2008). Indeed, the more of an Expert a Celebrity is considered to be, the more likely they are to induce greater intentions to buy (Ohanian, 1991) and to enhance quality perceptions of a product (Erdogan, 1999). On the other hand, this expertise can also be approached in the light of the Match-Up Hypothesis (Till & Busler, 2000). Accordingly, a high fit between the Celebrity and the advertised product, driven by expertise, would improve a campaign’s effectiveness.
2.1.1.3 Non-Celebrity Expert Endorsement
Non-Celebrity Experts are anonymous individuals or groups of specialists in the advertised product category (Friedman & Friedman, 1979), with an above-average knowledge level in that field (Rossiter & Smidts, 2012) acquired through training or education (Friedman et al., 1976). Their effectiveness accrues from consumers perceiving these endorsers’ as sources of valid information (Tedeschi, 1972), and therefore being persuaded through an internalization process
7
(Biswas et al., 2006). This means that individuals can be influenced by Expert endorsers when their recommendations seem suitable to solve a problem (Kelman, 1961).
However, this process occurrence is, to a great extent, contingent on the advertised product. For non-durable products, which is the case of FPG, Celebrity Non-Expert Endorsement is likely to be more effective than Non-Celebrity Expert. This is due to the fact that those goods commonly require low involvement levels with the purchase and consumers just process the content of their adverts peripherally (Biswas et al., 2006; Kelman, 1961; Petty et al., 1983). Therefore, in FPG, the identification process would be more effective than the internalization (Kelman, 1961).
2.1.1.4 Non-Celebrity Non-Expert Endorsement
Non-Celebrity Non-Expert endorsers commonly represent the Typical Consumers of the endorsed product. They are ordinary individuals whose knowledge of the product category is derived from repeated use (Friedman et al., 1976).
Their effectiveness lies in their appeal of similarity, and both processes of identification and internalization are expected to occur (Friedman & Friedman, 1979). This is because consumers feel similar, and therefore identify, with these endorsers while simultaneously endow them with a certain degree of expertise. Furthermore, it was found that this type is the most effective for food Endorsement, generating higher purchase intentions and better attitudes towards the product (Friedman & Friedman, 1979).
Based on Endorsement literature, the following hypotheses are derived:
H1.a: Endorser Advertising has a higher impact on taste perception than No Endoresment Advertising
H1.b: Endorser Advertising has a higher impact on purchase intention than No Endoresment Advertising
H2.a: Celebrity Expert Endorser Advertising has a higher impact on taste perception than Celebrity Non-Expert Endorser Advertising
H2.b: Celebrity Expert Endorser Advertising has a higher impact on purchase intention than Celebrity Non-Expert Endorser Advertising
H3.a: Celebrity Non-Expert Endorser Advertising has a higher impact on taste perception than Non-Celebrity Expert Endorser Advertising
8 H3.b: Celebrity Non-Expert Endorser Advertising has a higher impact on purchase intention than Non-Celebrity Expert Endorser Advertising
H4.a Non-Celebrity Non-Expert Endorser Advertising has the highest impact on taste perception
H4.b Non-Celebrity Non-Expert Endorser Advertising has the highest impact on purchase intention
2.1.2 Sensory Marketing
Sensory Marketing is defined as “marketing that engages the consumers' senses and affects their perception, judgment and behavior” (Krishna, 2012).
It is common knowledge that there are five senses (vision, smell, taste, hearing and touch) which capture external stimuli through sensory receptors (eye, nose, mouth, ear and skin, respectively) (Mather, 2016), producing a neural and instantaneous response (i.e. sensation) that is posteriorly understood through the perception process (Coelho do Vale, 2018; Krishna, 2012; Mather, 2016).
Sensory cues can be provided in advertisement (Coelho do Vale, 2018; Krishna, Cian, & Sokolova, 2016) and they are effective because they constitute non-explicit guidelines about a product attribute (Sengupta & Gorn, 2002), going unnoticed as marketing techniques, and consequently not being approached with the typical blocking effect of the audience to campaigns (Jones, 2015). Hence, food companies can strategically enhance the sensory nature of their products through ads (Bublitz, Peracchio, & Block, 2010), as they have the potential to modify taste perception both before (Elder & Krishna, 2010) and after (Braun, 1999) actual food consumption. Unfortunately, though, the majority of food manufactures do not take advantage of this opportunity since commercials rarely try to influence the taste perception of products (Elder & Krishna, 2010). Nevertheless, some companies are beginning to understand the potential of ads stimulating senses (Krishna, 2012) and their ability to arouse expectations about food taste and aroma (Dianoux, Petrovici, & Minondo, 2013).
This study sought to understand if Sensory Marketing can drive advertising effectiveness, in a purely visual context, and thus Olfactory Stimulation is the scope of the research. Given that, the following subchapter is focused on how sight and smell interact with taste.
9
2.1.2.1 Interaction of Senses
It is crystal clear that gustatory cells in the tongue can distinguish five elements: saltiness, bitterness, sweetness, sourness and umami (Ikeda, 2002). However, taste counts on more than just the tongue, since it is resultant from the blending of all five senses (Ackerman, 1990). In regard to sight, which is generally the sense responsible for creating the first impression to prospects (Yang & Chen, 2015), pictures with food do not just stimulate visual brain zones as they also trigger gustatory cerebrum areas which suggest the inherent taste (Simmons, Martin, & Barsalou, 2005).
As for scent, the connection between taste-scent for familiar products is so powerful that it becomes difficult to disassociate them (Krishna, 2013; Rozin, 1982).
Some studies suggest that one can imagine odors because scents are retrieved in memory based on prior experiences. Accordingly, it was found that the desire to eat increases if consumers are presented with pictures of food, accompanied by a verbal request for them to imagine the inherent scent (Krishna, Morrin, & Sayin, 2014).
Scarce is the literature where the interaction of senses has been addressed (Krishna, 2012). Nonetheless, it is known that advertising claims that appeal to multi-senses improve the taste perception of a product when compared to ad copies that exclusively mention taste (Elder & Krishna, 2010). But for these interactions to happen, consumer knowledge about the product is essential for them to be able to imagine taste and smell only from visual sensory input (Schlosser, 2003).
Adding to the previous literature the premise that tastier food items generate a greater buying intention (Jo & Lusk, 2018), the following hypothesis are proposed:
H5.a: Smell Stimulation Advertising has a higher impact on taste perception than No Smell Stimulation Advertising
H5.b: Smell Stimulation Advertising has a higher impact on purchase intention than No Smell Stimulation Advertising
H6: Sensory Marketing has a higher impact on both taste perception and purchase intention than Endorsement in Advertising
10
2.2 Purchase Intention
Purchase intention mirrors consumers’ predictions about their own buying actions (Schlosser, 2003). These prognosis may be based on customers imagining themselves using the product, which in turn will be dependent on how they perceive its quality (Chang & Wildt, 1994; Schlosser, 2003).
Thus, purchase intention is an essential concept in marketing (Morrison, 1979) as marketers use this metric for evaluating consumers’ willingness to acquire (Kotler & Keller, 2012) both pre and post-launch products (Morwitz, Steckel, & Gupta, 2007).
Due to its capability to predict actual purchases (Chang & Wildt, 1994; Jamieson & Bass, 1989), this measure is commonly used to forecast sales as well as to support a wide range of managerial decisions (Armstrong, Morwitz, & Kumar, 2000).
The food industry is no exception, given that purchase intention is considered an indicator to anticipate the success of new food products releases (Kytö, Virtanen, & Mustonen, 2019). However, the majority of these products flop during the first year of their lives (Nielsen, 2014). In line with this, some authors argue that for packaged goods, purchase intentions are less powerfully correlated with actual buying behaviors when compared to durable goods (Morwitz et al., 2007; Wright & Macrae, 2007) because of the different levels of effort required in the decision-making process (Manohar U. Kalwani, 1982). Additionally, the tendency of consumers to seek variety in low involvement product categories, such as food (Kotler & Armstrong, 2013), may be considered a hindrance for them to accurately predict their real behavior (Inman, 2001; Morwitz et al., 2007).
Furthermore, purchase intention presupposes that actions are rational, although it is known that consumers can behave with little-conscious effort (Lindström, 2010).
In contrast, Kytö et al. (2019) stated that when purchase intention is based on the consumers’ perception and expectation about a Food Packaged Good, it is a significant measure in forecasting buying behavior.
In turn, adverts can stimulate purchase intention (David A. Aaker, 1993) which is a classical indicator of advertising effectiveness (Poels & Dewitte, 2006). Having said that, the wideness of literature where the relationship between ads and purchase intention is studied is not surprising.
Albeit the mentioned constraints, this measure is broadly used by marketing scholars as a proxy for actual buying decisions.
11
Thus, for the purpose of the present dissertation, purchase intention is considered to be a measure able to explore the effectiveness of visual advertising techniques as well as a significant predictor of consumers’ purchase behavior.
2.3 Taste Perception
Nowadays, food decision-making can be mostly grounded on healthiness and taste perceptions (Bublitz et al., 2010). Regarding the latter, Jo & Lusk (2018) stated that it positively affects consumers’ desire to purchase a product and other authors even go so far as considering taste the most relevant variable on food choices (Glanz et al., 1997; Tepper & Trail, 1998). Moreover, when consumers are looking for variety, food sensory attributes such as taste underlie their buying decisions (Inman, 2001). This dissertation focuses its scope on unhealthy and appetizing food packaged goods, so, conceptually, it seems plausible to consider taste perception - which comprises perceived quality, deliciousness and taste (Elder & Krishna, 2010) - the core benefit sought by consumers.
In regard to the formation of taste perception, one can straightforwardly expect that it counts on food intrinsic cues, although it can also rely on less evident hints as advertising (Elder & Krishna, 2010; Krishna, 2012), which in turn can affect consumer opinions about a product. Furthermore, in literature, some scholars studied taste perception processed in a cognitive context, which is characterized for a higher conscious level in the formation of perceptions (e.g. Elder & Krishna, 2010; Hoegg & Alba, 2007), while others use a more automatic and less deliberated approach (e.g. Raghunathan, Naylor, & Hoyer, 2006).
In the present research, a more automatic mechanism is implied to occur, since visual ads - without the verbal component - stimulate audience mainly below-consciousness (Elder & Krishna, 2010).
Therefore, prior literature review leads to the formulation of the subsequent hypothesis: H7: Taste perception mediates the effect of visual advertising techniques on purchase intention
12
2.4 Conceptual Framework
The following illustration summarily structures the relationships between variables and the inherent hypotheses under research:
13
CHAPTER 3: METHODOLOGY
The present chapter aims to expose how the research questions and above-mentioned hypothesis should be answered. Firstly, it is discussed the research approach used while conducting this study. Then, the secondary data topic is covered, followed by a detailed description of the primary data used. The primary data sub-chapter is chronologically organized considering the four studies conducted and includes immanent specifications about how data is collected, measured and analyzed.
3.1 Research Approach
For this stage, it is vital to have in mind that the ultimate goal of this dissertation is to expand the knowledge in the advertising effectiveness field, exploring how two different visual techniques can be effectively used to achieve sales objectives of a campaign and, more importantly, to discover the intrinsic nature of this interaction through the consideration of taste perception as the potential responsible agent.
To clearly define the research problem and find relationships between the underlying variables, the preliminary step was to critically review the existing literature to date, in the form of secondary data. As shown in the previous chapter, this academic theory was the starting point for developing hypotheses and building the conceptual framework, using a deductive reasoning approach. What is more, to move closer to meeting research objectives, this model had to bloom from a conceptual to an operational level.
Thus, in order to accomplish this transition, both exploratory and explanatory research methods were employed through the collection of primary data.
First and foremost, to avoid possible researcher bias in the choice of a food category to carry out this dissertation, a pre-online survey was used.
Thereafter, a focus group was particularly useful in generating insights about the most appropriate Celebrity and Celebrity Expert endorsers to be employed further in the main questionnaire.
Subsequently, after the creation of visual stimuli, it was crucial to assess whether respondents would interpret the pictorial ads as desired. Therefore, semi-structured interviews would seem to be the best method to accomplish the above-stated objective. Although this method has the disadvantage of using a small sample (Boyce & Associate, 2006), it would allow interviewees to individually and freely explore their thoughts about the displayed images (Saunders, Lewis, & Thornhill, 2008).
14
At last, an explanatory research was conducted for ascertaining the cause-effect relationships between visual advertising techniques, consumers’ purchase intent and taste perceptions (Saunders et al., 2008). For this purpose, an online questionnaire was employed.
3.2 Secondary Data
Secondary data did not directly allow the attainment of the goals proposed for this dissertation (Saunders et al., 2008), notwithstanding its usage had been indispensable for understanding the existent knowledge in the field. This data, predominantly based on academic journals and mostly set out in the former chapter, enabled the definition of a logical and consistent path towards the development of theoretical relationships between the variables. This, in turn, resulted on the generation of a conceptual framework which was imperative for formulating a suitable research design. Moreover, secondary data is onwards used to astutely interpret the primary data results (Malhotra, Birks, & Wills, 2012).
3.3 Primary Data
To tackle the research questions, data had to be originally collected and interpreted through four different studies which took place chronologically as follows: (1) Category Identification (2) Endorsers Selection (3) Stimuli Interpretation and (4) Main Study.
3.3.1 Category Identification
First of all, an appetizing food category had to be chosen in such a way that it should stimulate, as much as possible, the consumers’ taste perception. Hence, to avoid investigator bias and ensure rigor in the category selecting process, a pre-study was conducted.
3.3.1.1 Data Collection
Since it was intended to collect an opinion variable (Dillman, 2007) in a structured, standardized and quantitative form (Kothari, 2004) regarding taste perceptions of different food categories, a questionnaire was suitable.
This survey was spread in an online basis because of its high-speed data generation virtue, and was only available in English given that the investigation was not limited to a specific nationality.
The following were the main basis to filter the categories to be presented in the questionnaire: (1) past literature related to taste, (2) the heuristic intuition that unhealthy food is tasty (Jo & Lusk, 2018; Raghunathan et al., 2006) and (3) the ability of categories to stimulate the smell sense through an image. Taking all these factors into consideration, the fifteen categories
15
chosen were: cheese, chocolate bar, frozen pizza, jam, canned beans, liquid topping, cake mix, bolognese sauce, instant soup, cappuccino sachets, bacon, cream carbonara sauce, instant noodles, frozen lasagna and risotto. As the high variety within product lines could give rise to doubts of interpretation, the categories were specified in terms of flavor (Appendix 1).
Concerning the target of this pre-study, it seemed plausible that those who were going to elect the category were buyers of FPG. Thus, at the beginning of the questionnaire there was one screening question exclusively allowing respondents that purchase FPG at least once in three months to continue with the inquiry process. This question consisted of the first section of the survey, being followed by the taste measurement and ending with a block to collect the demographics (Appendix 1). The underlying sample was selected through a convenience non-random technique which, in spite of being prone to a certain bias degree, it would seem to be the best option given the resources and time constraints (Kothari, 2004; Saunders et al., 2008). 3.3.1.2 Measurement
With the purpose of measuring respondents’ perception about the taste of the fifteen referred food products, a construct beforehand applied by Elder and Krishna (2010) was used. It involved a three-item scale, comprised for perceived taste, quality and deliciousness which aided in overcoming the restrictions of such an abstract concept as taste perception is. The mentioned items were measured using a seven-point Likert scale (from 1=Very Poor to 7=Very Good).
3.3.1.3 Analysis and Results
This research study resorted to Qualtrics and SPSS softwares to collect and analyze, respectively, the inherent quantitative data. From a total of 203 completed answers, 7 were excluded for not meeting the purchase frequency requirement. In the first place, frequency statistics were conducted to characterize the 196 valid respondents demographically and in terms of their buying behavior (Appendix 2). Although gender-wise there was a relatively uniform distribution, the typical respondent of this pre-survey was a Portuguese, aged between 18 and 24 years old, holding a bachelor’s degree and accustomed to purchasing FPG from one to three times a week.
Afterwards, Cronbach’s Alpha coefficient was performed. This measure was calculated separately for all categories as well as in aggregated form (Appendix 3). The taste, quality and deliciousness scale presented an excellent reliability index – all Cronbach’s α were above or
16
only slightly below 0,9 - demonstrating that the construct has a very good internal consistency (George, D., & Mallery, 2003) (Appendix 3).
Last but certainly not least, Descriptive statistics were performed to indicate which food product generated the highest level of taste perception. Regarding the results (Appendix 4), milk chocolate bar yielded the highest mean (𝑀 ≅6) and the lowest standard deviation (𝑆 ≅1,2). Henceforth, it is perfectly justifiable to consider a chocolate bar, specifically the milk variety, as the perfect category for pursuing this investigation.
3.3.1.4 New Product and Brand Development
In order to prevent consumer bias regarding pre-developed taste perceptions about known products, a fictitious brand and product were created. Thus, through Adobe Photoshop and Adobe Illustrator CC 2016, a new packaging and logo were designed, and the Choka Milk Chocolate Bar was created.
17
3.3.2 Endorsers Selection
Succeeding the food category choice, it was the moment to select the most proper Celebrity Non-Expert and Celebrity Expert endorsers to be employed in the main survey. Towards this end, a focus group was carried out.
3.3.2.1 Data Collection
With the aim of understanding which well-known figures should be chosen, a focus group of one-hour length, which counted with the participation of eight elements from a convenience sample, was organized. The participants, from five different nationalities, were chocolate lovers and had a similar age (Appendix 5), in order to ensure they felt comfortable sharing opinions with each other (Rabiee, 2004). This session appeared to be the most suitable procedure for gathering the intended insights (Saunders et al., 2008), as it would promote the interaction between individuals.
The meeting was structured into four main sections (Appendix 6). Firstly, there was a warm-up phase where session details were briefly explained, and subsequently attendees were invited to introduce themselves. The second part was anchored in the Match-Up Hypothesis (Erdogan, 1999). For this reason, participants were asked to imagine that a new milk chocolate bar would be launched by a new brand named Choka, and managers needed to decide two Celebrities to endorse it: one whose profession is other than related with cooking, and the other should be a famous cook. Inspired by Ohanian (1990) technique, they were given three minutes to individually list, without overthinking, Celebrity Non-Expert and Celebrity Expert names, in two respective columns. Afterwards, focusing on one column at a time, elements were encouraged to share their suggestions until all suggested names were ranked based on their mention frequency. The most mentioned names were particularly debated in order to reach a consensus on the most adequate two endorsers for each group. After reaching an agreement, a questionnaire was personally distributed to be individually filled. The first question was dedicated to understand Celebrities’ familiarity, the second to assess their likability among participants (Amos et al., 2008) and the third was sustained by the expertise dimension of the Source-Credibility Scale (Ohanian, 1990).
3.3.2.2 Measurement
An endorser’s familiarity is related with how the figure is recognized due to exposure (Erdogan, 1999) and its popularity is a worthwhile contributor for the present purpose.
18
The Q Score considers one question measuring participants’ familiarity with the Celebrity and other to determine how popular the personality is (Shimp & Andrews, 2013), as shown in the figure below. It is noteworthy that the popularity construct was slightly adapted to ensure the usage of a balanced scale (Malhotra et al., 2012).
Figure 3: Q Score
Regarding expertise, it was crucial to guarantee that the chosen Chef, besides being recognizable and popular, was considered the most expert in the field. For that reason and in line with Ohanian (1990), a seven-point rating semantic differential scale based on five items, as can be observed in the following figure, was used to quantify the Celebrities' perceived expertise. To decrease the likelihood of the respondents solely reading the left adjectives, the original scale was adjusted and the poles were purposefully swapped (Saunders et al., 2008).
Figure 4: Celebrity Expertise
Lastly, the endorsers who obtained the most appropriate overall rating were selected to be used in the main study.
19
3.3.2.3 Results
As a result, the actor Pierce Brosnan was the selected character to represent the Non-Expert famous person and Gordon Ramsay to represent the Chef Celebrity. Below is presented a scheme summarizing the main insights and conclusions obtained throughout the focus group. More detailed information is presented in Appendix 7.
Figure 5: Focus Group Results 3.3.3 Stimuli Interpretation
The pictorial ad stimuli were produced from the ground up, in the light of the studies’ results. The figure below depicts the seven scenarios developed.
20
To foster a high-quality outcome, the images were taken in two photographic studios by a professional photographer. As some pictures entailed photographic manipulation, not only did this dissertation count on a photographer but it also benefited from an image editor. The resorted image editing software was Adobe Photoshop CS6 2019.
The following were the Endorsement visual stimuli created:
21
Figure 8: Endorsement – Non-Celebrity Expert
22
23
Figure 10: Endorsement – Non-Celebrity Non-Expert
24
Figure 11: No Endorsement (Control Group)
All the decorative elements, of the present and the following images, were chosen and arranged by the researcher and the photographer.
25
The succeeding images represent the developed Sensory Marketing stimuli:
26
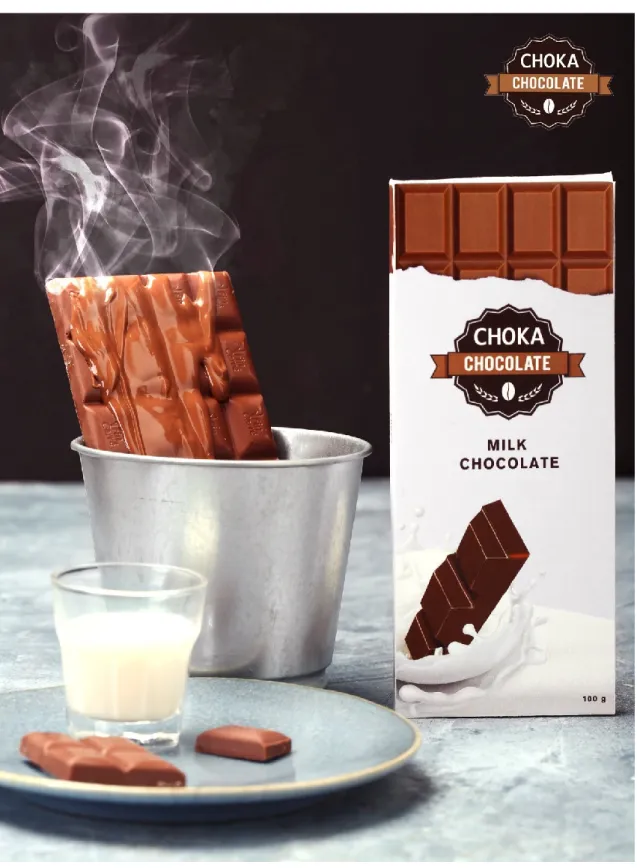
Figure 13: Sensory Marketing – Smell Stimulation (Version 1)
With the purpose of understanding the extent to which these ads conveyed the desired stimulus, a qualitative study was conducted.
27
3.3.3.1 Data Collection
To uncover how respondents interpreted the images, semi-structured interviews appeared to be the most viable approach (Saunders et al., 2008). This research technique, typified by the usage of open-ended questions (Boyce & Associate, 2006), enabled the investigator to understand a person’s thoughts induced by each stimulus.
Consequently, ten interviews were conducted with a convenience sample of milk chocolate lovers. To ensure, as far as possible, this sample could lead to reliable findings, the selected participants were from different nationalities, age-ranges and genders (Appendix 8). Six of the interviews were conducted face-to-face, and the remaining were internet-mediated through video call as theseinterviewees were living across borders. However, research was divided on whether or not online-interviews are able to provide the necessary interactivity levels (Mann & Stewart, 2000).
Every interview was audio-recorded for later transcription and, if applicable, translation into English. Of the total, three were held in English while the others in Portuguese.
The script, developed to guarantee the congruence between interviews (Boyce & Associate, 2006), was designed so that each image was addressed at a time (Appendix 9), via computer to simulate the virtual context in which respondents would see the advertisement in the main survey later on.
3.3.3.2 Results
The sample size used was considered enough since from the sixth interview onwards there were no incremental interpretations. The interviewees interpreted six of the seven stimuli as intended, so there were reasonable grounds for believing that those were clearly represented (Appendix 9). It was felt that the Smell Stimulation advertisement did not entirely achieve its purpose as participants were excessively focused on the hand pouring chocolate, in the upper left corner of the image (Appendix 9). On one hand, 90% of participants expressed that the photography captured different possible chocolate use stages (e.g. “This hand reminds me of cooking” –
female). On the other hand, the steam attracted the attention of nearly half of the interviewees,
and when questioned about what it was conveying all of them stated the chocolate smell. The fact that respondents did not spontaneously mention this relationship is in line with the below-consciousness advertising processing, in which this investigation has taken place (Elder & Krishna, 2010). Since this image conveyed an ambiguous message, a new version was created from the ground up, in line with the mentioned guidelines. Therefore, the Version 2 of this stimulus presented a greater steam cloud and simultaneously did not contain the pouring-cue.
28
Consequently, a second meeting was scheduled with each interviewee. All of them interpreted this version as intended (Appendix 9). Thus, the following version will be used for Olfactory Stimulation instead of the previous one.
29
3.3.4 Main Study
To understand the underlying relationships between the variables, quantitative data was collected and analyzed based on a casual-research approach built-in an experimental design (Saunders et al., 2008). This enabled the hypotheses to be tested and the research objectives to be met.
3.3.4.1 Data Collection
An online survey was spread, mainly through social media platforms, from November 21st to November 26th, 2019. Regarding the online data gathering, not only did it provide a high speed information collection but it also replicated a virtual visual advertising environment. This questionnaire was based on a cross-sectional design comprising seven scenarios, each corresponding to one of the seven visual advertising stimuli, in which participants were randomly allocated. In relation to the reasons for using a convenience sampling technique and employing English in the survey, they were the same as the ones stated in the pre-questionnaire (Sub-Chapter 3.1.1.1). Moreover, a pilot survey was conducted with ten individuals.
The target for the questionnaire were all those who consume or buy a chocolate bar at least once in three months. Accordingly, two questions were initially displayed in the survey, in a way that non-eligible respondents were excluded. This was followed by a section that assessed respondent preferences for the main four chocolate bar types. Those who expressed chocolate milk aversion were directly forwarded to the demographics block. Contrarily, for those who stated to be milk chocolate appreciators, one of the stimuli was randomly displayed, and after that two sections were presented regarding taste perception and purchase intention, which the order of appearance was also randomized. The last section addressed respondents’ demographic characteristics (Appendix 10).
Albeit a total of 856 responses had been gathered, 227 of them were discarded from the analysis for (1) incompleteness, (2) ineligibility of respondents or (3) inconsistency in answers. Therefore, only 629 cases were valid, being handled through the pairwise deletion method. 3.3.4.2 Measurement
In order to understand respondent perceptions about the taste of the advertised milk chocolate bar, the construct previously used in the pre-questionnaire was applied (Sub-Chapter 3.3.1.2). This model suggested by Elder & Krishna (2010) is a three-item scale comprising perceived taste, quality and deliciousness which in turn are measured through a Likert scale ranging from 1=Very Poor to 7=Very Good.
30
As for purchase intention, according to Bao, Bao and Sheng (2011), it can be measured through a Likert scale, asking for the respondents’ agreement degree with three statements: “The likelihood of my purchasing this product is very high”, “The probability that I would try this product is very high” and “My willingness to buy this product is very high”. These sentences were customized with the product name. The scale had seven response categories from 1=Strongly Disagree to 7=Strongly Agree (Bao et al., 2011).
CONSTRUCT SCALE NUMBER OF ITEMS LITERATURE Taste Perception 7-point Likert Scale 3 (Elder & Krishna, 2010)
Purchase Intention 7-point Likert Scale 3 (Bao et al., 2011)
Table 1: Operational Model
Despite less important, a dichotomous question, inspired by Shimp and Andrews (2013) - “Have you heard of this person?” – was used to assess the familiarity of respondents with the Celebrities presented in the two inherent stimuli.
3.3.4.3 Data Analysis
Once again, data was collected and analyzed through Qualtrics and SPSS softwares, respectively.
Initially, the data preparation process was described, and then the sample was demographically characterized mainly through frequency statistics. Subsequently, the reliability of the constructs was assessed through Cronbach’s alpha and their quality was ranked based on the guidelines proposed by George and Mallery (2003).
Thereafter, Endorsement and Sensory Marketing hypotheses were tested using Mann-Whitney U Test, for comparisons between two groups, and Kruskal-Wallis H Test, for comparisons of more than two groups.
Later, to test to what extend visual advertising techniques impact consumers’ purchase intention through taste perception, Hayes’ PROCESS model 4 was employed (Bolin, 2014) (Appendix 46). Since this mediation involved a multicategorical independent variable (i.e. groups assigned to ads), the general linear modelling approach developed by Hayes and Preacher (2014) was used and the indicator coding strategy was employed (Figure 15).
Furthermore, to identify the profile of the Typical Consumer of milk chocolate bars, Chi-Square was performed.
31
Finally, a Spearman Correlation analysis was carried out for a better understanding of how preferences of different types of chocolate are related. For all the statistical tests, the significance level was set at 5%.
32
CHAPTER 4: RESULTS AND DISCUSSION
The following chapter is devoted to the main study results. A description of quantitative data analysis is provided aiming at characterizing the sample, testing the hypotheses and the full-model, identifying the typical milk chocolate consumer as well as preference correlations. 4.1 Data-Preparation Process
A total of 856 questionnaires were initiated. After they were checked for completeness, only 668 were accepted. Wherefore, it is implied a response rate of 78% which suggests that the survey was efficiently designed (Saunders et al., 2008). When editing and cleaning the data, 33 participants were dropped from the analysis as neither had bought nor consumed a chocolate bar in the preceding three months, and another 6 were discarded for inconsistent answers. This led to 629 valid answers which were handled through the pairwise deletion method. Therefore, the sample size will vary based on the analysis at hand (Malhotra et al., 2012). This procedure appears to be suitable as: (1) the sample size is considerably large, (2) there are only 85 missing answers in blocks four and five, and (3) the variables will not be associated (Malhotra et al., 2012). Accordingly, since 63 respondents did not appreciate milk chocolate, only 566 were evenly exposed to one of the stimuli. Furthermore, from the 80 allocated to Celebrity Expert stimulus, 14 did not recognize Gordon Ramsay. Along the same line, 8 of the 79 allocated to Celebrity Non-Expert group were not familiar with Pierce Brosnan. For this reason, those participants, who did not answer the fourth and fifth blocks, were treated as if they had not been presented to any stimulus. These cases alongside with those who were not actually exposed to any image, were recoded to belong to Group 0 - “G0”. The table below shows the amount of valid answers per block and the participants distribution over groups.
33
4.2 Sample Characterization
Although the sample was composed by twenty-two different nationalities from four continents - Europe (98,41%), America (0,95%), Asia (0,48%) and Africa (0,16%) - the vast majority of those surveyed were Portuguese (90,9%). Furthermore, there was a predominance of women (65,5%) over men (34,5%) and most respondents held higher education qualifications (65,4%), belonged to an age group ranging from 18 to 34 (73,2%) and were employed (58%). Additionally, nearly three-quarters of participants had a gross income of up to 1499€/month (74,6%). In terms of their chocolate consumption habits, there was an almost uniform division into rare (27,8%), occasional (35,3%) and frequent (26,9%) consumers, without considering the very frequent ones (9,5%). Regarding their buying behavior, a large proportion were rare (36,1%) or occasional (36,2%) purchasers of chocolate. When it comes to preferences, milk chocolate was the favorite type among respondents (𝑀 =5,78; 𝑆 =1,51) (Appendix 12), being the variety with the highest percentage of positive judgements (85,5%) (Appendix 13).
By analyzing all these characteristics across the seven groups, one can conclude that their latent sub-samples are identical which ensures the existence of homogeneity between them (Appendix 11). Nonetheless, this characterization mirrors usage of a non-probabilistic technique whereby the likelihood of the sample being representative of the total population is very low (Saunders et al., 2008).
4.3 Measures Reliability
Despite both taste perception and purchase intention scales have been previously validated in literature, it was found necessary to assess their reliability considering the sample under analysis. For the measurement of the internal consistency, Cronbach’s alpha coefficient was employed and its quality was ranked based on the guidelines proposed by George and Mallery (2003) (Appendix 14).
The combination of perceived taste, quality and deliciousness to form the taste perception scale turned out an excellent reliability index, with a Cronbach’s α of 0,908, demonstrating that this construct had a great internal consistency (Table 2). This measure was also performed for each of the seven groups and all the values were ranged from 0,84 to 0,924 (Appendix 14).
For the measure of purchase intention, the scale had a coefficient α equal to 0,886, showing a good reliability and indicating a positive internal consistency (Table 2). When considering for each group separately, the coefficient varied from 0,845 to 0,925 (Appendix 14).
34
4.4 Results from the Hypotheses Testing
The nature of the hypotheses presupposed a comparison between two (H2.a; H2.b; H3.a; H3.b; H5.a and H5.b) or more groups assigned to adverts (H1.a; H1.b; H4.a and H4.b), in terms of their taste perceptions and purchase intentions of the chocolate bar. Additionally, no participant was exposed to more than one advert wherefore it was ensured independence of observations. This scenario would indicate the appropriateness of Independent Samples T-Test (for two groups comparisons) and One-Way ANOVA (for more than two treatments). To guarantee the feasibility of these statistical tests, a preliminary check of their assumptions was made. By performing the Kolmogorov-Smirnov Test, it was found that taste perception and purchase intention were not approximately normally distributed for all groups (Appendix 15), and, therefore, the fifth assumption was not satisfied (Laerd Statistics, 2016). To overcome the fact that the data failed the normality assumption, nonparametric tests were employed. More precisely: (1) Mann-Whitney U Test was the alternative to Independent-Samples T-Test and (2) Kruskal-Wallis H Test was the surrogate for One-Way ANOVA. To ensure that Mann-Whitney U Test and Kruskal-Wallis H Test could give rise to valid results, assumptions were verified beforehand. Firstly, the dependent variables were measured at an ordinal level since Likert scales were used. Secondly, the Mann-Whitney U Test exclusively compares two groups at time (G1 versus G2, G2 versus G3, G6 versus G7), while Kruskal-Wallis H Test is commonly applied for at least three categorical groups (G1, G2, G3, G4 and G5 simultaneously). Thirdly, the questionnaire was designed to ensure the participants were allocated to one and only one group whereby there was independence of observations. Lastly, the dependent variables were not normally distributed, as previously shown in Appendix 15. Based on the foregoing, Mann-Whitney U Test and Kruskal-Wallis H Test could properly analyze the data.
Due to the fact that the groups had different shapes, both for purchase intention and taste perception, results will be presented taking into consideration the mean ranks (Laerd Statistics, 2015; Lund & Lund, 2013).
CONSTRUCT CRONBACH’S ALPHA QUALITY N OF ITEMS Taste Perception General 0,908 Excellent 3
Purchase Intention General 0,886 Good 3 Table 2: Cronbach’s Alphas