Recebido para publicação em 13/2/2009 Aceito para publicação em 8/7/2009 (004056)
1 Faculdade de Engenharia Agrícola, Universidade Estadual de Campinas – UNICAMP, Cidade Universitária Zeferino Vaz, s/n, Distrito de Barão Geraldo, CP 6011, CEP 13083-875, Campinas - SP, Brasil, E-mail: [email protected]
*A quem a correspondência deve ser enviada
Rheological behavior of corn and soy mix as feed ingredients
Comportamento reológico de mistura de milho e soja para produção de rações
Marcos FRAIHA1*, João Domingos BIAGI1, Antonio Carlos de Oliveira FERRAZ1
1 Introduction
The current technological status of animal feed production justifies the use of ingredient and feed processing procedures, such as expansion, extrusion, and pelleting.
The mechanical behavior of those ingredients and their interaction with processing machinery are reflected in operating parameters such as: energy demand, operating capacity, and equipment use, as well as in the final properties of products, such as level of expansion and cooking, coloring, density, and texture. It is known that extruded foods behave as non-Newtonian fluids, and their viscosity can be described by the Power Law model (CARVALHO; ASCHERI; MITCHELL, 2004; LI; CAMPANELLA; HARDACRE, 2004; SINGH; SMITH, 1999; EERIKAINEN; LINKO, 1998; RAO; ANANTHESWARAN 1982; REMSEN; CLARK, 1978). However, little is known about the rheological behavior of ingredients submitted to the characteristic processes in the feed industry.
In Brazil, corn and soy grains are the main ingredients in animal feed accounting for around 80% of its mass production
(SINDIRAÇÕES, 2007). According to Steffe (1996), the shear rate generated during the cereal and animal feed extrusion process varies from 0 to 103/second, and the temperature and
pressure may range from 80 to 160 °C and from 1,500 to 6,000 kPa, respectively.
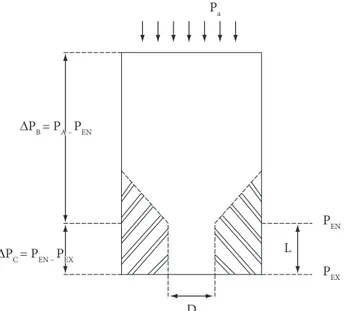
Capillary rheometry (Figure 1) is a technique that allows one to measure the rheological properties of materials subjected to a broad range of shear rate and temperature, provided one may assume that flow is laminar and constant, entry and exit effects at the capillary die are negligible, fluid is incompressible, rheological properties are not affected by time and pressure, temperature is constant, and no fluid slippage at the capillary wall occurs (DARBY, 1979).
Figure 1 illustrates the fluid flow through a capillary die of diameter D and length L. The total applied pressure is PA and the capillary exit pressure is PEX (atmospheric). Extensional and shear viscosity can be estimated from the pressure drop within the cylinder and within the capillary, respectively.
Resumo
Alimentos comportam-se como fluidos não newtonianos, porém pouco se sabe do comportamento de milho e soja sob escoamento viscométrico. Para caracterizar o comportamento reológico de alimentos para animais, uma mistura de grãos de milho e soja moídos na proporção 70:30 (massa:massa) foi submetida ao reômetro capilar sob 3 níveis de temperatura (80, 120 e 160 °C), umidade da massa (26,5 ± 0,08; 30,4 ± 0,31; e 33,4 ± 0,05%), e 4 taxas de cisalhamento aparente (30,4; 72,9; 304,3; e 728,6/second). Diferentes taxas de deformação e dimensões da matriz foram utilizadas para obtenção das taxas de cisalhamento acima. Os dados obtidos foram ajustados para os modelos da Lei da Potência, Casson e Bingham. Baseados nos dados experimentais, os efeitos de umidade, temperatura da massa e taxa de cisalhamento sobre a mistura de milho e soja foram ajustados para uma expressão única (p < 0,001, R2 = 0,93):
η = 18.769,7 (γ)–0,86 e (–9,34 U + 935 T), onde γ
é a taxa de cisalhamento, U é a de teor de água na amostra e T é a temperatura na massa, em escala Kelvin. Como esperado, a mistura de milho e soja moídos apresentou comportamento pseudoplástico.
Palavras-chave: escoamento viscométrico; cisalhamento; pseudoplástico; reômetro capilar.
Abstract
Foods behave as non-Newtonian fluids, but little is known about how corn and soybean mix behave under viscometric flow. In order to characterize the rheological behavior of animal feed under viscometric flow, a 70:30 (mass:mass) mixture of ground corn and soybean grains was submitted to a capillary rheometer at 3 different temperatures (80, 120, and 160 °C), different moisture levels (26.5 ± 0.08; 30.4 ± 0.31, and 33.4 ± 0.05%), and 4 shear rates (30.4; 72.9; 304.3, and 728.6/second). Different strain rates and die dimensions were used to obtain the target shear rates. The resulting data were fitted to Power Law, Casson, and Bingham models. Based on experimental data, water content, mass temperature, and the effects of shear rate on the apparent shear viscosity of corn-soy mix were fitted to a single expression (p < 0.001, R2 = 0.93):
η = 18,769.7 (γ)–0.86 e (–9.34 U + 935 T), where γ is shear rate, U is sample moisture, and T is sample temperature in Kelvin scale. As
expected, such mixture presented a pseudoplastic (shear-thinning) behavior.
Keywords: viscometric flow; shear; shear-thinning; capillary rheometer.
measurement range of 0 to 500 kgf (Calibration Certifi cate n. 241 06CT2007).
Th e experiment consisted of recording the force curve during extrusion of 50 g of the sample through the capillary rheometer, combining dies of diff erent dimensions and piston displacement velocities, so as to obtain pre-defi ned shear rates. Th e die dimensions used ranged from 3 to 6 mm inner diameter (D) and had a length to diameter ratio of 10. Piston displacement velocities ranged from 0.4 to 4 mm/second.
The experimental design was completely randomized, in a 3×3×4 factorial scheme with 3 levels of temperature and moisture of the mass and 4 levels of apparent shear rate. Data were collected in four replicates.
The material moisture levels were obtained via the previously described conditioning procedure and were 26.5 ± 0.08; 30.4 ± 0.31, and 33.4 ± 0.05% (mean ± standard deviation). The mass temperature in the rheometer was controlled by an electrical resistance-based heating system, at 80, 120, and 160 °C, allowing 3-minute come-up time for temperature equilibrium. Preliminary observations indicated that moisture loss at the highest temperature values were negligible. Apparent shear rate (γap) was estimated using
Equation 1 and was fi xed at 30.4; 72.9; 304.3; and 728.6/second.
3
32 c ap
Q D
γ π =
(1)
where Qc is the volumetric fl ow in the capillary, determined by piston area ( 2
p
D
π ) and displacement velocity (vp) (Equation 2):
2
4
p p
c
v D
Q = π (2)
Shear tension on the capillary wall, τpc, can be associated to a pressure drop along the capillary (∆Pc) using the fl owing Equation 3:
4 c c pc
c
P D L
τ =∆ (3)
Pressure loss due to convergence of the capillary walls and loss of kinetic energy at the capillary entrance were corrected by measuring the force required for the material to fl ow through dies of same diameter as the test dies, but zero length (Lc = 0), and then subtracted from force measured with test dies. Th us, ∆Pc can be calculated (Equation 4):
( )
(
)
2
4 p c p c 0
c
p
F L F L
P
D
π
− =
∆ = (4)
where Dp is the piston diameter and Fp is the force applied to the piston.
Figure 2 shows a characteristic force-strain curve obtained by displacement of the rheometer piston through time.
To calculate ∆Pc, a mean force value (F) is obtained from the force-strain curves generated during the experiment, considering only the data from region β, as exemplifi ed in Figure 2. Fmax represents the necessary force to initiate the material fl ow through the capillary die, whereas β represents Th e purpose of this work was to characterize the rheological
behavior and the fl ow velocity profi le of corn and soy mix under viscometric fl ow.
2 Materials and methods
Sample conditioning and preparation were carried out at Faculdade de Engenharia Agrícola, UNICAMP, Brazil. Corn and soy grains mixed at a proportion of 70:30 (mass) were ground in a hammermill, using a 1.5 mm mesh sieve. Samples were collected in order to determine the centesimal composition and particle size in triplicates. Aliquots of this material were conditioned by adding and mixing water at 15, 20, and 25% with an electric mixer, which were then placed in plastic bags and left to rest for 18 hours at 5 °C in order to bring mass moisture to equilibrium. Th e material was then vacuum-sealed and stored at 5 °C. Aliquots were collected to determine the water content using the gravimetric method. Two-gram aliquots in duplicate were weighed on an analytical scale and dried in a forced-air oven for 24 hours at 105 °C. Th e measurement of the average geometric diameter of the samples followed ANSI/ASAE standard S319.3 method (AMERICAN..., 2004). True density was determined using the Archimedes method (MOHSENIN, 1986) with the use of 98° ethanol instead of water to prevent particles to fl oat. Th e centesimal composition of the sample was determined according to AOAC methodology (ASSOCIATION..., 1984).
Th e rheology tests were conducted at Centro de Tecnologia, UNICAMP, Brazil. Th e capillary rheometry method was used, as described by Rauwendaal (1994), using a capillary rheometer, as described by Fraiha et al. (2007), coupled to a universal testing machine (MTS, Sintech 5G). The data acquisition system, including the universal testing machine and the load cell, was calibrated for this experiment, and the expanded measurement uncertainty was ≤ 0.12%, coverage factor > 2.0 for a specifi c
slip coeffi cient δ in order to estimate slip-corrected shear rate,
γ
ap,c (Equation 11):
,
8 pc
ap c ap D
δτ
γ =γ − (11)
Th e mass temperature and moisture also infl uence the viscosity of a material. Shear rate, temperature and moisture of the mass can be combined into a single expression (HARPER; RHODES; WANNINGER, 1971) (Equation 12):
( ) ( ) 1 ( ) ( )
, , n . B U A T
f U T K UTγ e
η γ γ − + ′
= ′ = ′ (12)
where the infl uence of shear rate is represented by the Power Law model, U is the material moisture (percentage), and T is the inverse of the testing temperature, in Kelvin scale.
Th e assumption of laminar fl ow in the capillary is a theoretical fundament in this discussion, and it is assessed by calculating the Reynolds number (NRe) (RAO; ANANTHESWARAN, 1982). A fl uid governed by the Power Law (lp) presents laminar fl ow if (Equation 13):
( )(( ))( )
2
2 1
Re, 6464 2 1 3
n n lp
N n n n
+
− +
< + + (13)
where n is the fl ow behavior index (n < 1 for pseudoplastic fl uids and n = 1 for Newtonian fl uids).
Th e Reynolds number for Power Law fl uids is given as (Equation 14):
( )
( )(
)
2 Re, 1 4 3 1 8 n n nlp m n
n
N D v
n K ρ − − = + (14)
where D is the capillary diameter, vm is the mean velocity fl ow through the capillary die, ρ is the true density of sample, and K is the consistency coeffi cient of the fl uid (K = Klp) (STEFFE, 1996). Th e velocity profi le of laminar fl ow in a cylinder can be estimated via Equation 15 (RAO; ANANTHESWARAN, 1982):
1 3 1 1 1 n n m
v n r
v n R
+
+
= −
+ (15)
where v is the fl ow velocity at radial position r and vm is the average fl ow velocity in the capillary, estimated from the volume of material fl ow due to piston displacement.
3 Results and discussion
Th e ash, ether extract, and crude protein content were 2.66 ± 0.09; 7.61 ± 0.07; and 19.7 ± 0.81% (mean ± standard error), respectively (dry matter basis).
Th e average geometric diameter was 542.39 ± 42.98 µm. Th e particle size may infl uence the sample viscosity (SERVAIS; JONES; ROBERTS, 2002). However, only very few authors provided particle size and the centesimal composition profi le of the material studied; therefore a perfect comparison of results is diffi cult.
the piston displacement required to fl ow a quantity of mass that is equivalent to the internal volume of the test die. Th e distance between Fmax and the start of β is equal to β, meaning that a volume of mass is fl owed before data collection; therefore, the data obtained for the calculations coincides with the stable force response to imposed strain. Th is procedure enables one to acquire average values with variation coeffi cients of about 5%.
Th e estimated shear rate on the capillary wall (γ´pc) was obtained by applying the Rabinowitsch correction to the apparent shear rate (Equation 5):
3 1
4
pc ap
n n
γ = + γ
(5)
where n is the fl ow behavior index (Equation 6):
(
)
(
)
log log ap pc d n d γ τ= (6)
Apparent viscosity (η) could then be determined (Equation 7):
pc
pc
τ η
γ
= (7)
Th e rheological behavior of the samples was represented by the Power Law (lp) and Bingham (bg) and Casson (cs) models, according to respective Equations 8, 9 and 10:
( )
n 1lp Klp pc
η = γ − (8)
0 bg bg pc K τ η γ = +
(9)
0.5 0 0.5 cs cs pc K τ η γ = +
(10)
where Klp, Kbg and Kcs are the consistency indexes of the samples, τ0 is the minimum force to initiate the fl ow through the capillary, as determined by the extrapolation method when
γ
pc = 0 (STEFFE, 1996).
500/second, determined values of n ranging from 0.16 to 0.52, and of Klp from 2.6 to 97.8 kPa.sn. Singh and Smith (1999)
obtained values of n and Klp ranging from 0.17 to 0.51 and 3 to 93 kPa.sn, respectively, for wheat flour with a water content
from 21 to 28% and at temperatures of 100 to 125 °C.
The negative n index obtained for the samples with 33.4% water content at 120 °C (Table 1) is difficult to explain although the negative flow behavior indexes had already been reported in the past. Padmanabhan and Bhattacharya (1991), studying the behavior of ground corn with moisture levels ranging from 25 to 45% at temperatures ranging from 150 to 180 °C, obtained –0.193 ≤ n ≤ 0.811 and 1.42×10² ≤ Klp ≤ 7.52×10⁵. These
authors varied the apparent shear rate from 163 to 652/second, and thereby obtained an apparent viscosity ranging from 98 to 1276 Pa.s, values which are close to the ones obtained in the present study. Their hypotheses to explain the negative values of
n include molecular degradation of sample, viscous dissipation, fluid slip along the capillary wall, and the influence of τ0 although the contribution of each of these factors was not clear. In the present experiment, sample slip may be involved, which could explain the negative n.
Few authors assessed the presence of slip on the capillary wall. In the present experiment, the corrections resulted in inconsistent data attributing negative values to γap,c. Other authors have obtained similar results and could not proceed with the correction (MACKEY et al., 1989; SINGH; SMITH, 1999). Based on the experimental data, excluding those with a negative n, the constants Kγ´UT, n, B, and A (Equation 12) were determined by multiple regression (p < 0.001, R2 = 0.93),
resulting in the expression (Equation 16):
( )0.86 (9.34 935)
18769.7 e U T
η= γ − − +
(16)
A comparison of the observed data and the estimated data from the general model, including the effects of shear rate, based on the Power Law model, water content, and temperature (Equation 16), is shown in Figure 3.
Under the conditions of this experiment, with n = 0.14, the flow is considered laminar if NRe, lp < 1876.2.
In this experiment, the capillary flow could be estimated by considering the maximum piston displacement velocity as Based on the original force and strain data, it was possible
to estimate the apparent viscosity (η) of the samples at different moisture, temperature, and shear rate levels. The consistency coefficient, K, the flow behavior index, n, as obtained using the Power Law model, and K, the minimum shear force required to initiate flow, τ0, as obtained through the Casson and Bingham models for the different experimental conditions, are given in Table 1.
The coefficients of determination for the Casson and Bingham models, which takes τ0 into account, were not better than those for the Power Law model. Alavi, Chen and Rizvi (2002) also recorded the same observation while modeling the rheological behavior of wheat starch. The existence of a true yielding behavior has been the subject of prolonged debate among rheologists since yield stress values are typically calculated by extrapolation of data (STICKEL; POWELL, 2005; TIN; GUO; UHLHERR, 2006)
Under the conditions of this experiment, the mixture of ground corn and soy grains presented a pseudoplastic behavior with a strong decline in apparent viscosity as shear rate increased, as indicated by the value of n in the Power Law model (Table 1). Sandoval and Barreiro (2007) found similar behavior for corn grits when using capillary rheometry and experimental conditions very similar to the present experiment
The utilization of the Power Law model to describe the flow behavior of cereal grains has been confirmed by several authors (LI; CAMPANELLA; HARDACRE, 2004; CARVALHO; ASCHERI; MITCHELL, 2004; ALAVI; CHEN; RIZVI, 2002; SINGH; SMITH, 1999; BAGLEY; DINTZIS; CHAKRABARTI, 1998; PADMANABHAN; BHATTACHARYA, 1991; SENOUCI; SMITH, 1988).
Recently, Viamajala et al. (2009) utilized Casson and Bingham models to describe the rheological behavior of corn stover slurry at high solid concentration. The Herschel-Buckley model is also used for some authors and predicts a yield stress like the Casson and Bingham models, but its evaluation is less certain (NGUYEN; BOGER, 1992; PIMENOVA; HANLEY, 2004)
Carvalho, Ascheri and Mitchell (2004), in their work with corn grits submitted to capillary rheometry under test temperatures from 90 to 120°C and shear rates from 10 to
Table 1. Consistency coefficients (K), flow behavior indexes (n) as determined by the Power Law model, and (K) and minimum shear forces required to initiate flow (τ0), as determined by the Casson and Bingham models for the different experimental conditions.
Experimental conditions
Power Law Casson Bingham
U% - T °C Klp(kPa.sn) n R2 K
cs(kPa.s n) (τ
0)
0.5(kPa) R2 K bg(kPa.s
n) τ
0 (kPa) R 2
26.5 - 80 17.60 0.20 0.96 0.85 0.195 0.95 –13.90 44.4 0.97
26.5 - 120 22.54 0.13 0.99 1.17 0.180 0.98 8.52 36.3 0.99
26.5 - 160 18.95 0.14 0.96 1.86 0.155 0.96 21.37 27.7 0.98
30.4 - 80 6.71 0.31 0.91 1.47 0.148 0.86 –14.84 29.0 0.90
30.4 - 120 20.17 0.06 0.99 0.42 0.151 0.99 2.22 24.2 0.99
30.4 - 160 9.00 0.15 0.95 1.81 0.101 0.92 21.04 11.5 0.87
33.4 - 80 7.81 0.28 0.96 2.09 0.138 0.97 10.44 23.9 0.98
33.4 - 120 22.11 –0.05 0.99 –0.23 0.141 0.99 0.95 19.2 0.99
33.4 - 160 10.01 0.12 0.92 1.93 0.095 0.82 24.80 9.8 0.70
By analogy, the zero value of r/R in Figure 5 represents the center, and the 1 value represents the capillary wall. Th e maximum fl ow velocity was estimated as 323 mm/second at the capillary center. It can be observed that most of the mass is not subjected to a velocity gradient while fl owing. Th e marked region under the curve in Figure 5, between 0.7 and 1 r/R, represents the portion of mass under shear while fl owing, and its volume is estimated as 50% of the mass, approximately. It is worth to note that such volume depends on the fl ow behavior index n only, as implied by Equation 9, regardless of the average fl ow velocity.
4 Conclusions
Ground corn and soy grain exhibit a pseudoplastic behavior under viscometric fl ow, represented by the Power Law model. Th e velocity profi le of such mixture under viscometric fl ow indicates that a large portion is not submitted to a velocity gradient.
Acknowledgements
Th e authors are grateful for the fi nancial support provided by the Fundação de Amparo à Pesquisa do Estado de São Paulo - FAPESP (Th e State of São Paulo Research Foundation). We thank Prof. Dr. Claudio Sverzut who kindly permitted us to use the universal testing machine at Centro de Tecnologia, Unicamp.
References
ALAVI, S. H.; CHEN, K. H.; RIZVI, S. S. H. Rheological characteristics of intermediate moisture blends of pregelatinized and raw wheat starch. Journal of Agricultural Food Chemistry, v. 50, p. 6740-45, 2002.
AMERICAN SOCIETY OF. Method of determining and expressing fi neness of feed materials by sieving. ANSI/ASAE S319.3. In: ASAE.
Agricultural engineers yearbook of standard. 51th ed. St. Joseph: ASAE, 2004. p. 578-81.
ASSOCIATION OF OFFICIAL ANALYTICAL CHEMISTS - AOAC.
Offi cial methods of analysis. 14th ed. Washington, DC: AOAC, 1984. 1141 p.
BAGLEY, E. B.; DINTZIS, F. R.; CHAKRABARTI, S. Experimental and conceptual problems in the rheological characterization of wheat fl our doughs. Rheologica Acta, v. 37, p. 556-65, 1998.
PADMANABHAN, M.; BHATTACHARYA, M. Flow behavior and exit pressures of corn meal under high-shear-high temperature extrusion conditions using a slit die. Journal of Rheology, v. 35, n. 3, p. 315-42, 1991.
CARVALHO, C. W. P.; ASCHERI, J. L. R.; MITCHELL, J. R. Capillary rheometry of maize and wheat: eff ect of sugar and temperature.
Alimentaria, p. 109-18, 2004.
DARBY, R. Viscoelastic fl uids, an introduction to their properties
and behavior. New York: Marcel Dekker, 1979. 638 p.
EERIKAINEN, T.; LINKO, P. Extrusion cooking modeling, control and optimization In: MERCIER, C. et al. Extrusion cooking, american association of cereal chemists. Minnesota, 1998. p. 157-204. FRAIHA, M. et al. Projeto e construção de reômetro capilar. In:
CONGRESSO BRASILEIRO DE ENGENHARIA AGRÍCOLA,
36., 2007, Bonito. Anais... Sociedade Brasileira de Engenharia
Agrícola, 2007.
4 mm/second, and the inner diameter of the rheometer cylinder
as 24.3 mm. Hence, the average velocity fl ow (vm) through the capillary with 3 mm diameter was estimated as 262.4 mm/second. Th e true density (ρ) was previously determined as 1300 kg.m–3.
Based on these data, the Reynolds Number was estimated as 0.37, indicating that fl ow is laminar, thereby fulfi lling a basic theoretical assumption made in this experiment.
Th e fl ow velocity profi le of an incompressible fl uid through a cylindrical canal may be estimated. Under steady state fl ow, a ring-shaped portion of the fl uid next to the canal wall presents a velocity gradient, where parts of the fl uid move in relation to their adjacent areas (Figure 4). In the central region of the canal, delimited by r, the fl uid fl ows freely without forming a velocity gradient.
Figure 5 shows the velocity profi le of a fl uid submitted to viscometric fl ow as a function of radial position in relation to the capillary wall.
Figure 3. Modeled apparent viscosity versus observed viscosity.
Figure 4. Poiseuille fl ow, R - radius; r - distance from the annular center to a given point. In the annular region, theoretically, there is no gradient of velocity between a given point and its adjacencies. In the fl ow region, such gradient of velocity is expected to occur.
SANDOVAL, A. J.; BARREIRO, J. A. Off-line capillary rheometry of corn starch : Effects of temperature, moisture content and shear rate.
Food Science and Technology, v. 40, p. 43-48, 2007.
SENOUCI, A.; SMITH, A. C. An experimental study of food melt rheology: I. Shear viscosity using a slit die viscometer and a capillary rheometer. Rheologica Acta, v. 27, p. 546-54, 1998.
SERVAIS, C.; JONES, R.; ROBERTS, I. The influence of particle
size distribution on the processing of food. Journal of Food
Engineering, v. 51, p. 201-8, 2002.
SINDIRAÇÕES. Perfil 2007. Disponível em: <http://www.sindiracoes. org.br/imagens/UserFiles/Image/Sindiraes/Perfil/Perfil_2006_2E_ Produc_Bras_15.gif>. Acesso em: dec. 2007.
SINGH, N.; SMITH, A. C. Rheological behavior of different cereals
using capillary rheometry. Journal of Food Engineering, v. 39,
p. 203-09, 1999.
STEFFE, J. F. Rheological methods in food process engineering.
2nd ed. Freeman Press: East Lansing, 1996. 417 p.
STICKEL, J. J.; POWELL, R. L. Fluid mechanics and rheology of
dense suspensions. Annual Reviews in Fluid Mechanics, v. 37,
p. 129-49, 2005.
TIN, C.; GUO, J.; UHLHERR, P. H. T. Yielding behaviour of viscoplastic materials. Journal of Industrial and Engineering Chemistry, v. 12, p. 653-62, 2006.
VIAMAJALA, S. et al. Rheology of corn stover slurries at high solids concentrations - Effects of saccharification and particle size.
Bioresource Technology, v. 100, p. 925-34, 2009. HARPER, J. M.; RHODES, T. P.; WANNINGER, L. A. Viscosity model
for cooked cereal doughs. AIChE Symposium Series, v. 67, p. 40-3, 1971.
LI, P. X.; CAMPANELLA, O. H.; HARDACRE, A. K. Using a in-line slit-die viscometer to study the effects of extrusion parameters on corn melt rheology. Cereal Chemistry, v. 81, n. 1, p. 70-6, 2004. MACKEY, K. et al. Rheological modeling of potato flour during
extrusion cooking. Journal of Food Processing Engineering,
v. 12, p. 1-11, 1989.
MOHSENIN, N. N. Physical properties of plant and animal materials. 2nd ed. New York: Gordon and Breach Science, 1986. 734 p.
NGUYEN, Q. D.; BOGER, D. V. Measuring the flow properties of yield stress fluids. Annual Review of Fluid Mechanics, v. 24, p. 47-85, 1992.
PIMENOVA, N. V.; HANLEY, T. R. Effect of corn stover concentration
on rheological characteristics. Applied Biochemistry and
Biotechnology, v. 113, p. 347-60, 2004.
RAO, M. A.; ANANTHESWARAN, R. C. Rheology of fluids in food processing. Food Technology, 1982.
RAUWENDAAL, C. Polymer extrusion. 3rd ed. New York: Hanser
Gardner Publishers, 1994. 568 p.
REMSEN, C. H.; CLARK, J. P. A viscosity model for a cooking dough.