* Corresponding author: E-mail: [email protected]
Received: January 6, 2016
Approved: June 22, 2016
How to cite: Seidel EJ, Oliveira MS. A Classification for a Geostatistical Index of Spatial Dependence. Rev Bras Cienc Solo. 2016;40:e0160007.
Copyright: This is an open-access
article distributed under the terms of the Creative Commons Attribution License, which permits unrestricted use, distribution, and reproduction in any medium, provided that the original author and source are credited.
A Classification for a Geostatistical
Index of Spatial Dependence
Enio Júnior Seidel(1)*
and Marcelo Silva de Oliveira(2)
(1) Universidade Federal de Santa Maria, Departamento de Estatística, Santa Maria, Rio Grande do Sul, Brasil. (2) Universidade Federal de Lavras, Departamento de Ciências Exatas, Lavras, Minas Gerais, Brasil.
ABSTRACT: In geostatistical studies, spatial dependence can generally be described by means of the semivariogram or, in complementary form, with a single index followed by its categorization to classify the degree of such dependence. The objective of this study was to construct a categorization for the spatial dependence index (SDI) proposed by Seidel and Oliveira (2014) in order to classify spatial variability in terms of weak, moderate, and strong dependence. Theoretical values were constructed from different degrees of spatial dependence, which served as a basis for calculation of the SDI. In view of the form of distribution and SDI descriptive measures, we developed a categorization for posterior classification of spatial dependence, specific to each semivariogram model. The SDI categorization was based on its median and 3rd quartile, allowing us to classify spatial dependence as weak, moderate, or strong. We established that for the spherical semivariogram: SDISpherical (%) ≤ 7 % (weak spatial dependence), 7 % < SDISpherical (%) ≤ 15 %
(moderate spatial dependence), and SDISpherical (%) > 15 % (strong spatial dependence);
for the exponential semivariogram: SDIExponential (%) ≤ 6 % (weak spatial dependence),
6 % < SDIExponential (%) ≤ 13 % (moderate spatial dependence), SDIExponential (%) > 13 %
(strong spatial dependence); and for the Gaussian semivariogram: SDIGaussian (%) ≤ 9 %
(weak spatial dependence), 9 % < SDIGaussian (%) ≤ 20 % (moderate spatial dependence),
and SDIGaussian (%) > 20 % (strong spatial dependence). The proposed categorization
allows the user to transform the numerical values calculated for SDI into categories of variability of spatial dependence, with adequate power for explanation and comparison. Keywords: geostatistics, spatial dependence, spatial variability, semivariogram,
summary measures.
INTRODUCTION
The correct description of spatial dependence is fundamental for revealing both the degree of spatial continuity and the structure of variability of the spatial phenomenon studied (Seidel and Oliveira, 2014). For such description, we can use the semivariogram alone, as a whole, or complement the semivariogram with a single spatial dependence index. According to Seidel and Oliveira (2014), given that the semivariogram is a highly informative descriptor, with abundant graphic detailing, it may need a complementary single measure to summarize all the semivariogram information in regard to spatial dependence.
In geostatistical applications for soil science, agricultural engineering, forest science, and agriculture, among others, two consolidated single indexes have been used. The first index is the relative nugget effect (NE), initially suggested by Trangmar et al. (1985) and further explored in Cambardella et al. (1994), which relates the nugget effect parameter with the sill parameter. The second index, the degree of spatial dependence (SPD), less frequently used and presented in Biondi et al. (1994), relates the contribution parameter to the sill parameter. Both these indexes are complementary and, according to Biondi et al. (1994), are useful for comparing different spatial dependence scenarios. In addition to these two summary indexes, the NE single index has been the index chosen for most analyses of the spatial dependence structure in Brazil.
Since the indexes mentioned here do not consider all aspects of the semivariogram geometry, such as the influence of the range parameter and the relevance of the use of a single index, Seidel and Oliveira (2014) proposed the spatial dependence index (SDI). In addition to considering the contribution, nugget effect, and sill parameters, this index also considers the range parameter, the model factor (which reflects the specific shape of the adjusted curve), and the maximum distance between sampled points. According to Seidel and Oliveira (2014), the SDI presented useful results when applied to real data, and it can be used to substitute or combine with the previously existing indexes. However, when presenting the index, the authors did not propose a categorization of the SDI value scale. This limits its use for classification of the degree of spatial dependence, given that the user frequently expects to declare such a degree of dependence in non-numerical categories, such as weak, moderate, and strong.
The main reason for categorizing a numerical index is to allow for comparison and classification. In soil science, and more generally in the agricultural and environmental sciences, the task of comparing and classifying is fundamental in driving decisions and managing the systems under study. This study is justified by practices already consolidated in spatial research, given that in geostatistical studies an index is generally used to describe spatial dependence and is followed by use of the categorization to classify the degree of such dependence.
The objective of this study was to propose a categorization system for the spatial dependence index (SDI) proposed by Seidel and Oliveira (2014) to allow classification of spatial variability in terms of weak, moderate, and strong dependence.
MATERIALS AND METHODS
NE(%) = C0
C0 + C1
× 100 Eq. 1
in which C0 is the nugget effect and C1 is the contribution, both semivariogram parameters.
According to Cambardella et al. (1994), NE has the following classification: strong spatial dependence (NE (%) ≤ 25 %), moderate spatial dependence (25 % < NE (%) ≤ 75 %), and weak spatial dependence (NE (%) > 75 %). This categorization seems inspired in the statistical quartile concept because Cambardella et al. (1994) did not use any real data analysis to come to this classification.
The second traditional index of spatial dependence (SPD), presented in Biondi et al. (1994), is given by the expression:
SPD(%) =
C1
C0 + C1
× 100 Eq. 2
in which C0 is the nugget effect and C1 is the contribution, both semivariogram
parameters like the NE index. Adjusting the classification given by Cambardella et al. (1994), we have the following induced SPD classification: weak spatial dependence (SPD (%) ≤ 25 %), moderate spatial dependence (25 % < SPD (%) ≤ 75 %), and strong spatial dependence (SPD (%) > 75 %). We can observe that NE (%) = 100 % - SPD (%), that is, NE and SPD essentially provide the same information. Therefore, because of equivalence between the two indexes, in this article we will not regard the NE index as essentially different from the SPD index. Moreover, the SPD measure has a geometric justification shown by comparing spatial dependence areas as seen in
Seidel and Oliveira (2015).
The spatial dependence index (SDI), proposed by Seidel and Oliveira (2014), is given by the following expressions for the spherical, exponential, and Gaussian models, respectively:
SDISpherical(%) = 0.375 ×
C1
C0 + C1
× 100
a
0.5MD
× Eq. 3
SDIExponential(%) = 0.317 ×
C1
C0 + C1
× 100
a
0.5MD
× Eq. 4
SDIGaussian(%) = 0.504 ×
C1
C0 + C1
× 100
a
0.5MD
× Eq. 5
in which C0 is the nugget effect, C1 is the contribution, and a is the practical range,
both semivariogram parameters like the NE and SPD indexes, and 0.5MD are half
of the maximum distance (MD) between sampled points, given that in the cases in which the ratio 0.5aMD results in a value superior to 1, this ratio is then truncated into 1, in order to assume values only between zero and 1. In expressions 3, 4, and 5, we use 0.5MD since Seidel and Oliveira (2014), when studying simulation and the
application of real data, considered half of the largest distance between sampled points. In addition, the 0.5MD factor is inspired on practical recommendations for
In order to build the SDI categorization, we considered 13 variations of the C1 C0 + C1
component: 0, 0.1, 0.2, 0.25, 0.3, 0.4, 0.5, 0.6, 0.7, 0.75, 0.8, 0.9, and 1. Those values represent 0, 10, 20, 25, 30, 40, 50, 60, 70, 75, 80, 90, and 100 % of the generic sill parameter, respectively. In addition, we considered 13 variations of the a
0.5MD component: 0, 0.1,
0.2, 0.25, 0.3, 0.4, 0.5, 0.6, 0.7, 0.75, 0.8, 0.9, and 1. Those values represent 0, 10, 20, 25, 30, 40, 50, 60, 70, 75, 80, 90, and 100 % of the half of the generic maximum distance, respectively. Thus, the 13 variations of the C1
C0 + C1 , combined with the 13 variation of the a
0.5MD , generate the distribution of 169 values of SDI proposed in this study. In each
model, the 169 theoretical values were multiplied by the value of the respective MF×100 % to generate a specific distribution of the SDI corresponding to each of the three models. First, we calculate the SDI for each model (spherical, exponential, and Gaussian), based on the 169 theoretical values. These 169 calculated values are then considered the data set over which we construct the boxplot graph to evaluate the form of distribution of the SDI values, and, subsequently, we categorize the SDI. To do this, we calculate the position measures: minimum, 1st quartile, median, 3rd quartile, and maximum. The intent is to construct SDI categorization from the position measures calculated and generate the classification as weak, moderate, or strong spatial dependence. This procedure is based on the classification suggested by Cambardella et al. (1994), given that the limits SPD = 25 % and SPD = 75 % can correspond to the 1st and 3rd quartiles of the SPD index, respectively. This strategy of creating categories by the establishment of cut-off points of values is chosen based on the rationale that is virtually impossible to establish what is weak, moderate, or strong spatial dependence categories using data of real spatial variability because of the infinite number of different scenarios and variables around the world (and also in Brazil), and the conflicting opinion of specialist in regard to the cut-off values among the categories. So, these cut-off points are suitable for all types of variables and phenomena, like the cut-off points of the SPD index, which uses the same rationale implicit in the criterion of Cambardella et al. (1994) for classification, because there is no other reasonable criterion.
Finally, to exemplify the proposal of categorization and classification of SDI and to compare it with classification based on the SPD index (whether the two criteria are equivalent, or not), real data, from papers of the Soil Science area, were used. A search was made on the Scientific Electronic Library Online (SciElo Brazil) journal portal according to the following guidelines: we searched for papers published in the Revista Brasileira de Ciência do Solo (RBCS) in which spherical, exponential, and Gaussian models were fitted, published in the period 2006-2015, and which had some kind of information for obtaining the maximum distance from the sampling grid in order to calculate the SDI and to obtain at least 100 values of the SDI in each model. If the total values for each model were not complete, a search was made in papers from other journals in the soil science area. The following papers were found: Simões et al. (2006), Camargo et al. (2010), Cavallini et al. (2010), Lima et al. (2010), Montanari et al. (2010), Zanão Júnior et al. (2010), Gontijo et al. (2012), Rodrigues et al. (2012a,b), Silva Júnior et al. (2012), Teixeira et al. (2012), Vitória et al. (2012), Camargo et al. (2013), Oliveira et al. (2013), Dalchiavon et al. (2013), Aquino et al. (2014), Costa et al. (2014), Dalchiavon et al. (2014), Luciano et al. (2014), Nascimento et al. (2014), Resende et al. (2014), Oliveira et al. (2015a,b), Santos et al. (2015), and Siqueira et al. (2015). These papers present real data dealing with different soil types, soil layers, spatial dependencies, and sizes of sampling grids. Thus, SDI exemplification and classification equivalence with the SPD index was performed for different soil types, soil layers, and spatial dependencies. All procedures were performed on the software R (R Core Team, 2012).
RESULTS AND DISCUSSION
asymmetric distribution (higher concentration of values at the lower extreme of the distribution). But, theoretically, the SPD index has approximately symmetrical distribution. This positive asymmetry of SDI is because of consideration of the model factor, the range parameter, and the maximum distance of the grid in its calculation, creating a more realistic and conservative measure of spatial dependence.
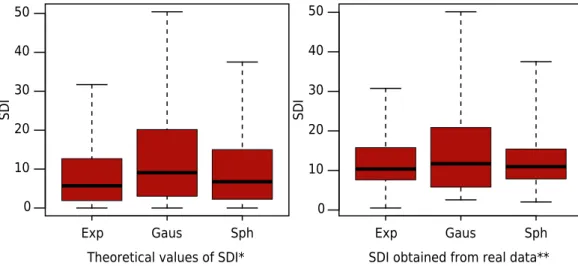
Given that the SDI (spherical, exponential, and Gaussian) exhibit positive asymmetric distribution, they must be categorized having the median and the 3rdquartile as limits, in order to have a classification that is more coherent and in fitting with the index distribution form. Thus, based on the results of figure 1, we propose the following classification (categorization) for the SDI:
For the spherical semivariogram:
SDISpherical (%) ≤ 7 % → weak spatial dependence;
7 % < SDISpherical (%) ≤ 15 % → moderate spatial dependence;
SDISpherical (%) > 15 % → strong spatial dependence.
For the exponential semivariogram:
SDIExponential (%) ≤ 6% → weak spatial dependence;
6 % < SDIExponential (%) ≤ 13 % → moderate spatial dependence;
SDIExponential (%) > 13 % → strong spatial dependence.
For the Gaussian semivariogram:
SDIGaussian (%) ≤ 9 % → weak spatial dependence;
9 % < SDIGaussian (%) ≤ 20 % → moderate spatial dependence;
SDIGaussian (%) > 20 % → strong spatial dependence.
Exp Gaus Sph
Theoretical values of SDI* 0
10 20 30 40 50
SDI
0 10 20 30 40 50
SDI
Exp Gaus Sph
SDI obtained from real data**
Figure 1. Boxplot graphs of the distribution of the theoretical values of the spatial dependence index
The Gaussian semivariogram model represented the highest potential strength of spatial dependence, with a higher MF (Seidel and Oliveira, 2014), which led to a wider scope of values for the SDI. The difference among the limits for the categories according to the many different models is consistent with the semivariograms, and it is not natural that we fix these limits among all of the possible models at the values proposed by Cambardella et al. (1994), because the spatial dependencies in those models are different. In this respect, the SDI categorization with its many different limits according to the semivariogram model is more reasonable than SPD categorization.
Based on real data obtained from selected papers, it was possible to obtain the distributions of SDI for spherical, exponential, and Gaussian models, respectively (Figure 1). In accordance with evaluation of figure 1, the proposed theoretical behavior based on the 169 theoretical values and the behavior observed from the real data are similar, highlighting the same positive asymmetry of the SDI in both cases, as well as the approximately equal values of the median and the 3rd quartile in both cases.
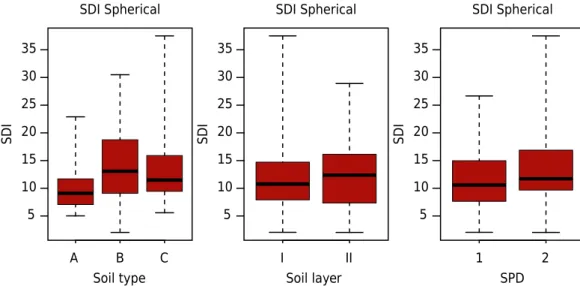
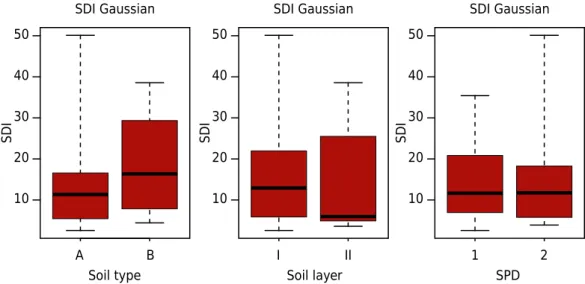
For different soil types, different soil layers, and different degrees of spatial dependence was calculated the SDI and its distribution evaluated for spherical model (Figure 2), exponential model (Figure 3) and Gaussian model (Figure 4), respectively.
In all cases there was a positive asymmetric distribution of SDI. Furthermore, the median values ranged from 9 to 13 in the spherical case, from 9 to 15 in the exponential case, and from 6 to 16 in the Gaussian case. The 3rd quartile values, for their part, ranged from 12 to 19 in the spherical case, from 13 to 21 in the exponential case, and from 17 to 29 in the Gaussian case. This shows that similar behavior is observed from the real data evaluated in different situations of soil types, soil layers, and spatial dependencies compared to the proposed classification based on these measures, despite some variation in values (between the determination of theoretical values of the SDI and the values obtained from sampling of papers).
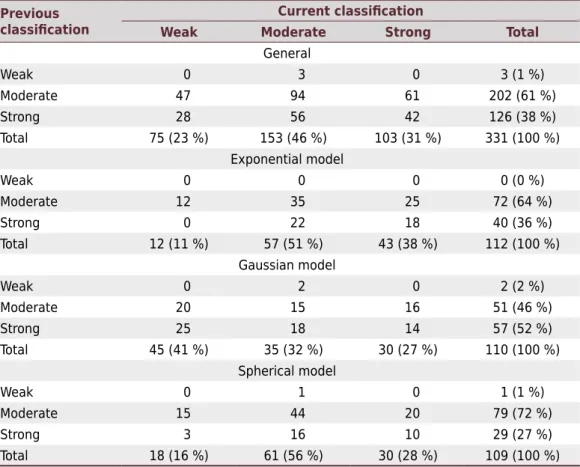
In addition to these results, we applied the current classification proposal from the SDI to the data of the research papers and made a comparison with the previous classification, given by Cambardella et al. (1994), as shown in Table 1.
Most of the classifications changed (58.9 %) (Table 1). The spherical model had fewer changes (50.5 %) and the Gaussian model showed higher classification change (73.6 %). Also, it can
C
SDI Spherical SDI Spherical SDI Spherical
Soil type 5
10 15 20 25 30 35
SDI
5 10 15 20 25 30 35
SDI
5 10 15 20 25 30 35
SDI
II
Soil layer SPD
A B I 1 2
Figure 2. Boxplot graphs of the distribution of the SDI for the spherical model in different soil
be observed that the weak classifications of spatial dependence increased and the moderate classifications decreased. Strong classifications did not show many changes. This is consistent with the positive asymmetric shape of the SDI. These changes between SDI and the classification of Cambardella et al. (1994) show that these two classifications are not equivalent.
Because of the short time for the scientific community to consider the use of SDI, few studies have used it yet. Pazini et al. (2015) was one of the first to use the SDI (Exponential and Gaussian form) to quantify the degree of spatial dependence, but with no classification defined at the time of producing the score. However, with the categorization proposed in this study, it is possible to classify the spatial dependence obtained in the study conducted by Pazini et al. (2015). Considering that SDIExponential (%) = 22.3 %, it would be classified
as indicating strong spatial dependence (SDIExponential (%) > 13 %); SDIGaussian (%) = 8.9 %
would indicate weak spatial dependence (SDIGaussian (%) ≤ 9 %); and SDIGaussian (%) of 44.5
to 50.4 % would indicate strong spatial dependence (SDIGaussian (%) > 20 %).
SDI Exponential SDI Exponential SDI Exponential
0 5 10 15 20 25 30
SDI
0 5 10 15 20 25 30
SDI
0 5 10 15 20 25 30
SDI
C Soil type
II
Soil layer SPD
A B I 1 2
Figure 3. Boxplot graphs of the distribution of the SDI for the exponential model in different
soil types, soil layers, and spatial dependencies, obtained from real data. Soil type: A = Ultisol (n = 44), B = Oxisol (n = 47), C = Others (n = 21). Soil layer: I = Surface layer (0.0-0.1, 0.0-0.2 m) (n = 71), II = Bottom layer (0.1-0.2, 0.15-0.30, 0.2-0.3, 0.2-0.4, 0.4-0.5, 0.4-0.6 m) (n = 34). SPD: 1 = 25 ≤ SPD ≤ 75 % (n = 72), 2 = SPD > 75 % (n = 40).
SDI Gaussian SDI Gaussian SDI Gaussian
10 20 30 40 50
SDI
10 20 30 40 50
SDI
10 20 30 40 50
SDI
Soil type
II
Soil layer SPD
A B I 1 2
Figure 4. Boxplot graphs of the distribution of the SDI for the Gaussian model in different soil
CONCLUSIONS
The SDI categorization was based on its median and 3rd quartile over a wide set of possible values, allowing to create a classification for spatial dependence as weak, moderate, or strong.
The proposed categorization allows the user to transform the numerical values calculated for the SDI into categories of degree of spatial variability, with adequate power for explanation and comparison.
REFERENCES
Aquino RE, Campos MCC, Marques Júnior J, Oliveira IA, Mantovaneli BC, Soares MDR. Geoestatística na avaliação dos atributos físicos em Latossolo sob floresta nativa e pastagem na Região de Manicoré, Amazonas. Rev Bras Cienc Solo. 2014;38:397-406. doi:10.1590/S0100-06832014000200004
Biondi F, Myers DE, Avery CC. Geostatistically modeling stem size and increment in an old-growth forest. Can J For Res. 1994;24:1354-68. doi:10.1139/x94-176
Camargo LA, Marques Júnior J, Pereira GT. Mineralogy of the clay fraction of Alfisols in two slope curvatures: III - Spatial variability. Rev Bras Cienc Solo. 2013;37:295-306. doi:10.1590/S0100-06832013000200001
Camargo LA, Marques Júnior J, Pereira GT. Spatial variability of physical attributes of an Alfisol under different hillslope curvatures. Rev Bras Cienc Solo. 2010;34:617-30. doi:10.1590/S0100-06832010000300003
Table 1. Comparison between previous classification (Cambardella et al., 1994) and current classification of spatial dependence, proposed in this study, applied to real data, for the spherical,
exponential, and Gaussian models(1)
Previous
classification Weak ModerateCurrent classificationStrong Total General
Weak 0 3 0 3 (1 %)
Moderate 47 94 61 202 (61 %)
Strong 28 56 42 126 (38 %)
Total 75 (23 %) 153 (46 %) 103 (31 %) 331 (100 %)
Exponential model
Weak 0 0 0 0 (0 %)
Moderate 12 35 25 72 (64 %)
Strong 0 22 18 40 (36 %)
Total 12 (11 %) 57 (51 %) 43 (38 %) 112 (100 %)
Gaussian model
Weak 0 2 0 2 (2 %)
Moderate 20 15 16 51 (46 %)
Strong 25 18 14 57 (52 %)
Total 45 (41 %) 35 (32 %) 30 (27 %) 110 (100 %)
Spherical model
Weak 0 1 0 1 (1 %)
Moderate 15 44 20 79 (72 %)
Strong 3 16 10 29 (27 %)
Total 18 (16 %) 61 (56 %) 30 (28 %) 109 (100 %)
(1) General: 41.1 % of the data showed no change. 58.9 % of the data showed change in classification; Exponential:
Cambardella CA, Moorman TB, Novak JM, Parkin TB, Karlen DL, Turco RF, Konopka AE.
Field-scale variability of soil properties in Central Iowa soils. Soil Sci Soc Am J. 1994;58:1501-11. doi:10.2136/sssaj1994.03615995005800050033x
Cavallini MC, Andreotti M, Oliveira LL, Pariz CM, Carvalho MP. Relações entre produtividade
de Brachiaria brizantha e atributos físicos de um Latossolo do cerrado. Rev Bras Cienc Solo.
2010;34:1007-15. doi:10.1590/S0100-06832010000400001
Costa NR, Passos e Carvalho M, Dal Bem EA, Dalchiavon FC, Caldas RR. Produtividade de laranja correlacionada com atributos químicos do solo visando a zonas específicas de manejo. Pesq Agropec Trop. 2014;44:391-8.
Dalchiavon FC, Carvalho MP, Montanari R, Andreotti M, Bem EA. Inter-relações da produtividade de cana soca com a resistência à penetração, umidade e matéria orgânica do solo. Rev Ceres. 2014;61:255-64. doi:10.1590/S0034-737X2014000200014
Dalchiavon FC, Carvalho MP, Montanari R, Andreotti M. Sugarcane productivity correlated with physical-chemical attributes to create soil management zone. Rev Ceres. 2013;60:706-14. doi:10.1590/S0034-737X2013000500015
Gontijo I, Nicole LR, Partelli FL, Bonomo R, Santos EOJ. Variabilidade e correlação espacial de micronutrientes e matéria orgânica do solo com a produtividade da pimenta-do-reino. Rev Bras Cienc Solo. 2012;36:1093-102. doi:10.1590/S0100-06832012000400004
Journel AG, Huijbregts CJ. Mining geostatistics. Caldwell: Blackburn Press; 2003. Landim PMB. Sobre Geoestatística e mapas. Terræ Didática. 2006;2:19-33.
Lima CGR, Carvalho MP, Narimatsu KCP, Silva MG, Queiroz HA. Atributos físico-químicos de um Latossolo do Cerrado brasileiro e sua relação com características dendrométricas do eucalipto. Rev Bras Cienc Solo. 2010;34:163-73. doi:10.1590/S0100-06832010000100017
Luciano RV, Albuquerque JA, Mafra ÁL, Costa A, Grah J. Water storage variability in a vineyard soil in the southern highlands of Santa Catarina state. Rev Bras Cienc Solo. 2014;38:82-93. doi:10.1590/S0100-06832014000100008
Montanari R, Passos e Carvalho M, Andreotti M, Dalchiavon FC, Lovera LH, Oliveira Honorato MA. Aspectos da produtividade do feijão correlacionados com atributos físicos do solo sob elevado nível tecnológico de manejo. Rev Bras Cienc Solo. 2010;34:1811-22. doi:10.1590/S0100-06832010000600005
Nascimento PS, Silva JA, Costa BRS, Bassoi LH. Zonas homogêneas de atributos do solo para o manejo de irrigação em pomar de videira. Rev Bras Cienc Solo. 2014;38:1101-13. doi:10.1590/S0100-06832014000400006
Olea RA. A six-step practical approach to semivariogram modeling. Stoch Env Res Risk A. 2006;20:307-18. doi:10.1007/s00477-005-0026-1
Oliveira IA, Campos MCC, Marques Junior J, Aquino RE, Teixeira DB, Silva DMP. Use of scaled semivariograms in the planning sample of soil chemical properties in Southern Amazonas, Brazil. Rev Bras Cienc Solo. 2015b;39:31-9. doi:10.1590/01000683rbcs20150525
Oliveira IA, Campos MCC, Soares MDR, Aquino RE, Marques Júnior J, Nascimento EP. Variabilidade espacial de atributos físicos em um Cambissolo Háplico, sob diferentes usos na região sul do Amazonas. Rev Bras Cienc Solo. 2013;37:1103-12. doi:10.1590/S0100-06832013000400027
Oliveira IA, Marques Junior J, Campos MCC, Aquino RE, Freitas L, Siqueira DS, Cunha JM. Variabilidade espacial e densidade amostral da suscetibilidade magnética e dos atributos de Argissolos da Região de Manicoré, AM. Rev Bras Cienc Solo. 2015a;39:668-81. doi:10.1590/01000683rbcs20140496
Pazini JB, Botta RA, Seidel EJ, Silva FF, Martins JFS, Barrigossi JAF, Rübenich R. Geoestatística aplicada ao estudo da distribuição espacial de Tibraca limbativentris em arrozal irrigado por
inundação. Cienc Rural. 2015;45:1006-12. doi:10.1590/0103-8478cr20140841
Resende JMA, Marques Júnior J, Martins Filho MV, Dantas JS, Siqueira DS, Teixeira DB.
Variabilidade espacial de atributos de solos coesos do leste maranhense. Rev Bras Cienc Solo. 2014;38:1077-90. doi:10.1590/S0100-06832014000400004
Rodrigues MS, Corá JE, Fernandes C. Soil sampling intensity and spatial distribution pattern of soils attributes and corn yield in no-tillage system. Eng. Agríc. 2012b;32:852-65. doi:10.1590/S0100-69162012000500005
Rodrigues MS, Corá JE, Fernandes C. Spatial relationships between soil attributes and corn yield in no-tillage system. Rev Bras Cienc Solo. 2012a;36:599-609. doi:10.1590/S0100-06832012000200029
Santos EOJ, Gontijo I, Silva MB, Drumond Neto AP. Variabilidade espacial de macronutrientes em uma lavoura de café conilon no Norte do Espírito Santo. Rev Cienc Agron. 2015;46:469-76. Seidel EJ, Oliveira MS. Medidas de dependência espacial baseadas em duas perspectivas do semivariograma paramétrico. Cienc Natura. 2015;37:20-7. doi:10.5902/2179460x18049 Seidel EJ, Oliveira MS. Novo índice geoestatístico para a mensuração da dependência espacial. Rev Bras Cienc Solo. 2014;38:699-705. doi:10.1590/S0100-06832014000300002
Silva Júnior JF, Marques Júnior J, Camargo LA, Teixeira DB, Panosso AR, Pereira GT. Simulação geoestatística na caracterização espacial de óxidos de ferro em diferentes pedoformas. Rev Bras Cienc Solo. 2012;36:1690-703. doi:10.1590/S0100-06832012000600003
Simões WL, Silva EL, Lima DM, Oliveira MS. Variabilidade espacial de atributos físicos de um Latossolo Vermelho distroférrico, submetido a diferentes manejos. Rev Bras Cienc Solo. 2006;30:1061-8. doi:10.1590/S0100-06832006000600015
Siqueira GM, Silva JS, Bezerra JM, Silva EFF, Dafonte JD, Melo RF. Estacionariedade do conteúdo de água de um Espodossolo Humilúvico. Rev Bras Eng Agric Amb. 2015;19:439-48. doi:10.1590/1807-1929/agriambi.v19n5p439-448
Soares A. Geoestatística para as ciências da terra e do ambiente. 2a ed. Lisboa: IST Press; 2006. Teixeira DB, Bicalho ES, Panosso AR, Perillo LI, Iamaguti JL, Pereira GT, La Scala Jr N.
Uncertainties in the prediction of spatial variability of soil CO2 emissions and related properties. Rev Bras Cienc Solo. 2012;36:1466-75. doi:10.1590/S0100-06832012000500010
Trangmar BB, Yost RS, Uehara G. Application of geostatistics to spatial studies of soil properties. Adv Agron. 1985;38:45-94. doi:10.1016/S0065-2113(08)60673-2
Vitória EL, Fernandes HC, Teixeira MM, Cecon PR, Lacerda EG. Correlação linear e espacial entre produtividade de Brachiaria brizantha, densidade do solo e porosidade
total em função do sistema de manejo do solo. Eng. Agric. 2012;32:909-19. doi:10.1590/S0100-69162012000500010