Ciência Rural, v.48, n.6, 2018.
Some aspects about the spatial dependence index for variability of soil attributes
Alguns aspectos sobre o índice de dependência espacial para variabilidade de atributos do solo
Eduardo Lucas Ensslin dos Santos
1Enio Júnior Seidel
1*Juliano de Bastos Pazini
2Marcelo Silva de Oliveira
3Edemar Appel Neto
3Ismael Canabarro Barbosa
1ISSNe 1678-4596
Received 10.05.17 Approved 04.18.18 Returned by the author 05.29.18
The soil attributes, determinants of
agricultural productivity and their impacts on
the environment, vary at space and/or time
(CAVALLINI et al., 2010). Usually, the evaluation
of this variability is done using the experimental
semivariogram and; consequently, of the estimation
of the model parameters of the semivariogram,
which, in most cases, are the nugget effect, the
contribution, the sill and the range (SEIDEL &
OLIVEIRA, 2013, 2014).
The range has the capacity of describing
the spatial variability in the horizontal direction
of the semivariogram, and this parameter can
be measured in meters, independently of the
attribute under study. This parameter indicates
the distance that the sampled points are correlated
(VIEIRA et al., 1983; RODRIGUES et al., 2012;
AQUINO et al., 2014). The nugget effect, the
contribution and the sill allow the evaluation of
the spatial variability in the vertical direction
of the semivariogram, depending, however, on
the unit of measure of the attribute under study,
making a general evaluation directly based on
its numerical values impossible. BIONDI et
al. (1994) and CAMBARDELLA et al. (1994)
proposed to relate these vertical parameters of
1Departamento de Estatística, Universidade Federal de Santa Maria (UFSM), 97105.900, Santa Maria, RS, Brasil. E-mail: enioseidel@gmail.com. *Corresponding author.
2Departamento de Fitossanidade, Universidade Federal de Pelotas (UFPel), Capão do Leão, RS, Brasil. 3Departamento de Estatística, Universidade Federal de Lavras (UFLA), Lavras, MG, Brasil.
ABSTRACT: The main purpose of this article was to evaluate the behavior and relationship of the range and components of SDI (Spatial Dependence Index) in general and in function of field factors such as soil types, type of attribute and soil layers. This evaluation was based on real data collected in national journals. It was noticed that the parameter range, in general and for different field factors, presented asymmetric positive behavior. The components of the SDI showed approximately symmetrical behavior. The SDI can capture the range behavior more intensely (the spatial variability behavior in the horizontal direction of the semivariogram), and, in a less intense way, the behavior of the contribution and sill parameters (the spatial dependence behavior in the vertical direction of the semivariogram). Thus, the SDI describes the behavior of spatial dependence of the total set of aspects of the semivariogram.
Key words: spatial dependence, geostatistics, semivariogram, field factors.
RESUMO: O objetivo deste artigo foi avaliar o comportamento e o relacionamento do alcance e dos componentes do IDE (Índice de Dependência Espacial) em geral e em função de fatores de campo, tais como tipos de solo, tipo de atributo e profundidades de solo. Esta avaliação foi baseada em dados reais coletados em periódicos nacionais. Foi observado que o parâmetro alcance, em geral, e para diferentes fatores de campo, apresentou comportamento de assimetria positiva. Os componentes do IDE apresentaram comportamento aproximadamente simétrico. O IDE consegue captar, de forma mais intensa, o comportamento do alcance (o comportamento da variabilidade espacial no sentido horizontal do semivariograma), e, de forma menos intensa, o comportamento dos parâmetros contribuição e patamar (o comportamento da dependência espacial no sentido vertical do semivariograma). Assim, o IDE descreve o comportamento de dependência espacial de toda a gama de aspectos do semivariograma.
Palavras-chave:dependência espacial, geostatística, semivariograma, fatores de campo.
the semivariogram to generate dimensionless
spatial dependence measures.
Recently, SEIDEL & OLIVEIRA (2014,
2016) proposed a dimensionless spatial dependence
index (SDI) to evaluate the spatial variability
contemplating all semivariogram parameters
under spherical, exponential and Gaussian models
adjustment. SEIDEL & OLIVEIRA (2014) carried
out theoretical and simulation studies that showed
good performance of the SDI in the measurement of
spatial variability.
However, a deeper assessment of the
components of the SDI index still needs to be
done. Thus, the objective of this article is to
evaluate the behavior and the relationship of the
range and the components of the SDI in general
and in function of some field factors (different
soil types, type of attribute and soil depths).
According to CHERUBIN et al. (2014), several
studies show how the spatial variability depends
on field factors, such as soil type or type of
attribute in study. ZANÃO JÚNIOR et al. (2010)
comments that soil depths also influenced spatial
variability. However, more field factors, such as
relief type or land use and management, should be
considered in future studies.
The data were obtained from 25 articles,
published from 2006 to 2015 and made available
on the Scielo Brazil portal, with application of
Geostatistics in Soil attributes, used and cited in
SEIDEL & OLIVEIRA (2016). From the papers,
the following information was collected for each
attribute: model of semivariogram adjusted,
estimated range (a), estimated nugget effect
(C
0), estimated contribution (C
1), estimated sill
(C=C
0+C
1), maximum sample distance (MD),
soil type, type of attribute (chemical, physical
or mineralogical) and soil layer (depth). In this
way, it was possible to obtain the SDI and its
two components:
+
1 01
C
C
C
and
.
The mathematical expression of the SDI and its
respective classification of the spatial dependence
are detailed in SEIDEL & OLIVEIRA (2016).
A total of 587 attributes were raised
in the search, and in 275 of them (corresponding
to 46.85% of the total) the spherical model was
adjusted; in 123 (20.95%) the exponential model
was used; in 102 (17.38%) attributes the Gaussian
model was adjusted and; in 87 (14.82%) the pure
nugget effect model was used. MONTANARI et
al. (2008) reported that several surveys of spatial
variability of soils used prominently spherical and
exponential models. As an estimation, it is possible
to highlight the spherical model as one of greater
use. This model is what predominates in studies
in Soil Sciences (GREGO & VIEIRA, 2005;
GONTIJO et al., 2012). In addition, considering
the exponential, Gaussian and spherical model
adjustments (500 attributes), regardless of the
type of attribute studied (whether chemical,
physical or mineralogical), the spherical model
is the predominate in semivariogram adjustments
(54.37% in chemical attributes, 53.82% in physical
attributes, 64.44% in mineralogical attributes).
From the sampling of range values and
the obtainment of the components of the SDI,
statistical analyzes of this information were carried
out, through descriptive measures. The Spearman
correlations between range,
0 11
C
C
C
+
,
and
SDI were calculated and tested (p<0.05). Data
analysis procedures were performed in the software
R (R CORE TEAM, 2016).
Sample distribution of the range is a
positive asymmetry, with an asymmetry coefficient
equal 2.12 and a median of the range equals to 39m
(Table 1). The same behavior of positive asymmetry
is evident for the range in different semivariogram
models (spherical, exponential and Gaussian), soil
types, chemical and physical attributes and soil
layers (Table 1).
Considering the median of the range
as a comparative measure, the ultisol (median of
48.69m) has a higher value than the oxisol (median
of 18.90m) (Table 1). This greater spatial continuity
may be due to the shape of the landscape that the soil
classes are inserted (CAMARGO et al., 2010, 2013;
SILVA JUNIOR et al., 2012;
RESENDE et al., 2014).
MONTANARI et al. (2008) noticed higher values of
range for chemical soil attributes in areas with linear
pedoform (ultisol) compared to areas with convex
pedoform (oxisol).
Another important observation, from table
1, is that the range has higher median values for
bottom soil layers. This can be explained by the fact
that deeper layers have less spatial discontinuity of
the soil attributes, since they are less susceptible to
the effects of surface management, thus maintaining
their original characteristics of homogeneity (LEÃO
et al., 2007).
mineralogical attributes (median of 30.50m) (Table 1).
The value of the range influences the quality of the
estimation (COSTA et al., 2014) and has application
in the planning of samples (ZANÃO JÚNIOR et
al., 2010). AQUINO et al. (2014) and OLIVEIRA
et al. (2015a, b) demonstrated the applicability of
the range in the definition of sampling densities for
future studies.
Table 1 - Descriptive measures of the range (m),MD
a
5
.
0
(#) and 0 11
C
C
C
+
($), in general and in different semivariogram models, soil types, type of attribute and soil layers.
Situation Measure Minimum Median Maximum Mean±SD1 CA2
General (n=500)
Range (m) 8.00 39.00 399.00 54.61±50.80 2.12
# 0.03 0.51 1.00 0.56±0.29 0.19
$ 0.20 0.67 1.00 0.67±0.20 0.09
Exponential model (n=123)
Range (m) 8.80 27.60 248.70 46.22±47.13 2.37
# 0.03 0.47 1.00 0.54±0.28 0.31
$ 0.34 0.69 1.00 0.70±0.17 0.17
Gaussian model (n=102)
Range (m) 10.00 20.48 240.00 41.98±42.11 1.99
# 0.08 0.33 1.00 0.44±0.32 0.63
$ 0.21 0.76 1.00 0.73±0.21 -0.34
Spherical model (n=275)
Range (m) 8.00 47.60 399.00 63.05±53.82 2.05
# 0.07 0.60 1.00 0.62±0.27 0.15
$ 0.20 0.62 1.00 0.64±0.20 0.26
Oxisol soil (n=171)
Range (m) 8.00 18.90 399.00 40.73±53.40 3.43
# 0.03 0.36 1.00 0.46±0.32 0.47
$ 0.25 0.70 1.00 0.71±0.20 -0.01
Ultisol soil (n=260)
Range (m) 12.90 48.69 248.70 64.39±50.06 1.50
# 0.20 0.57 1.00 0.62±0.26 0.28
$ 0.20 0.63 1.00 0.63±0.19 0.20
Other soils (n=69)
Range (m) 8.80 48.30 188.40 52.19±37.60 1.07
# 0.18 0.55 1.00 0.60±0.27 0.28
$ 0.25 0.71 1.00 0.73±0.19 -0.05
Surface soil layer** (n=342)
Range (m) 8.10 34.74 295.20 51.35±47.46 2.03
# 0.03 0.50 1.00 0.55±0.28 0.27
$ 0.20 0.67 1.00 0.66±0.20 0.06
Bottom soil layer*** (n=158)
Range (m) 8.00 43.45 399.00 61.69±56.92 2.14
# 0.03 0.54 1.00 0.59±0.31 0.01
$ 0.20 0.66 1.00 0.69±0.20 0.14
Chemical atribute (n=206)
Range (m) 8.00 40.00 399.00 59.49±60.07 2.06
# 0.03 0.47 1.00 0.51±0.33 0.22
$ 0.20 0.63 1.00 0.65±0.20 0.06
Physical atribute (n=249)
Range (m) 8.80 38.00 295.20 54.02±45.77 1.62
# 0.18 0.56 1.00 0.60±0.26 0.33
$ 0.20 0.67 1.00 0.68±0.21 0.12
Mineralogical atribute (n=45)
Range (m) 16.60 30.50 70.15 35.58±13.30 0.69
# 0.23 0.43 1.00 0.56±0.26 0.62
$ 0.36 0.68 1.00 0.69±0.13 0.13
As regards the
, a slightly
symmetrical behavior was observed, in general,
with a median of 0.51 and an asymmetry
coefficient of 0.19 (Table 1). Also, this component
showed more median value for the spherical
semivariogram model; Ultisol had a higher
median value when compared to oxisol; Both
soil depths have very close median values for
this component; Physical attributes had a higher
median value when compared to chemical and
mineralogical attributes (Table 1).
The component
1 0 1C
C
C
+
showed an
approximately symmetrical behavior, in general,
with asymmetry coefficient equal 0.09 and median
of 0.67, and for the all semivariogram models,
except for the Gaussian model that presented
negative asymmetry, with a coefficient of
asymmetry equal -0.34 (Table 1).
Considering the different types of soil,
it can be seen from table 1 that
0 1 1C
C
C
+
has a
higher median value in the oxisol (0.70) than in
the ultisol (0.63).
Another emphasis was that the median
values of
0 11
C
C
C
+
did not vary for different soil
depths. This result differs from that obtained by
GREGO & VIEIRA (2005) and ZANÃO JÚNIOR
et al. (2010) who observed differences in spatial
dependence for different soil depths. The component
1 0 1
C
C
C
+
has higher median values in the all the types
of attributes (Table 1).
Amplitud of the component
0 11
C
C
C
+
,
in general, ranged from 0.20 to 1.00, showing
that this component does not tend to present
low values in practice. Based on this, taking
into account that the
0 1 1C
C
C
+
also generates
the measure proposed in BIONDI et al. (1994),
which is used together with the classification
of CAMBARDELLA et al. (1994), it tends to
consider more attributes as having greater spatial
dependence (that is, with a degree of spatial
dependence tending to be stronger) than would
occur in reality. In addition, it is emphasized
that, in the Gaussian model, there is a greater
tendency of strong classifications of spatial
dependence, when compared with the other two
semivariogram models.
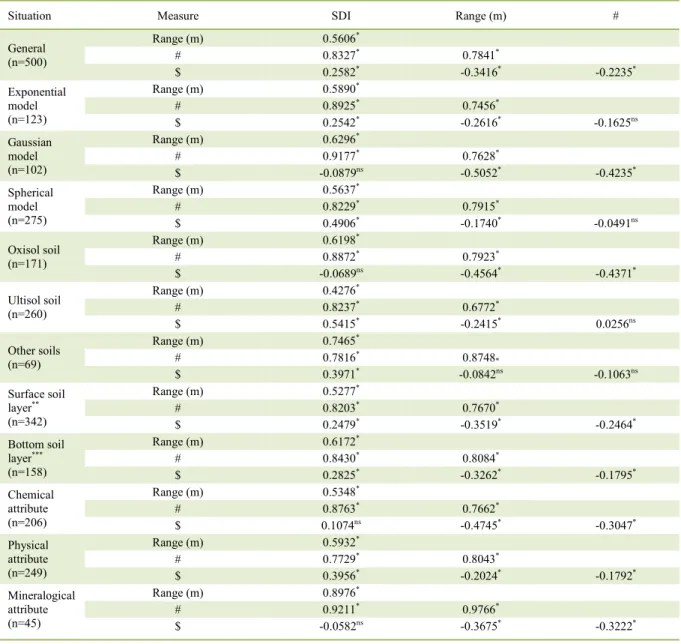
Based on table 2, it can be shown that, in
general and for different field factors, the correlations
between the range and the SDI index are moderately
or strongly positive, and all significant (p<0.05).
The SDI index has a positive asymmetric sampling
distribution (SEIDEL & OLIVEIRA, 2016) similar
to what occurs with the range, explaining results
obtained by the correlations. The correlations between
and SDI are all strongly positive, and
all significant (p<0.05). However, the correlations
between
0 11
C
C
C
+
and SDI are weak or moderate (and
most of the time are positive).
Furthermore, it can be seen from
table 2 that only weak or moderate and negative
correlations occurred between
0 11
C
C
C
+
and
range. This means that where we have greater
values of the range it could occur lower values of
1 0 1
C
C
C
+
and vice versa, showing that using only
the range (horizontal spatial dependence of the
semivariogram) or using only
0 11
C
C
C
+
(vertical
spatial dependence of the semivariogram) is not
the most adequate method of describing the spatial
variability of attributes.
Results obtained from the correlations
indicated that the SDI is able to capture, in an intense
way, the behavior of the range and the
when evaluating the spatial dependence, evidencing
also the behavior in the horizontal sense of the
semivariogram. This is an important feature
of the SDI index, which differentiates it from
other indexes in the literature, since according to
FERRAZ et al. (2012) the range has a considerable
role in determining the limit of spatial dependence.
In addition, the SDI also succeeds in capturing,
in a less intense way, the behavior of
0 1 1C
C
C
+
Table 2 - Correlations (Spearman) between SDI, range (m),
MD
a
5
.
0
(#) and 0 11
C
C
C
+
($), in general and in different semivariogram models, soil types, type of attribute and soil layers.
Situation Measure SDI Range (m) #
General (n=500)
Range (m) 0.5606*
# 0.8327* 0.7841*
$ 0.2582* -0.3416* -0.2235*
Exponential model (n=123)
Range (m) 0.5890*
# 0.8925* 0.7456*
$ 0.2542* -0.2616* -0.1625ns
Gaussian model (n=102)
Range (m) 0.6296*
# 0.9177* 0.7628*
$ -0.0879ns -0.5052* -0.4235*
Spherical model (n=275)
Range (m) 0.5637*
# 0.8229* 0.7915*
$ 0.4906* -0.1740* -0.0491ns
Oxisol soil (n=171)
Range (m) 0.6198*
# 0.8872* 0.7923*
$ -0.0689ns -0.4564* -0.4371*
Ultisol soil (n=260)
Range (m) 0.4276*
# 0.8237* 0.6772*
$ 0.5415* -0.2415* 0.0256ns
Other soils (n=69)
Range (m) 0.7465*
# 0.7816* 0.8748*
$ 0.3971* -0.0842ns -0.1063ns
Surface soil layer** (n=342)
Range (m) 0.5277*
# 0.8203* 0.7670*
$ 0.2479* -0.3519* -0.2464*
Bottom soil layer*** (n=158)
Range (m) 0.6172*
# 0.8430* 0.8084*
$ 0.2825* -0.3262* -0.1795*
Chemical attribute (n=206)
Range (m) 0.5348*
# 0.8763* 0.7662*
$ 0.1074ns -0.4745* -0.3047*
Physical attribute (n=249)
Range (m) 0.5932*
# 0.7729* 0.8043*
$ 0.3956* -0.2024* -0.1792*
Mineralogical attribute (n=45)
Range (m) 0.8976*
# 0.9211* 0.9766*
$ -0.0582ns -0.3675* -0.3222*
CONFLICTS OF INTEREST
The authors declare no conflict of interest.
REFERENCES
AQUINO, R.E. et al. Geostatistics in assessment of physical properties in a latossolo (oxisol) under native forest and grassland in Manicoré, Amazonas, Brazil. Revista Brasileira de Ciência do Solo, v.38, p.397-406, 2014. Available from: <http://www.scielo.br/pdf/rbcs/v38n2/04.pdf>. Accessed: Jul. 18, 2017. doi: 10.1590/S0100-06832014000200004.
BIONDI, F. et al. Geostatistically modeling stem size and increment in an old-growth forest. Canadian Journal of Forest Research, v.24, p.1354-1368, 1994.
CAMARGO, L.A. et al. Spatial variability of physical attributes of an alfisol under different hillslope curvatures.
Revista Brasileira de Ciência do Solo, v.34, p.617-630, 2010. Available from: <http://www.scielo.br/scielo.php?script=sci_ arttext&pid=S0100-06832010000300003>. Accessed: Jul. 18, 2017. doi: 10.1590/S0100-06832010000300003.
CAMARGO, L.A. et al. Mineralogy of the clay fraction of Alfisols in two slope curvatures: III - spatial variability.
Revista Brasileira de Ciência do Solo, v.37, p.295-306, 2013. Available from: <http://www.scielo.br/pdf/rbcs/v37n2/ a01v37n2.pdf>. Accessed: Jul. 18, 2017. doi: 10.1590/S0100-06832013000200001.
CAMBARDELLA, C.A. et al. Field-scale variability of soil properties in Central Iowa soils. Soil Science Society of America Journal, v.58, p.1501-1511, 1994. Available from: <http://dl.sciencesocieties.org/publications/sssaj/abstracts/58/5/ SS0580051501>. Accessed: Jun. 10, 2017. doi: 10.2136/sssaj199 4.03615995005800050033x.
CAVALLINI, M.C. et al. Relationships between yield of Brachiaria brizantha and physical properties of a savannah oxisol. Revista Brasileira de Ciência do Solo, v.34, p.1007-1015, 2010. Available from: <http://www.scielo.br/pdf/rbcs/ v34n4/01.pdf>. Accessed: Jul. 20, 2017. doi: 10.1590/S0100-06832010000400001.
CHERUBIN, M.R. et al. Efficiency of sampling grids used in the characterization of phosphorus and potassium. Ciência Rural, v.44, p.425-432, 2014. Available from: <http://www. scielo.br/pdf/cr/v44n3/a6414cr2013-0771.pdf>. Accessed: Jul. 18, 2017. doi: 10.1590/S0103-84782014000300007.
COSTA, N.R. et al. Orange yield correlated with soil chemical
attributes aiming specific management zones. Pesquisa Agropecuária Tropical, v.44, p.391-398, 2014. Available from: <http://www.scielo.br/pdf/pat/v44n4/v44n4a01.pdf>. Accessed: Jul. 18, 2017. doi: 10.1590/S1983-40632014000400001. FERRAZ, G.A.S. et al. Spatial and temporal variability of
phosphorus, potassium and of the yield of a coffee field.
Engenharia Agrícola, v.32, p.140-150, 2012. Available from: <http://www.scielo.br/pdf/eagri/v32n1/15.pdf>. Accessed: Jul. 15, 2017. doi:10.1590/S0100-69162012000100015.
GONTIJO, I. et al. Variability and spatial correlation among micronutrientes and organic matter and yield of black pepper.
Revista Brasileira de Ciência do Solo, v.36, p.1093-1102, 2012. Available from: <http://www.scielo.br/pdf/rbcs/ v36n4/04.pdf>. Accessed: Jul. 18, 2017. doi: 10.1590/S0100-06832012000400004.
GREGO, C.R.; VIEIRA, S.R. Spatial variability of soil physical properties on an experimental plot. Revista Brasileira de Ciência do Solo, v.29, p.169-177, 2005. Available from: <http://www.scielo.br/pdf/rbcs/ v29n2/24153.pdf>. Accessed: Jul. 18, 2017. doi: 10.1590/ S0100-06832005000200002.
LEÃO, A.B. et al. Spatial variability of phosphorus in soil from irrigated perimeter Engenheiro Arcoverde, PB. Revista Ciência Agronômica, v.38, p.1-6, 2007.
MONTANARI, R. et al. Spatial variability of chemical attributes in latosol and argisol. Ciência Rural, v.38, p.1266-1272, 2008. Available from: <http://www.scielo.br/pdf/cr/ v38n5/a10v38n5.pdf>. Accessed: Jul. 18, 2017. doi: 10.1590/ S0103-84782008000500010.
OLIVEIRA, I.A. et al. Spatial variability and sampling density of magnetic susceptibility and soil properties in ultisols of the Manicoré region, AM, Brazil. Revista Brasileira de Ciência do Solo, v.39, p.668-681, 2015a. Available from: <http://www.scielo.br/pdf/rbcs/v39n3/0100-0683-rbcs-39-3-0668.pdf>. Accessed: Jul. 18, 2017. doi: 10.1590/01000683rbcs20140496.
OLIVEIRA, I.A. et al. Use of scaled semivariograms in the planning sample of soil chemical properties in Southern Amazonas, Brazil. Revista Brasileira de Ciência do Solo, v.39, p.31-39, 2015b. Available from: <http://www.scielo.br/ pdf/rbcs/v39n1/0100-0683-rbcs-39-1-0031.pdf>. Accessed: Jul. 18, 2017. doi: 10.1590/01000683rbcs20150525.
R CORE TEAM. R: A language and environment for statistical computing. Vienna: R Foundation for Statistical Computing, 2016. Available from: <http://www.R-project.org/>. Accessed: Jul. 18, 2017.
RESENDE, J.M.A et al. Spatial variability of the properties of cohesive soils from eastern Maranhão, Brazil. Revista Brasileira de Ciência do Solo, v.38, p.1077-1090, 2014. Available from: <http://www.scielo.br/pdf/rbcs/v38n4/04. pdf>. Accessed: Jul. 15, 2017. doi: 10.1590/S0100-06832014000400004.
RODRIGUES, M.S. et al. Spatial relationships between soil attributes and corn yield in no-tillage system. Revista Brasileira de Ciência do Solo, v.36, p.599-609, 2012. Available from: <http://www.scielo.br/pdf/rbcs/v36n2/ a29v36n2.pdf>. Accessed: Jul. 18, 2017. doi: 10.1590/S0100-06832012000200029.
SEIDEL, E.J.; OLIVEIRA, M.S. Proposal of a generalization for exponential and Gaussian semivariogram models. Semina: Ciências Exatas e Tecnológicas, v.34, p.125-132, 2013. Available from: <http://www.uel.br/revistas/uel/index.php/ semexatas/article/view/14114/13258>. Accessed: Jul. 18, 2017. doi: 10.5433/1679-0375.2013v34n1p125.
scielo.br/pdf/rbcs/v38n3/02.pdf>. Accessed: Jun. 10, 2017. doi: 10.1590/S0100-06832014000300002.
SEIDEL, E.J.; OLIVEIRA, M.S. A classification for a
geostatistical index of spatial dependence. Revista Brasileira de Ciência do Solo, v.40, e0160007, 2016. Available from: <http://www.scielo.br/pdf/rbcs/v40/1806-9657-rbcs-40-e0160007.pdf>. Accessed: Jul. 18, 2017. Epub. Dec. 15, 2016. doi: 10.1590/18069657rbcs20160007.
SILVA JUNIOR, J.F. et al. Geostatistical simulation for the spatial characterization of iron oxides in different landforms.
Revista Brasileira de Ciência do Solo, v.36,
p.1690-1703, 2012. Available from: <http://www.scielo.br/pdf/rbcs/ v36n6/03.pdf>. Accessed: Jul. 18, 2017. doi: 10.1590/S0100-06832012000600003.
VIEIRA, S.R. et al. Geostatistical theory and application to variability of some agronomical properties. Hilgardia, v.51, p.1-75, 1983.