ISSN: 1809-4430 (on-line)
_________________________
1 Universidade Federal da Grande Dourados –UFGD/Dourados –MS, Brasil.
PENETRATION RESISTANCE AND AGRONOMIC CHARACTERISTICS OF SOYBEAN AFFECTED BY SOIL MANAGEMENT AND SOWING SPEED SYSTEMS
Doi:http://dx.doi.org/10.1590/1809-4430-Eng.Agric.v36n4p 664-672/2016
JORGE W. CORTEZ1*, RODRIGO G. CHAVES1, ROBERTO C. ORLANDO1, CRISTIANO M. A. DE SOUZA1, PAULO H. N. DE SOUZA1
ABSTRACT: With the short period of the sowing process, we observed an increase in the seeder
speed set in several soil management systems that may result in decreased soybean yield and problems with penetration resistance. We aimed to assess the penetration resistance (PR) and agronomic characteristics of soybean on soil tillage and sowing speed. The randomized block design in split plot with four replications was used. The treatments consisted of six management systems, applied to the plots: no tillage (NT), no tillage and chiseling (NTc), no tillage and cross chiseling (NTcc), conventional tillage (CT), reduced tillage (RT) and conservation tillage (CsT) and four speeds, (4.6; 5.5; 7,3 and 7.8 km h-1) applied in the subplot at the time of soybean seeding. We observed in the deep layers 0.0 – 0.10; 0.10 – 0.20 and 0.20 – 0.30 m significant effect of tillage systems on the PR of the soil. The NT system showed the highest value of PR compared to other management systems studied. In the NT should be used sowing speeds above 5.5 km h-¹ to decrease the compression. Low speeds favor higher yield by improving pods per plant.Speeds in the working range (5-7 km h-1) promote higher productivity by improving the number of pods per plant, and provide better stand.
KEY WORDS: agricultural mechanization, no tillage, yield.
INTRODUCTION
The competitiveness and sustainability of agricultural production systems have led farmers to seek ways to enhance their crops, using preparation systems that harm less the soil, due to the erosion and degradation, promoted by periodical preparation (BELLÉ et al., 2014). Due to the increasing use by farmers of systems that have less mobilization, such as no tillage (NT), many areas began to show compaction problems associated with no soil inversion (MUZARANA et al., 2011), which has resulted in productivity decrease (ROBOREDO et al., 2010).
Systems with minimum tillage, such as NT, showed higher grain yield when compared to minimum tillage and conventional tillage (PEREIRA et al., 2011). The fact that the highest grain yield in NT may be related to the speed of seedling emergence that is superior when compared to the conventional system, and may be associated with the lack of vegetation, so sealing or superficial crusting effect may occur (LIMA et al., 2010).
MUZARANA et al. (2011) when evaluated tillage systems in Oxisol, observed that the bulk density was lower in tillage systems with greater mobilization, showing the lowest values for the NT, which has been adopted to replace conventional tillage in order to mitigate soil degradation problems. The NT has shown over the years problems of subsurface compaction due to minimum soil inversion, which is restricted to row sowing (ROSA et al., 2011). In this context, the determination of compression is essential in scientific studies that evaluate the machine-soil-plant relation (LIMA et al., 2013).The penetration resistance is an attribute that allows to view the areas that show greater or lesser easiness of root penetration (SILVEIRA et al., 2010), and it is important its knowledge for proper management.
665
justified by the fact that these can influence the final plant stand and even productivity. This demonstrates and justifies the need for studies of the interaction of soil management and sowing speed systems.
Therefore, we aimed to evaluate the soil management and sowing speed of soybean, and their effects on agronomic components and penetration resistance.
MATERIAL AND METHODS
The study was carried out at the Experimental Farm of Agricultural Sciences - FAECA, of the Federal University of Grande Dourados - UFGD located in the municipality of Dourados, MS, Brazil. The site is located at latitude 22º14'S, longitude 54º59'W and altitude of 434 m. The climate is Cwa, according to the Köppen classification. The soil of the area is Dystroferric Oxisol (EMBRAPA, 2013), clay texture (62.23% of clay, 20.43% of silt, 17.34% of sand). The average moisture of the soil profile at the time of collection of the penetration resistance was 15.67%.
In the plots preparation of the soil management systems for the experiment in the 2013/2014 harvest, we used: Chisel plow of five shank, with narrow tip of 0.08 m of width and 0.35 m of depth (chiseling treatment); moldboard plow cut with 0.40 cm of depth (conventional preparation); off-set disk harrow with 20 disks of 0.51 m of diameter (20") in each section, at the front section cut discs and plain discs at the rear, at a depth of 0.15 m ( conventional, reduced and cross chiseling preparation). For the preparation operations, we used a tractor with 67.71 kW (92 hp) of nominal power in the engine at a rotation of 2400 rpm, and a tractor with 89.79 kW (122 hp) of nominal power in the engine at a rotation of 2200 rpm in the chiseling operation.
The seeder-fertilizer was used with pneumatic system of seeds distribution, shank furrow for fertilizer, with seven rows spaced 0.45 m, doser fertilizer of helicoid type, discs for 60 holes seeds, and dual wheels (V) angulated for compression. The seeder was set to distribute 16 seeds per meter, of the VTOP cultivar (RR), with 99% of purity and 80% of germination at a depth of 0.05 m.
The seeds were treated with insecticide, 125g of Thiamethoxam per 100 kg of seeds. The inoculation was carried out directly via seed, using the peat inoculant with the Bradyrhizobium
elkanii SEMIA 587 strain, in bacterial population of 3.0 x 10⁹ cels g-1, according to the standard
method. In the fertilization, we used the 0-20-20 formulated in the regulation of 300 kg ha-1.The area was previously desiccated with mechanized application of glyphosate-based herbicides (3L ha-1) and 2.4 D (0,8 L ha-1). During the harvest, the pest control in the crop was carried out with Flubendiamide 0.3 L ha-1, Methomyl 0.5 L ha-1 and disease using a combination of Azoxystrobin + Cyproconazole 0.3 L ha-1 and Pyraclostrobin + Epoxiconazole 0, 5 L ha-1.
We used the randomized blocks design in a split plot with four replications. The treatments consisted of six management systems, applied in the plots (Table 1). The speeds applied in the subplot at the time of soybean planting, defined by the tractor speed scaling, were 4.6; 5.5; 7.3 and 7.8 km h-1.
Each plot occupied an area of 15 m of wide and 19 m of length (285 m2). In the longitudinal direction between the plots, a space of 12 m was reserved for the maneuvers, machinery traffic and stabilization of the sets.
The soil penetration resistance data (PR) were collected, in a point in the central region of each subplot by an impact penetrometer, with the following characteristics: mass of 4 kg with impact in free fall course of 0.40 m; cone with 0.0128 m of diameter and solid angle of 30º; and shank with a diameter of approximately 0.01 m. The PR data were recorded up to the depth of 0.60 m and converted to MPa.
The stand of plants was obtained from the number of emerged seedlings count after the stabilization, in a meter in the central row of each subplot. The number of pods per plant was obtained by direct counting in three plants per plot, obtaining the final a verage.
The plants were harvested in one meter in the central row to obtain the productivity, which were threshed and their masses measured separately by subplot and their values corrected to 13% of moisture, using the mass formula of dry product produced per wet product unit, which consists of 100 minus the initial humidity divided by 100 minus the final moisture, with the result of this division, this is multiplied by the mass of the initial grains.
The data analysis was carried out by the variance analysis and later, when significant, with the Tukey test at 5% probability to compare averages. The data that were significant in the F test for sowing speed were applied polynomial regression analysis. The Assistat software Version 7.7 Beta (SILVA & AZEVEDO, 2002) was used.
RESULTS AND DISCUSSION
In the depth layers of 0.0 – 0.10; 0.10 – 0.20 and 0.20 – 0.30 m occurred significant effect of management systems on the soil PR (Table 2). In these layers, the NT system showed the highest PR value in comparison to the other management systems studied. In the depth layers of 0.30 - 0.40 m occurred significant effect of management systems studied on soil PR, being the NTc and NTcc systems with the highest value (Table 2). According to LIMA et al., (2010), values from 1.9 MPa can affect the plants height in the soybean crop, a value below the ones found in this study, especially in the depth layers of 0.20 – 0.30 and 0.30 – 0.40 m. In general, when observing the PR values in the studied layers, for the NT, it is notorious that they are above of the considered critical to the development of the root system, it may be justified because it is a system with a minimum tillage, particularly in the depth layer of 0.20 to 0.30 m. CHEBURIN et al. (2011) found similar results and when they studied the soil PR variability, they found values higher than the considered critical to a depth of 0.40 m; and also by DRESCHER et al. (2012). In the depth layers of 0.40 –
667
TABLE 2. Variance analysis and average tests for the soil penetration resistance (MPa). Layers (m)
0.0-0.10 0.10-0.20 0.20-0.30 0.30-0.40 0.40-0.50 0.50-0.60 Management (M)
NT 2.23a 4.85 a 5.86 a 4.39 a 4.81 5.10
NTc 1.39 b 1.98 b 2.61 b 4.05 ab 5.06 5.61
NTcc 1.22 b 1.94 b 3.08 b 4.17 a 5.02 6.24
CsT 1.26 b 1.94 b 2.74 b 3.41 ab 4.60 5.99
RT 1.35 b 2.23 b 3.20 b 3.80 ab 5.10 5.91
CT 1.05 b 1.86 b 2.49 b 2.91 b 3.80 4.90
F test
Management 17.27 ** 23.88 ** 22.88 ** 4.23 * 1.67 NS 2.05 NS
Speed (S) 0.89 NS 3.67 * 3.09 * 4.53 ** 13.59 ** 9.08 **
MxS 1.93 * 1.59 NS 1.24 NS 1.35 NS 1.38 NS 1.04 NS
C.V. M (%) 28.22 38.96 31.86 27.95 32.39 26.27
C.V. S (%) 25.15 24.32 26.52 30.75 23.17 22.23
NS: not significant (p>0.05); *: significant (p>0.05); *: significant (p>0.01); C.V: coefficient of variation
No tillage (NT); No tillage and chiseling (NTc); no tillage cross chiseling (NTcc); conventional tillage (CT); reduced tillage (RT); and conservation tillage (CsT). Lowercase letters in the same column and equal, do not differ from each other by the Tukey test at 5% probability.
km h-1 occurred significant effect on the soil PR and we observed the lowest values of soil PR for the CT system, which can be justified by the management system that had the most soil tillage.
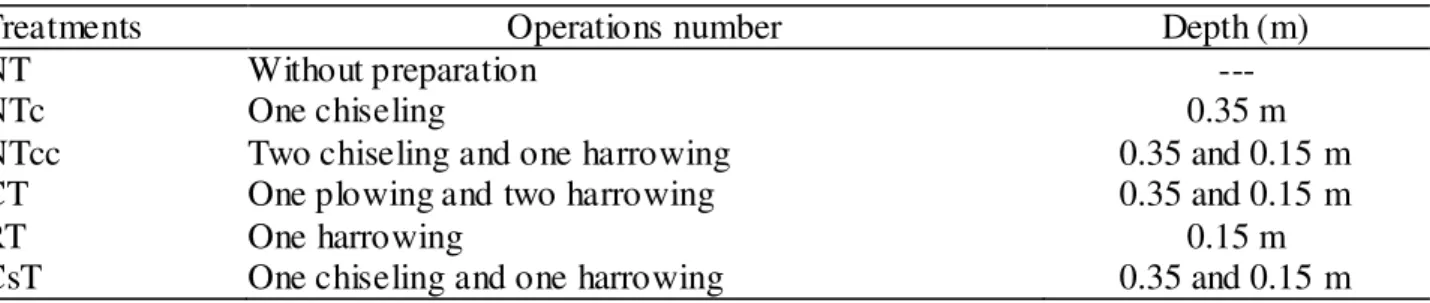
TABLE 3. Unfolding of the management x speed interaction for soil penetration resistance (MPa) in the layer of 0.00 – 0.10m.
Managements 4.6 5.5 Speeds (km h-¹) 7.3 7.8
0.0-0.10 m
NT 2.91 a 1.90 a 1.90 a 2.24 a
NTc 1.39 b 1.73 ab 1.22 ab 1.22 b
NTcc 1.22 b 1.22 ab 1.22 ab 1.22 b
CsT 1.22 b 1.39 ab 1.39 ab 1.05 b
RT 1.39 b 1.39 ab 1.39 ab 1.22 b
CT 0.88 b 1.05 b 1.05 b 1.22 b
Averages followed by the same letter, lowercase in columns do not differ from each other by Tukey test at 5% probability of error. No tillage (NT); No tillage and chiseling (NTc); no tillage cross chiseling (NTcc); conventional tillage (CT); reduced tillage (RT); and conservation tillage (CsT).
FIGURE 2. Penetration resistance (MPa) in the layer of 0.00-0.10 m for the no tillage system (NT) depending on the displacement speed.
669
TABLE 4. Summary of the analysis of variance values and the average test for pods per plant, shoot dry matter and grain yield.
Factor Stand
(plants per meter) Pods per plant
Productivity (kg ha-1) Management (M)
NT 9.44 38.64 a 2658.85
NTc 10.87 32.45 b 2555.82
NTcc 11.75 34.93 ab 2626.96
CsT 9.75 34.70 ab 2739.87
RT 10.25 31.27 b 2702.26
CT 10.25 38.68 a 2658.99
F test
M 2.12 NS 7.64 ** 0.22 NS
Speeds (S) 5.23 ** 10.97 ** 4.92 **
MxS 0.97 NS 3.97 ** 1.77 NS
C.V. M (%) 21.78 12.66 20.24
C.V. S (%) 21.70 16.87 20.27
NS: not significant (p>0.05); *: significant (p>0.05); *: significant (p>0.01); C.V: coefficient of variation. No tillage (NT); No tillage
and chiseling (NTc); no tillage cross chiseling (NTcc); conventional tillage (CT); reduced tillage (RT); and conservation tillage (CsT). Averages followed by the same letter, lowercase in columns do not differ from each other by Tukey test at 5% probability of error.
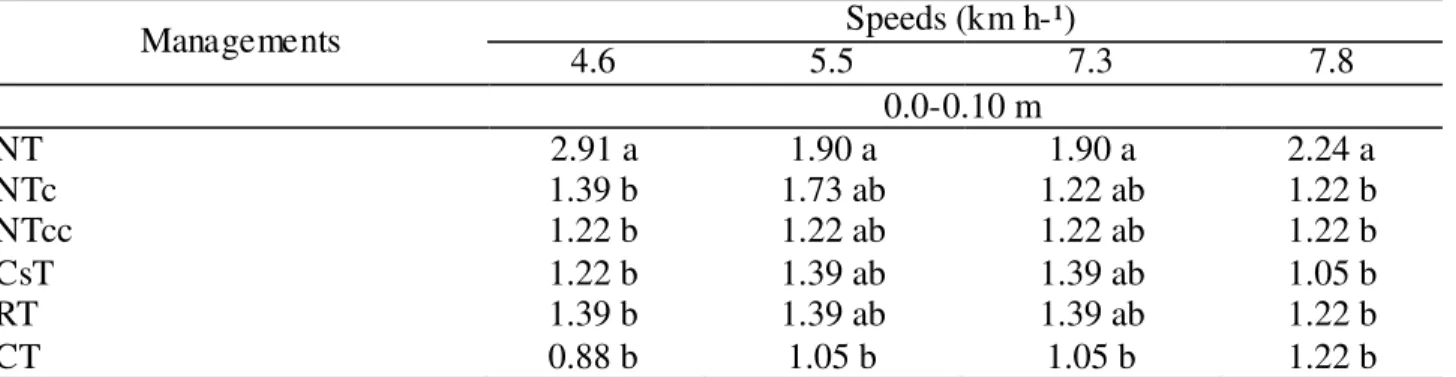
The sowing speed influenced the plants stand, being better at the speed of 5.5 km h-1 with 11.91 plants per meter, and the others: 4.6; 7.3 and 7.8 km h-1 with 10.21; 9.58 and 9.83 plants per meter, respectively (Table 4 and Figure 3), which resulted in a quadratic adjust model in the regression.
FIGURE 3. Plants stand regression per meter depending on displacement speed.
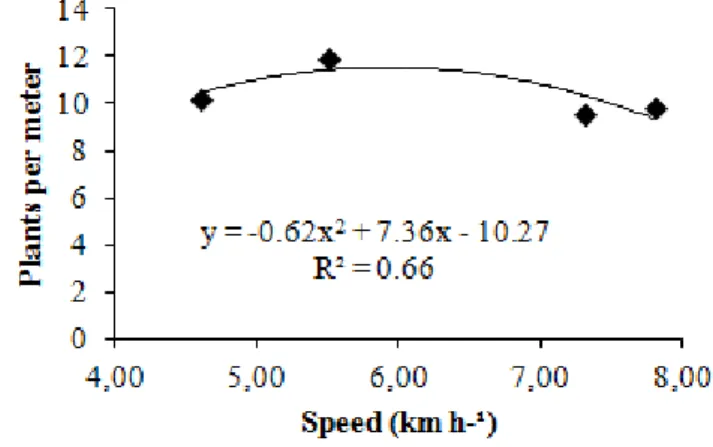
amount of pods per plant. Also, LUDWIG et al. (2011) evaluated soybean crops and plants population, and found that the number of pods per plant is reduced with the increase number of plants per area, also observed by MAUAD et al. (2010) when evaluated the stand with 10, 12, 14, 16 and 18 plants per meter. What differs from this study, in which in the highest plants stand had the highest amount of pod in the speed of 5.5 km h-1. LUDWIG et al. (2011) explain that there is compensation between the number of pods per plant and the number of plants, but it did not occur in this study.
TABLE 5. Unfolding of the management x speed interaction for pods per plant.
Managements 4,6 5,5 Speeds (km h-¹) 7,3 7,8
NT 32.58 a 53.17 a 35.67 a 33.17 ab
NTc 33.17 a 40.25 bc 32.33 a 24.08 b
NTcc 36.91 a 45.25 ab 31.67 a 25.92 b
CsT 40.33 a 34.42 bc 29.25 a 34.83 ab
RT 34.58 a 34.08 bc 30.00 a 26.42 b
CT 42.58 a 33.00 c 35.33 a 43.83 a
Averages followed by the same letter, lowercase in columns do not differ from each other by Tukey test at 5% probability of error.
FIGURE 4. Number of pods per plant for no tillage (NT), no tillage chiseled (NTc), and no tillage cross chiseled (NTcc), depending on the displacement speed.
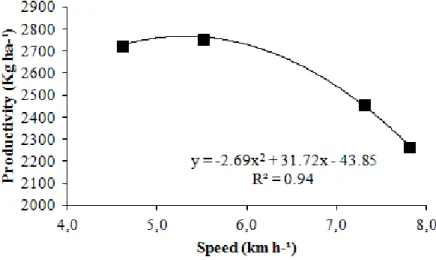
The sowing speed influenced the grain yield, and it is higher in the speed of 5.5 km h-1, which provided a quadratic adjust to the regression model, (Figure 5). This fact may be related to the highest stand of plant in this speed (Figure 3), and according to LUDWIG et al. (2011) the highest productivities are reached when there is the highest amount of pods per m2. What was found in this study by the highest amount of pod in this speed.
671
FIGURE 5. Grain yield (kg ha-1) depending on the displacement speed.
CONCLUSIONS
The no tillage system showed the highest value of penetration resistance. In the no tillage system the sowing speed of 5.5 km h-1 should be used to decrease the soil compaction.
Soil management systems that use equipment with shank to preparation reduce the penetration resistance, similar to the conventional tillage.
Speeds on the working range (5 to 7 km h-1) favor higher yields, by improving the number of pods per plant, and do not affect the stand.
ACKNOWLEDGEMENTS
We thank to the FUNDECT - Foundation to Support the Development of Education, Science
and Technology of the State of Mato Grosso do Sul, by granting the second author the master’s
scholarship. We thank to the CAPES – Higher Education Personnel Improvement Coordination for the scholarship of the second and fifth author. We thank to the CNPQ - National Council for Scientific and Technological Development for the scholarship of the first author.
REFERENCES
BELLÉ. M. P.; ALONÇO, A. S.; FRANCETTO, T. R.; ROSSATO, F. P.; FRANCK, C. J.; DAUTO, P. C. Demanda energética e mobilização do solo com o uso de escarificadores em
sistemas de semeadura direta. Revista Brasileira de Engenharia Agrícola e Ambiental, Campina
Grande, v.18, n.5, p.551-558, 2014.
CHERUBIN, M. R.; SANTI, A. L.; BASSO, J.; EITELWEIN, M. T.; VIAN, A. L. Variabilidade da resistência a penetração do solo em função da dimensão da malha amostral. Revista Plantio Direto,
LIMA, C. L. R. de; REINERT, D. J.; REICHERT, J. M.; SUZUKI, L. E. A. S. Produtividade de culturas e resistência à penetração de Argissolo Vermelho sob diferentes manejos. Pesquisa Agropecuária Brasileira, Brasília, v.45, n.1, p.89-98, 2010.
LIMA, R. P.; LEON, M. J.; SILVA, A. R. Compactação do solo de diferentes classes texturais em áreas de produção de cana-de-açúcar. Revista Ceres, Viçosa, MG, v.60, n.1, p.16-20, 2013.
LUDWIG, M. P.; DUTRA, L.M.C.; LUCCA FILHO, O. A.; ZABOT, L.; JAUER, A.; UHRY, D. Populações de plantas na cultura da soja em cultivares convencionais e Roundup ReadyTM.
Revista Ceres, Viçosa, MG, v.58, n.3, p. 305-313, 2011.
MAUAD, M. SILVA, T.L.B.; ALMEIDA NETO, A.I.; ABREU, V.G. Influência da densidade de semeadura sobre características agronômicas na cultura da soja. Agrarian, Dourados, v.3, n.9,
p.175-185, 2010.
MUZARANA, M.; LEVIEN, R.; MÜLLER, J.; CONTE, O. Sistemas de preparo do solo: alterações na estrutura do solo e rendimento das culturas. Revista Brasileira de Ciências do solo, Viçosa,
MG, v.35, n.4, p.1197-1206, 2011.
PEREIRA, R. G.; ALBUQUERQUE A. W.; SOUZA, R. de O.; SILVA, A. D. da; SANTOS, J. P. A. dos; BARROS, E. da S.; MEDEIROS, P. V. Q. Sistemas de manejo do solo: soja [Glycine max
(L.)] consorciada com Brachiaria decumbens (STAPF). Pesquisa Agropecuária Tropical, Goiânia,
v.41, n.1, p. 44-51, 2011.
ROBOREDO, D.; MAIA, J. C. S.; OLIVEIRA, J. O.; ROQUE, C. G. Uso de dois penetrômetros na avaliação da resistência mecânica de um Latossolo Vermelho distrófico. Engenharia
Agrícola, Jaboticabal, v.30, n.2, p.308-314, 2010.
ROSA, D. P.; REICHERT, J. M.; MENTGES, M. I.; BARROS, C. A. P.; REINERT, D. J.;
VIEIRA, D. A. Cultivo mínimo: Efeito da compactação e deformação abaixo da atuação da ponteira do subsolador. Revista Brasileira de Engenharia Agrícola e Ambiental, Campina Grande, v.15,
n.11, p.1199-1205, 2011.
SILVA, F. A. S. E.; AZEVEDO, C. A. V. Versão do programa computacional Assistat para o sistema operacional Windows. Revista Brasileira de Produtos Agroindustriais, Campina Grande,
v.4, n.1, p71-78, 2002.