OPEN JOURNAL OF FINANCE
An Analysis of Equity Markets
Cointegration in the European Sovereign
Debt Crisis
Nuno B. Ferreira
1*, Manuela M. Oliveira
21Department of Quantitative Methods, IBS-ISCTE Business School, ISCTE, Av. Forcas Armadas, Lisboa, Portugal. 2Centro de Investiga˜ao Operacional, Faculdade de Ciˆencias da Universidade de Lisboa, Portugal.
*Corresponding author: nuno.ferreira@iscte.pt
Abstract:
A simplified presentation of an empirical finding in the portfolio diversification literature is that diversifying across countries is more effective in reducing risks than diversifying across industries. While the linear approach is not designed to capture a significant integration, this is not the case when Gregory and Hansen cointegration tests are used to assess this relation by allowing for instability in these long-run relations. The present work investigates the existence of long-run relations between the Portuguese and other markets under stress. Interestingly, the only market that did not follow this trend was Spain. In overall, our results found six cointegration vectors: two within the group of European emerging markets (Portugal, Italy and Ireland) and the other four between the Portuguese market and the mature markets (France, United Kingdom, Germany and United States).
Keywords:
Stock Markets Indices; Structural Breaks; Cointegration; EU Sovereign Debt Crisis
1. INTRODUCTION
The integration of international stock markets has received plenty attention from financial research over the past few years. Factors such as the reduction of exchange controls, technological developments in communications and trading systems, and the introduction of innovative financial products among others, have an important contribution to that integration. An accurate valuation of the degree of comovement among international equity markets is important for several reasons. For investors, the strategy of a well-diversified portfolio critically depends on a correct understanding of how narrowly international stock market returns are correlated. Changes in international correlation patterns call for an adjustment of portfolios. Policy makers are concerned about correlations among equity markets because of their implications for the stability of the global financial system. Monetary policy planning is also affected by international stock market developments, due to the international proliferation of shocks via equity markets, the wealth channel and confidence repercussion. Nowadays, the global trend towards the stock market’s increasing role in the economy has made this kind of spillover more important. It is generally understood that the lack of interdependence across national stock markets brings benefits of international
portfolio diversification.
Cointegration measures common movements over longer periods of time and is therefore not affected by short term movements. Additionally, lags in the time series make correlations almost useless. This technique allows for short term divergence between two different time series. In other words, the series do not necessarily have to go up or down at the same time on a day to day basis; one might go up while the other goes down. Thus there is no need for the two series to move in daily synchrony at all. In the long run, however, the two price series cannot wander off in opposite directions for very long without coming back to their long term equilibrium.
Several studies can be found on both long-run and short-run relationships among international stock markets. We highlight the papers of [Horvath and Petrovski [1], Lucey and Muckley [2]; Dimpfl [3] on long-run relationships, and those of (Kim [4]; Bekhet and Mugableh [5]; Zhou et al. [6]) on short-run relationships. The studies on cointegration provide conflicting evidence depending on the market, the sample periods frequency of observations (daily, weekly or monthly) and also the methodology used to investigate the interdependence of stock markets.
In the context of the Economic and Monetary Union (EMU) creation area, we highlighted the paper of Zhou et al. [6] which concluded that on January 1, 1999, it is still not possible to speak of a single Euro-area stock market. Securities trading traditionally followed national lines. As a result, continued fragmentation reflects a host of national differences in market practices, laws, tax treatment and regulation. These differences, coupled with the lack of a single infrastructure platform for the market, give rise to costs and inefficiencies that prevent the full potential benefits of a unified equity market from becoming widely available. Indeed, investors tend not to make a distinction between national and foreign financial instruments, and banks operate in the worldwide area. Campos, Ericsson, and Hendry [7] and Gregory and Hansen [8] showed that structural breaks have strong implications for cointegration analysis in a sense that they reduce the power of cointegration tests and lead to the under rejection of the null hypothesis of no cointegration. As a result, it may be erroneously concluded that cointegration relations do not exist, although they are present with structural changes.
The majority of early studies focused on the stock markets of developed countries. The increased globalization of stock markets and the importance of emerging markets in the world economy therefore makes a study on the relationships among the major emerging markets and their interactions with world leaders of significant importance.
The present study followed the Gregory – Hansen (G-H) methodology which takes the hypothesis of instability in long-run relations into account. This methodology also provides for the estimation of the structural change date rather than making an arbitrary assumption of when it takes place based on market history.
In order to accomplish that, a comprehensive dataset was used including daily data for the Portuguese equity market and four of the European markets under greatest stress in recent years (Greece, Ireland, Spain and Italy). The analysis covered the period from September 1993 to April 2012. Four more developed markets were also included in the analysis (United States, United Kingdom, France and Germany) which is a database of considerable size for the newly established European Community (EC) markets. The results from traditional cointegration procedures were compared with the findings provided by the G-H methodology to determine whether the latter helped uncover any additional long-run relations overlooked by the more conventional techniques.
The G-H procedure revealed several long-run relations between the Portuguese and the remaining markets (with the exception of Spain) using regular cointegration tests. This provides a stronger indicator
of cointegration relations between emerging European countries and developed markets implying that the diversification benefits for foreign investors with long horizons in these markets might be overstated.
The remainder of the paper is structured as follows. The next section presents the methodology employed when testing for the non-stationarity of the price series and cointegration. Section 3 summarizes the main reasons for the estimated results and section 4 concludes.
2. MODEL FRAMEWORK
2.1 Unit root tests
The evidence of unit roots triggered the emergence of tests that clearly identify the stationarity property of a time series data. The Augmented Dickey Fuller (ADF) and Phillips-Perron (PP) are among the most usual in pioneer studies. This analysis therefore began by carrying out these two tests for all variables included in the study. Only an overview of the results from both tests is presented below to avoid unnecessary complexity (detailed table results are available by request). The ADF and PP tests indicated that the null hypothesis of a unit root in the stock price levels cannot be rejected for any time series, while a unit root in the first differences of the stock prices is rejected at the 5% significance level. The stock prices thus follow an integrated process of order one. Notwithstanding, the absence of any structural break effects is an important limitation associated with both ADF and PP tests. When dealing with finite samples, the standard tests for unit root (non-stationarity hypothesis test) are biased toward accepting the null hypothesis when the data-generating process is in fact stationary, especially when we are closely to having a unit root. Different theories on phases of economic development and growth postulate that an economic relationship changes over time. More recently, several studies noted that such tests may incorrectly indicate the existence of a unit root, when in actual fact the series is stationary around a one-time structural break (e.g. Zivot and Andrews, [9]). Their argument is based on the fact that conventional unit root tests may be reversed by endogenously determining the time of the structural break.
The endogenous one-break test proposed by Zivot and Andrews [10] is most widely adopted. Building on Perron [9] exogenous break test, ZA only consider a break under the alternative, but not under the null in carrying out unit root testing. The null hypothesis in all tests proposed by ZA is yt=µ +yt 1+ut, i.e.;
ytis integrated with no structural break. Of the three types of ADF test proposed by Perron, the authors
applied the one in which the Ha assumes a break in the intercept and the slope coefficient on the trend at an unknown breakpoint. Estimating with OLS:
4yt=µ +q1D1t(l) + bt + q2D2t(l) + gyt 1+ p
Â
i=1
di4yt 1+ut (1)
Thus, many sequential regressions are computed in which D1t(l) and D2t(l) change each time. The
t-test statistic (concerningg=0) is also computed in each regression.
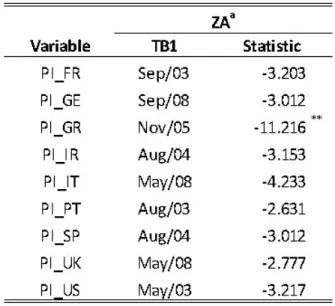
The ZA test fails to reject the null hypothesis of a unit-root at the 1 percent significance level for PI variable in the established crisis period in all countries except Greece (Table 1). This means that the price index series of the remaining countries are non-stationary. Another interesting fact was the date of the structural break detected by the test. Following the United States (US) market, the markets under severe stress markets therefore revealed their breaks as a contagious phenomenon. Faced with these results, the analysis proceeded by trying to identify any cointegration between the Portuguese market and the
Table 1. Zivot and andrews test results
Notes:aBoth Intercept and Trend
Critical value at 1%(**) and 5%(*),respectively. The optimal laglength was determined by SBC.
remaining markets (with exception of Greece), using the G-H approach. This would imply that structural change is present in the pattern of long-run stock market comovements.
2.2 Gregory and Hansen test
Perron [9] stated that ignoring the issue of potential breaks can render not only the statistical results of unit root tests invalid but also those of cointegration tests. The Gregory and Hansen [8] method tests for structural changes in the cointegrating vector. G-H propose the cointegration tests which accommodate a single endogenous break in an underlying cointegrating relationship. There may, or may not, be a trend in the cointegrating regression, and it can either have a break in just the intercept or in all coefficients. The break point t0 is unknown and determined by finding the minimum value for the ADF statistic on the residuals from the broken cointegration regression. Gregory and Hansen have tabulated critical values by modifying the Mackinnon [11] procedure.
The number of lags of the change in the residual used in computing the ADF statistic can be selected automatically using AIC, BIC or general-to-specific pruning by t-tests. Nevertheless, as pointed out by the authors, these tests are more powerful than the other alternatives, notably “stable” cointegration. Hence, a rejection of the null hypothesis does not necessarily imply changes in the cointegration vector, since an invariant relationship might be the cause of the rejection. In fact, the null hypothesis of no cointegration with structural breaks is tested against the alternative of cointegration with one structural break. The timing of the structural change under the alternative hypothesis is estimated rather than selected.
The G-H methodology postulated four models that are based on alternative assumptions about structural breaks in the spirit of Zivot and Andrews [8]. The first model includes a constant interceptor constant (C) and a level shift dummy. The second alternative model (C/T) contains an intercept and trend with a level shift dummy. The third model is a full break model (C/S), which includes two dummy variables, one for
the intercept and another for the intercept and slope.
The G-H approach starts with the standard model of cointegration and no structural change:
Model 1: Standard Cointegration:
y1t=µ + aTy2T+et,t,...,n (2)
In this case, if there is a stated long-run relationship, bothµ and a, are necessarily defined as time-invariant. The G-H approach considers this long-run relationship could shift to a new long-run relationship by introducing an unknown shifting point that is reflected in changes in the interceptµ and/or changes to the slopea defining Model 2 and 3 in the following form:
Model 2: Level Shift (C):
y1t=µ1+µ2aTy2T+et, t,...,n (3)
This model represents a level shift in the cointegration relationship and is modeled as a change in the interceptµ variable. µ1andµ2represent the intercept before and at the time of the shift. In order to
account for the structural change, the authors introduced the dummy variable definition: jtt=
(
0 i f t [nt],
1 i f t > [nt]. (4) where the unknown parametert 2 (0,1) represents the relative timing of the change point and [ ] denotes an integer part.
Model 3: Level Shift with Trend (C/T):
y1t =µ1+µ2jtt+bt+aTy2T+et,t,...,n (5)
In this model, the authors extended the possibilities by introducing a time trendbtinto the level shift
model.
Model 4: Regime Shift (C/S):
y1t =µ1+µ2jtt+aTy2T+aTy2Tjtt+et,t,...,n (6)
The last model integrates a shift in the slope vector, which allows the equilibrium relation to rotate and a parallel shift. For this case,a1is the cointegrating slope coefficient before the regime shift, anda2is the
change in the slope coefficients, whereas (a1+a2) is the cointegrating slope coefficient after the regime
shift. This model is a regime shift in which intercept, trend and slope coefficients change. The single break date in these models is endogenously determined. This break date is selected where the absolute value of the ADF test statistic is at its maximum. The critical values for cointegration are tabulated in Gregory and Hansen [8] and are used for testing cointegration with unknown breaks.
3. RESULTS AND DISCUSSION
3.1 Dataset
In the present study, the stock market prices index (Pi) were collected for each selected market (Portugal (PT), Spain (SP), Ireland (IR), Italy (IT), Greece (GR), France (FR), Germany (GE), United Kingdom (UK) and United States (US). The data collection comprises daily data between September 1993 and April 2012.
3.2 Empirical results
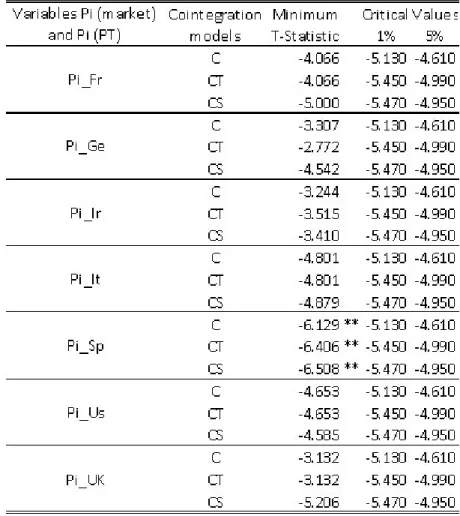
Table 2reports the results for the three G-H models, showing that when the Portuguese stock price index (PI) is the dependent variable, the null hypothesis of no cointegration relationships is rejected. The Gregory and Hansen method revealed that the relationships of the PI underwent intercept and regime shifts not only in Portugal and the remaining markets under severe stress but also in others in a more favorable economic situation. There was a break in the late 1990s for all countries. The early break date may be due to the continuing economic liberalization in all countries from the early 1980s. From these years, all countries underwent continuing economic liberalization and the early break date may be capturing the circumstances of financial reforms.
In general, we conclude that the results of the G-H test shown inTable 2reveal linkages between the Portuguese market and the remaining markets with the exception of Spain. The accumulation of significant economic and financial imbalances of an undeniable magnitude and severity in the Spanish economy may explain the absence of cointegration between the Iberian countries.
These imbalances are interrelated, thus generating negative dynamics which must be reversed. They are related three distinct areas, namely: financial imbalances, negative growth and high unemployment.
The public deficit for 2011 was 8.5% of Gross Domestic Product (GDP); however, a 6% target had been set and this cast some doubts on the country’s capacity for budgetary consolidation. Public debt increased over the last four years and caused concern despite the fact that Spain’s debt level remains below the European average. In fact, it went from 36.3% of GDP in 2007 to an expected 79.8% of GDP in 2012. Moreover, private debt reached a very high level following a period of marked growth in borrowing until 2008. Private debt is mainly linked to the construction sector, notably to real estate. These high levels of debt are mostly dependent on external sources leading to significant external indebtedness (165% of GDP in 2011).
The Spanish economy showed signs of slight recovery in 2010 and until mid-2011. This was primarily sustained by dynamic external demand. Nevertheless, the recovery was cut short in summer 2011 due to the depletion of fiscal incentives and the intensification of tensions in financial markets; this had a negative effect on financial conditions and the confidence of economic agents, which had already shown signs of weakening. The first two quarters of 2011 saw a moderate expansion in the GDP, (0.4% and 0.2% quarter on quarter respectively), followed by stagnation in the third quarter before shrinking to 0.3% in the fourth quarter of the year.
Given all the uncertainty surrounding the Portuguese economy, many economists question whether Spain will soon follow suit. Some economists are uneasy about comparisons as the economic systems
Table 2. Gregogy and hansen cointegration test results
Notes: the critical values from Gregory-Hansen(1996a) (**) indicates critical values at 1%
and recent evolution of the two countries are very different. Why should Spain be compared to Portugal as opposed to the Netherlands for instance? On April 7th 2011, the European Commission refused to compare Spain to Portugal after Lisbon appealed for financial help, saying that Madrid was meeting its deficit-cutting goals despite economic challenges.
To cite Amadeu Altafaj1, commission spokesman for economic affairs ”Spain must be judged on its
own merits. Spain is on track to meet its objectives in terms of deficit reduction for 2010 and 2011”. In a news briefing Altafaj stated ”The Spanish economy is facing big challenges but it is fulfilling its commitments,” adding that Madrid had undertaken ”important economic reforms.” He refused to draw any parallel with Portugal, which joined Eurozone peers Greece and Ireland in asking for a bailout, thus raising concerns that Spain could be next in line. In his words ”Spain is meeting its commitments, so we do not make any analogy”.
Indeed, Spain does not have a history of defaults. It did become a ”serial defaulter” in the 16th century 1 htt p : //www.eubusiness.com/news eu/spain portugal.9g f (consultedinDecember9 th,2013)
after failing to invade England; but there are no plans for another invasion so economists see no danger of a default. Moreover, Spain did not default in peacetime in the 20th century, unlike the US in 1933, or seek a bailout as the UK did in 1976. The fiscal position of Spain was apparently excellent in late 2007, following the onset of the financial crisis on August 9th. According to Eurostat, it was better than in the other three largest euro area member states. Spain had a consolidated total government budget surplus of 1.9% of GDP, the third highest after Finland (5.2%) and Luxembourg (3.7%). Three other euro area member states also had a surplus, namely Germany (0.3%), Netherlands (0.2%), and Ireland (0.1%). Spain’s total government debt to GDP was also reasonable and in fact much better than the other three largest member states of the euro area. Spain had a debt to GDP ratio of 36.1% compared with 63.9% in France, 64.9% in Germany, and 103 % in Italy, all of which were above the 60% Stability and Growth Pact ceiling. Spain’s excellent fiscal position followed 14 years of growth at an average of 3.7% per year (since 1994), whereas the euro area as a whole only grew at an average of 2.3%. The 3.6 million immigrants that entered Spain between 2000 and 2007 contributed significantly to this growth. In fact, Spain’s output is quite high: even in 2009, GDP per capita in Spain was essentially the same as that of Italy, very close to that of France, and only about 10% lower than in Germany or the UK. Spain was strong enough to resist bailouts from the European Union (EU) and International Monetary Fund (IMF).
This has frequently been explained by the fact that Spain has a larger economy and a less problematic debt. However, Spain’s main problem was that most of its current account deficit was financed with foreign savings, predominantly in euros and from the euro area. Unfortunately, these foreign savings were invested largely in “bricks and mortar” rather than in the production of tradable products which could generate foreign revenue to pay for the debts. This caused fears of the need for a bailout thus triggering a fall in investors’ confidence. This fear could imply the request of the so-called bailout, implying the investor‘s faith reduction. But unlike Portugal, Ireland and Greece, Spain is often associated with the more powerful France and Germany. These factors all help explain the lack of a stable cointegration relation between Portugal and Spain.
4. FINAL REMARKS
A number of studies demonstrate that ignoring the possibility of structural change can affect the power of conventional cointegration tests and the relevance of their conclusions about the presence of cointegration. In this paper, we implemented the G-H residual-based test for cointegration, which explicitly allows for a structural break in cointegration relations. We applied this model to a dataset comprising five emerging EC stock markets and four mature markets during the period September 1993 – April 2012. We investigated whether the methodology provides additional evidence on the presence of long-run relations over and above those detected by conventional cointegration tests.
The G-H test detects several equilibrium relations that conventional cointegration testing procedures could not identify. We find six additional cointegration vectors, two within the group of emerging EC markets (Portugal, Italy and Ireland) and the other four between the Portuguese market and the mature markets. The presence of equilibrium relations is likely to be attributed to the growing exposure of the EC markets to foreign capital flows.
Our findings suggest that after accepting a more general view of cointegration, stronger evidence of significant long-run relations between the emerging EC markets within the region and globally is obtained than previously reported.
This supports the hypothesis that the Portuguese market have become increasingly integrated with world markets; the Spanish market is an exception to this due to its singularity and because its economy is big enough to constitute an important engine for European economic growth. International investors who seek to diversify in these emerging EC markets should be aware of the implications of this closer international integration for their risk management strategies.
References
[1] R. Horvath and D. Petrovski, “International stock market integration: Central and South Eastern Europe compared,” Economic Systems, vol. 37, no. 1, pp. 81–91, 2013.
[2] B. M. Lucey and C. Muckley, “Robust global stock market interdependencies,” International Review of Financial Analysis, vol. 20, no. 4, pp. 215–224, 2011.
[3] T. Dimpfl, “A note on cointegration of international stock market indices,” International Review of Financial Analysis, 2013.
[4] H. Kim, “Dynamic causal linkages between the US stock market and the stock markets of the East Asian economies,” tech. rep., Royal Institute of Technology, CESIS-Centre of Excellence for Science and Innovation Studies, 2010.
[5] H. Ali Bekhet and M. Ibrahim Mugableh, “Investigating Equilibrium Relationship between Macroe-conomic Variables and Malaysian Stock Market Index through Bounds Tests Approach,” Interna-tional Journal of Economics & Finance, vol. 4, no. 10, 2012.
[6] Z. Hong, L. Guoping, and L. Wanfa, “A Study on the Relationship between Short-Term International Capital Flow and the Volatility of China‘s Stock Market,” Ann Econ Financ, vol. 14-2(A), pp. 587– 608, 2013.
[7] J. C. Fern´andez, N. R. Ericsson, and D. F. Hendry, “General-to-specific modelling,” 2005.
[8] A. W. Gregory and B. E. Hansen, “PRACTITIONERS CORNER: Tests for Cointegration in Models with Regime and Trend Shifts,” Oxford bulletin of Economics and Statistics, vol. 58, no. 3, pp. 555– 560, 1996.
[9] P. Perron, “The great crash, the oil price shock, and the unit root hypothesis,” Econometrica: Journal of the Econometric Society, pp. 1361–1401, 1989.
[10] E. Zivot and D. W. K. Andrews, “Further evidence on the great crash, the oil-price shock, and the unit-root hypothesis,” Journal of Business & Economic Statistics, vol. 10, pp. 251–270, 1992. [11] R. F. Engle and C. W. Granger, Long-run economic relationships: Readings in cointegration. Oxford
FIN is an open access journal published by Scientific Online Publishing. This journal focus on the following scopes (but not limited to):
Agency Theory Assets and Liabilities Banking Systems Behavior Finance Bonds and Stocks Corporate Finance Exchange Financial Risk Financial Econometrics Financial Engineering Financial Theory Investment Banking
Mathematical Models in Finance Money & Banking
Public Finance Management Quantitative Methods in Finance
Welcome to submit your original manuscripts to us. For more information, please visit our website:
http://www.scipublish.com/journals/FIN/ You can click the bellows to follow us:
Facebook: https://www.facebook.com/scipublish Twitter: https://twitter.com/scionlinepub
LinkedIn: https://www.linkedin.com/company/scientific-online-publishing-usa
Google+: https://google.com/+ScipublishSOP
SOP welcomes authors to contribute their research outcomes under the following rules:
Although glad to publish all original and new research achievements, SOP can’t bear any misbehavior: plagiarism, forgery or manipulation of experimental data.
As an international publisher, SOP highly values different cultures and adopts cautious attitude towards religion, politics, race, war and ethics.
SOP helps to propagate scientific results but shares no responsibility of any legal risks or harmful effects caused by article along with the authors.
SOP maintains the strictest peer review, but holds a neutral attitude for all the published articles. SOP is an open platform, waiting for senior experts serving on the editorial boards to advance the progress of research together.