HOLOS, Ano 36, v.1, e6273, 2020 1
THE TRANSPORT MODES AT BAIXADA FLUMINENSE REGION OF RIO DE JANEIRO
J. A. V. B. MELLO1, H. C. A. DA G. AFONSO2 e A. J. R. MELLO3 Centro Federal de Educação Tecnológica Celso Suckow da Fonseca
joseavbm@yahoo.com.br1
Submetido em 09/09/2017 e aceito em 22/07/2020 DOI: 10.15628/holos.2020.6273
ABSTRACT
Baixada Fluminense is one of the macrozones of the metropolitan region of Rio de Janeiro that has emerged as new centrality, especially Nova Iguaçu and Duque de Caxias. This paper intends to compare internal mobility destiny quantities and identify the role of transport modes in serving motives of the trips that occurs in Baixada Fluminense region. It was analyzed 2003 and 2015 data from the Urban Transport Master Plan, and data from the Brazilian Institute of Geography and
Statistics. The results identified that more than sixty percent of the trips are carried out within the public transport, configuring the relative independence in relation to capital and provide other benefits for their residents. The endogenous economic dynamics of these cities modified the patterns of urban displacement, transforming them into strong reception axis displacement originated in the Capital.
KEYWORDS: urban mobility, public transport, new centrality.
MODOS DE TRANSPORTE NA BAIXADA FLUMINENSE, REGIÃO DO RIO DE JANEIRO
RESUMO
A Baixada Fluminense é uma das macrozonas da região metropolitana do Rio de Janeiro que emergiu como nova centralidade, especialmente Nova Iguaçu e Duque de Caxias. Este artigo pretende comparar as viagens internas e identificar o papel dos modos de transporte em servir os motivos demandados que ocorrem na região. Foram analisados dados de 2003 e 2015 do Plano Diretor de Transporte Urbano, e dados do Instituto Brasileiro de Geografia e Estatística. Como resultado,
identificou-se que mais de sessenta por cento das viagens são realizadas dentro da Baixada e no transporte público, configurando a independência relativa em relação ao capital e proporcionando outros benefícios para seus residentes. A dinâmica econômica endógena dessas cidades modificou os padrões de deslocamento urbano, transformando-os em forte deslocamento do eixo de recepção originado na Capital.
HOLOS, Ano 36, v.1, e6273, 2020 2
1 INTRODUCTION
Work for urban mobility is to think how city use, design and organize itself in order to provide accessibility for work, education, leisure and health. In other words, urban mobility should provide the right to the city. Accessibility is considered a facility, measure by distance, time and costs that people need to achieve their destinies with autonomy IBAM (2006). This concept, combined with the mobility can subsidize the construction of a new reference to measure the degree of mobility and its reflex on life quality within a metropolitan region.
Urban mobility system is a structured combination of modes, services and infrastructures that guarantee the displacement of people and goods within the city and that keep strong interaction with other urban policies IBAM (2005). It constitutes a central tool for social and economic development al local and regional levels. Trips – motorized or no motorized – are determined by socioeconomic development, by the appropriation of space and by technology evolution.
Increasing the size of the urban spot also increases the time and expense of travel and costs (Souza, 2015). The occupation of urban space outside the center creates demand for long distance transportation towards the center, a demand that faces supply inefficiencies, reducing the quality of life of users and workers (Mello et al., 2016b). The lack of integrated planning in brazilian metropolis, combining public transport policies with land use policies, resulted in a disorganized growth of the peripheries and in the demand raise for roads and service networks. This scenario contributed for the new arrangements in the home-work trips patterns in the metropolitan regions and for the degradation of urban transport quality.
As a consequence, automobiles and motorcycles start to be used as an individual mode of transport for many workers that live in the peripheries, increasing the respective fleets. The excess of cars vehicles affects metropolis mobility, the roads infrastructures (physical pace) does not increase in the same proportion, besides promotes noise, air pollution, traffic jams and other urban problems. Afonso and Santos (2015) mention that in transport is necessary to draw the profile of the consumers of travel and consumers of the competing services, in order to evaluate the patterns of their displacements.
This paper intends to compare the mobility destiny quantities and identify the role of transport modes in serving motives of the trips that occurs in Baixada Fluminense region. It was analyzed 2003 and 2015 data from the Urban Transport Master Plan, and data from the Brazilian Institute of Geography and Statistics. This research is important, because characterizes Baixada Fluminense region as a relevant territory, highlighting the key role that motorized transport has to internal displacement in the region and it for the most central region of Rio de Janeiro.
Also provides an opportunity to identify the role of transport modes in serving motives of the trip that occurs on cited region. Ferreira and Silva (2016) point out the existence of a strong relationship between population agglomerations and the resources availability in different locations, and a need to understand the dynamics of movements and trips. Ceretta e Froemming (2015) complements that living in a city that offers solutions to these needs that are increasingly present in their daily lives and that directly impacts in the quality of place life.
2 CONCEPTUAL FRAMEWORK
Urban centers are seen as places where the variety and scale occur together. (Mccann, 2014). Due to urban evolution, relations of centrality are not constant, especially when
HOLOS, Ano 36, v.1, e6273, 2020 3
peripheral areas orbit around a main center (Mello et al., 2016). The dynamic of urban space occupancy, the centrality and the emergency of new centers and sub centers (with its own, absolute and relative dynamics) has been the object of many studies of researches.
The centrality phenomena started by the end of the 19th Century (Soja, 2000), in the
threshold of the development of communication, individual mobility favored the growth of cities. The trips from residential areas to suburban areas occur on sequential and selective reasons. We find the fragmentation of the urban space in relation to land use and occupancy. A rereading of this fragmentation leads to implicit concept of polycentricity (Cervero and Seskin, 1995; White, 1999). The “proliferation” of sub centers accentuates the mobility problems, and becomes imperative to search for balance of land-use planning and transit services strategies, in order to adjust this trend; on the other hand, this trend to the “capacity” of the sub center attract companies looking for workers and very cheap land (Cervero and Seskin, 1995).
The effects of growth of urban agglomerations in central areas, motorization and traffic jams accelerated the decentralization of some activities that moved out from central areas (Giuliano, 1999). A thinking, “is the job not the population”, the key to understand the growth of urban sub centers and that such sub centers are more well identified within a zone where the employment density index overlaps its neighborhood. For this reason, Spósito (2007) explains that the centralities re-makes a decision continuously, even in short-time scales, which are designed for flows through persons, goods, informations and of the values.
The decentralization process and the emergence of subcenters at of State of Rio de Janeiro had begun between the decades of 1940-1950, when some regions have attracted scores of shops and services, and even then only where limited to the district center of Rio de Janeiro (Kossmann, 1984). It was the 1960s that Rio de Janeiro became the Federal Political and Administrative Capital of Brazil – the new center – accompanied by relevant socio-cultural and industrial transformations in southeast. Kneib (2008) affirmed that the process of suburbanization in Brazil, unlike North-american and European cities, did not come from wealthy classes and the elites of the country, but in the lower classes, provided by the growth of road transport collective and of low quality. This process led to the formation of new centers of centrality within contemporary metropolitan based in large socio-spatial segregation.
The importance of transport (flexible: car, bus, truck) can be highlighted about this process by promoting accessibility (Vilhaça, 2001; Correa, 1997; Kneib, 2008). The expansion of individual transport allowed the population access more affluent areas outside the central sectors to their place of residence which, gradually, began to attract service activities and various businesses, creating new points of centrality in the metropolitan space. The decentralization was due to the infrastructure deployed, the potential attractiveness of the region, transport, spatial and demographic growth among others (Correa, 1997).
It is noteworthy that the emergence of subcenters don’t invalidate the relevance of the centers, since these (centers) still had significant concentration of financial activities, banking and insurance, a variety of shops and services, government agencies, places for leisure, fueled by a territorial configuration that allows the flows of people, goods, capital, etc.. The center has ideal conditions and is essential for the dynamism of capitalist relations of production, because of its strong connections with other economic areas (Correa, 1989).
The center still preserves all the operational and functional strucutres, the symbolic and formal aspects. Therefore, the Center and the Subcenters and Expanded Centers are part of the same system, even if they do not have the same territorial coverage – caracterized by complementarity of these parts, resulting in a continuos growth of the city and interconnected (Tourinho, 2007).
HOLOS, Ano 36, v.1, e6273, 2020 4
3 MATERIALS AND METHODS
This study is based on an exploratory approach, based on a theoretical research, on the conceptual axes that support a better understanding of the problematic of this theme, and a documentary study about the Metropolitan Region of Rio de Janeiro (RMRJ), whose data and historical facts help to better understand the displacements and centralities of the region.
According to Sá-Silva et al. (2009), the documentary research is very close to bibliographic research. The distinguishing element is in the nature of the sources: the bibliographical research refers to the contributions of different authors on the subject, paying attention to the secondary sources, while the documentary research uses materials that have not yet received analytical treatment, that is, the primary sources. It was analyzed 2003 and 2015 data from the Urban Transport Master Plan, and data from Brazilian Institute of Geography and Statistics.
4 RESULTS
4.1 Description of Metropolitan Region of Rio de Janeiro (RMRJ)
The concentration of population and economic activity in the metropolitan region of Rio de Janeiro – RMRJ, also reflects the pattern of economic and social development of Brazil from decades of 1950 - 1970, when it emerges the formation of national conurbations, but whose tendency was accentuated according to the specific characteristics of this state (Farias, 2005).
The State of Rio de Janeiro has the highest rate of metropolitan concentration in the country, with 75% of its population residing in the metropolitan area. Indeed, the polarization between economic and social development between the capital and inland repeats itself within the metropolitan area, for example, when comparing the capital and Baixada Fluminense (Farias, 2005). This means that the metropolitan area can not be apprehend evenly; but rather its correct apprehension involves understanding the structure of spatial inequalities.
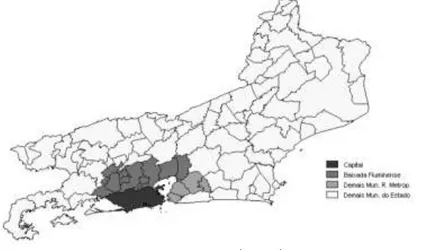
The Metropolitan Region of Rio de Janeiro, figure 1, was established through the Federal Complementary Law No20 of 1974. Since forming the boundary of the region has undergone
many changes. When instituted, had the city of Petrópolis, excluded by State Complementary Law no64 of 1990. Belford Roxo and Queimados cities were districts of Nova Iguaçu - were
installed in 1993. In 1997, were installed Tanguá city – an old district from Itaboraí; and Japeri - district of Nova Iguaçu, and Seropédica - former district from Itaguaí. The Mesquita city- former district of Nova Iguaçu, was installed in 2001, and the municipality of Marica was excluded by the State Law no 97. Finally, Law no 105 excluded both Itaguaí and Mangaratiba.
Figure 1: Territorial division of Rio de Janeiro Cities, RMRJ and Baixada Fluminense.
HOLOS, Ano 36, v.1, e6273, 2020 5
The formation of Metropolitan Region of Rio de Janeiro is the result of the urban sprawl on the periphery of this city and is based on three synchronous movements: a) the displacement of the work poor people to the suburbs and peripheries; b) the arrival of migrant workers; and c) the reverse movement of upward social mobility towards the neighborhoods to the waterfront toward the middle class. There was an explicit socio-spatial segregation between rich and poor, where the poor have moved to more remote sttlements, with poor infrastructure and even nonexistent.
The incorporation of the periphery – Baixada Fluminense (Figure 1), to the metropolitan area was prepared in a functional relationship, justified by industrial trend observed after the 1950s, which highlighted the branches of petroleum (REDUC) in Duque de Caxias and chemical-pharmaceutical (BAYER) in Belford Roxo (Rocha, 2007). There was also the instablisment of the National Motor Factory in Xerém, a district of Duque de Caxias, that has increased ineguality even more, with the policy that priorized public funds for the expansion of the water network and accessibility in the south zone, ensuring the reproduction of middle and upper social classes, and therefore constituted new class consumer durables, such as cars (Lago, 2000).
4.2 Centralities and patterns of mobility in Baixada Fluminense
The beginning of Baixada Fluminense occupation occurred in the middle of the 16th century, when the first sesmarias were distributed in Guanabara Bay. At this time the rivers of this region played an important role, internalizing the occupation of land and transporting the production of the local farms to the city of Rio de Janeiro. From an economic viewpoint, the production exploration of the territory was based on the cultivation of sugar cane and mills. These activities have remained in the region until the late nineteenth century (Rocha, 2007).
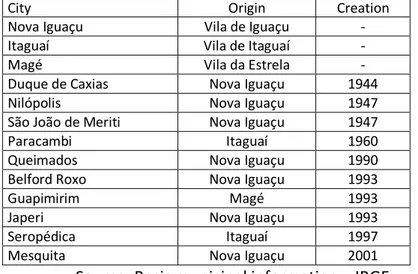
In regards to the political-administrative division of territory, by the end of the 1930s this region was composed with the following cities: Nova Igaçu, Itaguaí and Magé. In the 1940s, Nova Iguaçu was divided into three other cities: Duque de Caxias, Nilópolis and São João de Meriti. Below, table 1 shows the Baixada Fluminense cities members of Metropolitan Region of Rio de Janeiro and years of each creation. It is observed that the process of dismemberment and occupation were intensified in the 1990s, altering the original administrative division of region.
Table 1: Cities of Baixada Fluminense – Origin and installation year City Origin Creation
Nova Iguaçu Vila de Iguaçu - Itaguaí Vila de Itaguaí - Magé Vila da Estrela - Duque de Caxias Nova Iguaçu 1944 Nilópolis Nova Iguaçu 1947 São João de Meriti Nova Iguaçu 1947 Paracambi Itaguaí 1960 Queimados Nova Iguaçu 1990 Belford Roxo Nova Iguaçu 1993 Guapimirim Magé 1993 Japeri Nova Iguaçu 1993 Seropédica Itaguaí 1997 Mesquita Nova Iguaçu 2001
Source: Basic municipal information – IBGE
Between 1980 and 1990, the Baixada Fluminense had population growth rates higher than those observed in the whole territory which now comprises the State of Rio de Janeiro. This
HOLOS, Ano 36, v.1, e6273, 2020 6
growth reflects the intense process of metropolization state, based primarily on population density peripheral municipalities to the Rio de Janeiro city (Farias, 2005).
Throughout the second half of the 2010s, population growth occurred in all cities of Baixada that have the flolwing common features: high population density, high rate of vehicles per inhabitant (motorization), high concentration in road, rail transport of low quality and no subway system.
Indeed, the prodominace of this model occupying of fluminense periphery brought some negative externalities, such as reduced quality of life of its residents, increased travel time commuting, congestion and accidents. Data on displacement motor signal a conceptual change on the technological option adopted in the region that accommodated large volume of urban growth of RMRJ.
According to statistics from Traffic Department of the State of Rio de Janeiro (Detran-RJ, 2012), a fleet of cars in circulation in the region covered by the Master Plan for Urban Transport in the Metropolitan Region of Rio de Janeiro (PDTU/RMRJ) recorded an average increase of 183 percent over the period 1999-2009; the neighborhood of Niterói being most prominent, with registration increasing fleet of around 198 percent between 1999-2009. In the Baixada Fluminense, despite having already exceeded half a million vehicles, the availability of road network is very limited and for many years is not enlarged. The trend is to intensify internal congestion, also generating noise and air pollution in Baixada Fluminense cities.
Based on origin-destiny (O/D) matrix data is possible to make some reflections sumarized in table 2. It is found that 64,28 percent of motorized trips in RMRJ have Rio de Janeiro city as destination and other 21,38 percent trips goes to internal cities of Baixada Fluminense. Moreover, 73,71 percent of the total origin trips from the Baixada Fluminense do internal movements in Baixada region, and only 24,98 percent goes tripping to Rio de Janeiro city.
Table 2: Motorized trips patterns in RMRJ %
Origin Baixada Fluminense Capital Destination Other Total
Baixada Fluminense 73,71 24,98 1,31 100,00
Capital 8,41 9,00 2,59 100,00
Other 1,65 12,07 86,28 100,00
Total 21,38 64,28 14,33 100,00
4.2.1 Patterns of trips in Baixada Fluminense
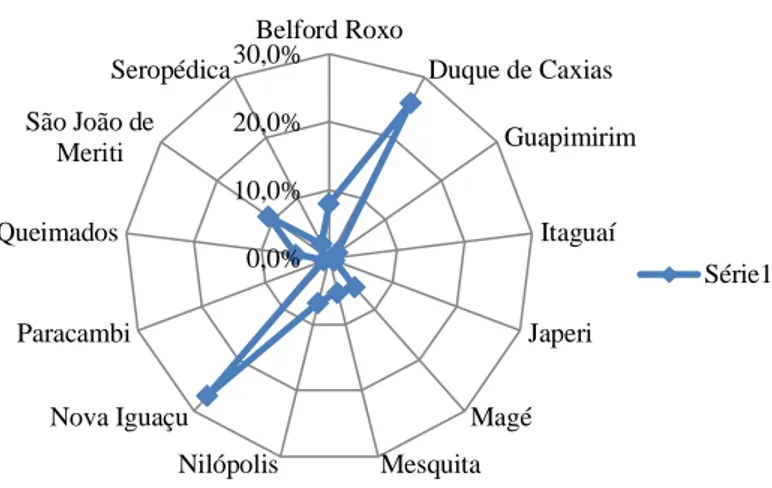
The Baixada Fluminense cities have two million passengers daily and have gained their own dynamics, attracting travel and changing patterns of trips, which were aimed at the Capital Center (City of Rio de Janeiro). To enhance the dynamics of displacement only the Baixada Fluminense, was performed an isolation of the motoring records that addressed exclusively internal relations. Within the region of the Baixada, the trips are concentrated among Nova Iguaçu and Duque de Caxias. In figure 1 can see that both attract over 50 percent of trips from outside in Baixada Fluminense, covering, respectively, Nova Iguaçu (27 percent) and Duque de Caxias (25,8 percent).
HOLOS, Ano 36, v.1, e6273, 2020 7
Figure 1: Centralization destination
Table 3 shows that Duque de Caxias, Nova Iguaçu and Itaguaí are cities that have a large concentration of internal trips, respectively, 80,5, 89,1 and 79,4 percent. The analysis of table 3 also shows that the motorized volume of trips to some municipalities of the Baixada is a sign of the polarization in the region, indicating strong link between certain cities. This is the case of Nova Iguaçu, whose economic dynamics attracts the displacement arising from Belford Roxo (15,7 percent), Japeri (15,4 percent), Mesquita (38,7 percent), Nilópolis (21,3 percent) and Queimados (25,4 percent).
Table 3: Percentage of trips by origin-destination in Baixada Fluminense (2003)
ORIGIN
DESTINATION
Belford Roxo
Duque de
Caxias Guapimirim Itaguaí Japerí Magé Mesquita Nilópolis Nova
Iguaçu Paracambi Queimados
São João Meriti Seropédica Belford Roxo 58,1 15,3 0,0 0,0 0,1 0,0 1,5 0,7 15,7 0,0 0,6 8,0 0,0 D. Caxias 6,5 80,5 0,0 0,0 0,1 2,8 0,4 0,3 2,5 0,0 0,5 6,2 0,0 Guapimirim 0,0 0,6 63,3 0,0 0,0 36,2 0,0 0,0 0,0 0,0 0,0 0,0 0,0 Itaguaí 0,7 0,0 0,0 89,1 0,0 0,0 0,0 0,0 3,0 0,4 0,0 0,0 6,8 Japerí 1,7 0,5 0,0 0,0 52,8 0,2 1,8 3,8 15,4 5,0 16,5 1,2 1,3 Magé 0,0 23,8 5,7 0,0 0,1 69,6 0,0 0,0 0,0 0,0 0,3 0,4 0,0 Mesquita 4,7 1,3 0,0 0,0 1,0 0,0 30,8 14,7 38,7 0,0 2,6 5,8 0,5 Nilópolis 1,3 2,9 0,0 0,0 1,1 0,0 11,9 55,2 21,3 0,0 1,0 5,3 0,0 N. Iguaçú 5,5 2,3 0,0 0,1 0,6 0,0 4,9 2,4 79,4 0,1 2,4 1,7 0,7 Paracambi 0,0 0,5 0,0 3,5 6,1 0,0 0,0 0,0 2,1 59,5 1,2 0,3 26,8 Queimados 2,3 2,8 0,0 0,0 8,9 2,2 3,1 1,1 25,4 0,6 52,2 1,2 0,3 S. J. Meriti 7,6 14,4 0,0 0,0 0,0 0,1 0,8 2,6 4,5 0,0 0,2 69,5 0,3 Seropédica 0,0 0,3 0,0 6,6 1,0 0,0 0,7 0,0 9,9 7,9 0,4 0,2 73,2 Trips 224.694 583.564 15.917 39.432 25.501 92.110 60.733 71.208 512.937 16.387 47.678 239.404 33.905
The same happens to Duque de Caxias, which has a strong attraction to the trips that originates in Belford Roxo (15,3 percent), Magé (23,8 percent) and São João de Meriti (14,4 percent). Finally, Guapimirim has a strong relationship with Magé and Paracambi with Seropédica.
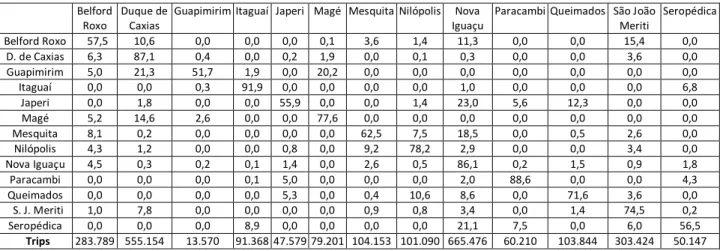
Table 4 shows that Duque de Caxias, Nova Iguaçu and Itaguaí still are cities that have a large concentration of internal trips, respectively, 87,1, 86,1 and 91,9 percent.
Table 4: Percentage of trips by origin-destination in the Baixada Fluminense (2015)
ORIGIN DESTINATION 0,0% 10,0% 20,0% 30,0%Belford Roxo Duque de Caxias Guapimirim Itaguaí Japeri Magé Mesquita Nilópolis Nova Iguaçu Paracambi Queimados São João de Meriti Seropédica Série1
HOLOS, Ano 36, v.1, e6273, 2020 8
Belford Roxo
Duque de Caxias
Guapimirim Itaguaí Japeri Magé Mesquita Nilópolis Nova Iguaçu
Paracambi Queimados São João Meriti Seropédica Belford Roxo 57,5 10,6 0,0 0,0 0,0 0,1 3,6 1,4 11,3 0,0 0,0 15,4 0,0 D. de Caxias 6,3 87,1 0,4 0,0 0,2 1,9 0,0 0,1 0,3 0,0 0,0 3,6 0,0 Guapimirim 5,0 21,3 51,7 1,9 0,0 20,2 0,0 0,0 0,0 0,0 0,0 0,0 0,0 Itaguaí 0,0 0,0 0,3 91,9 0,0 0,0 0,0 0,0 1,0 0,0 0,0 0,0 6,8 Japeri 0,0 1,8 0,0 0,0 55,9 0,0 0,0 1,4 23,0 5,6 12,3 0,0 0,0 Magé 5,2 14,6 2,6 0,0 0,0 77,6 0,0 0,0 0,0 0,0 0,0 0,0 0,0 Mesquita 8,1 0,2 0,0 0,0 0,0 0,0 62,5 7,5 18,5 0,0 0,5 2,6 0,0 Nilópolis 4,3 1,2 0,0 0,0 0,8 0,0 9,2 78,2 2,9 0,0 0,0 3,4 0,0 Nova Iguaçu 4,5 0,3 0,2 0,1 1,4 0,0 2,6 0,5 86,1 0,2 1,5 0,9 1,8 Paracambi 0,0 0,0 0,0 0,1 5,0 0,0 0,0 0,0 2,0 88,6 0,0 0,0 4,3 Queimados 0,0 0,0 0,0 0,0 5,3 0,0 0,4 10,6 8,6 0,0 71,6 3,6 0,0 S. J. Meriti 1,0 7,8 0,0 0,0 0,0 0,0 0,9 0,8 3,4 0,0 1,4 74,5 0,2 Seropédica 0,0 0,0 0,0 8,9 0,0 0,0 0,0 0,0 21,1 7,5 0,0 6,0 56,5 Trips 283.789 555.154 13.570 91.368 47.579 79.201 104.153 101.090 665.476 60.210 103.844 303.424 50.147
The analysis of table 4 also shows a reducing moviment of trips between some cities of the Baixada is a sign of the polarization in the region, indicating strong link between certain cities. This is the case of Nova Iguaçu, despite concentrating the largest number of trips, in 2003 was the second most intense destination, nowadays occurs a light percent modification of destinations, Belford Roxo (11,3 percent), Japeri (23 percent), Mesquita (18,5 percent), Nilópolis (2,9 percent) and Queimados (8,6 percent).
4.2.2 Trips in Baixada according to main reasons and transport modes
Including non motorized modes, public transport by bus accounts for just over 34,1 percent of total trips, against 7 percent of the movements made by car and either 7 percent by bike, and only 0,8 percent by train (see table 5). The walking trip mobility mode composed more than 44 percent from total and was used primarily to study. The trips for work motives has been intensely enabled by modes of transportation by car, train, motorcycle, and bus. In the region there is no installation of the mode of transport by subway, so there is no way to know what the integration of this mode of transport could represent to the system planned to the region.
Excluding motorized transport by car, it is observed that 93 percent of this region trips depend on the existence of a quality public transportation system to provide mobility; being indispensable government initiatives in order to provide and improve more quality of public transport service, and so avoid that part of these users migrate to purchase private car.
Table 5: Trips in Baixada Fluminense by transport modes and motives to destiny (2015)
Transport Modes Motives on Destiny Total % Total
Study Leisure Others Health Work
Walking 32,2% 0,6% 58,5% 0,5% 8,2% 2.278.969 44,8% Car 8,0% 1,2% 57,8% 3,1% 29,8% 357.178 7,0% Bicycle 19,8% 1,0% 55,5% 0,7% 23,0% 353.680 7,0% Motorcycle 4,5% 0,0% 57,6% 0,9% 37,0% 39.859 0,8% Bus 15,4% 0,9% 56,7% 3,9% 23,0% 1.732.030 34,1% Others 33,8% 4,6% 49,8% 0,0% 11,8% 202.408 4,0% Train 9,8% 0,0% 54,6% 0,0% 35,6% 41.099 0,8% Van 3,2% 3,9% 71,0% 8,0% 13,9% 78.460 1,5% Total 23,1% 1,0% 57,5% 2,0% 16,5% 5.083.684
This diagnostic shows that the growth of motorization over the last decade due to increase in income and purchasing power of the population and by the facilities of financing private car, explains the desire to cecome a car owner that can, in mind perception, quality trips
HOLOS, Ano 36, v.1, e6273, 2020 9
and safety. The achievement of this desire (growth of motorization) occurs even at the expense of negative externalities, such as congestion, air pollution and traffic accidents. Hence the urgent need for public actions aimed at improving the quality of public transport services in the metropolitan region of Rio de Janeiro, more specifically on Baixada Fluminense.
5 CONCLUSIONS
Rio de Janeiro experienced an urbanization process focused exclusively toward the center, where all the investment was directed to infrastructure, consolidating its position as the main business hub. This movement, however, was not accompanied by a land policy capable of housing the workforce, forcing the population to move to neighboring cities where the price of land was more affordable. These trips of people has expanded the urban, going to rural areas, causing large trips for work, social activities, and education among others.
Historically, governments have always invested little in infrastructure resources of surrounding areas, slowing the development of secondary linkages between outlying areas and the center. The urban policy at the metropolitan area is the main obstacle for the resolution of issues relating to social segregation, centrality and immobility of the population.
However, it was found that some areas of RMRJ already have their own dynamics and "autonomous" with solid economic and social growth, enabling a reduction in trip times and the possibility that people can do other activities, according to the benefits brought by shorter trips. Due to the significant number of trips in the Baixada Fluminense may conclude that like areas that already have city-periphery interaction and not dependent, and able to provide a territorial dynamics with good quality of life, a result of high economic and social complementarity between cities. This paper analyzed the effects of the phenomenon of new centralities in the periphery of Rio de Janeiro metropolis, according to the dominant reasons and vectors, as well as its impact on quality of life of the population in subcenters.
Besides the literature review, data were analyzed PDTU/RMRJ, IBGE. The data and information presented evidenced the importance of Baixada Fluminense as a new center of economic development as well as holder of most workers of RMRJ. The investigation of the city through its trips and axis centrality-mobility is one of the possible perspectives for analyzing the metropolitan area and is linked to the idea that the intra-urban spatial organization is strongly affected by their patterns of movements.
The results indicate that, despite the growth of motorization, public transport within the Baixada Fluminense is important and needs to be planned according to their peculiarities and growth trends. We found that a considerable portion of the population still does not use the public transportation system or not yet migrated to the private car, since it carries with foot, with an average low of offsets to perform their basic activities. Accordingly, the consolidation of economic and social communities of this region is essential to design and provide projects that allow offsets under appropriate service levels that ensure quality of life for its residents.
6 REFERENCES
AFONSO, H.C.A.G.; SANTOS, M.P.S. (2015). Práticas de gestão em transportes coletivos urbanos por ônibus: caso de empresas no Rio de Janeiro. Revista Produção e Desenvolvimento, v.1, n.1, p.1-13.
HOLOS, Ano 36, v.1, e6273, 2020 10
CERETTA, S. B. N.; FROEMMING, L. M. S. (2015, 31 dez.). City Marketing: Dimensões importantes para uma Cidade de Bem viver. Revista Produção e Desenvolvimento, v. 1, n. 3, p. 67-79.
CERVERO, R.; SESKIN, Samuel. (1995). An evaluation of the relationships between transit and urban form. TRB, June, v.7, p. 55. In: http://onlinepubs.trb.org/onlinepubs/tcrp/tcrp_rrd_07.pdf CORRÊA, R. L. (1989). O espaço urbano. São Paulo: Ática, 94p.
CORRÊA, R. L. (1997). Trajetórias Geográficas. Rio de Janeiro: Bertrand Brasil, 302p.
FARIAS, L. O. (2005). Diagnóstico das Condições Sócio-Econômicas e da Gestão Pública dos Municípios da Baixada Fluminense. Disponível em www.presidencia.gov.br.
FERREIRA, B.L.G.; SILVA, M.A. (2016). Análise da relação entre variáveis socioeconômicas e o número de viagens de veículos de carga na região metropolitana do Rio de Janeiro. Revista Produção e Desenvolvimento, v.2, n.1, p.77-89.
GIULIANO, G., SMALL, K. A. (1999). The determinants of growth of employment subcenters. Journal of Transport Geography, v.7, p.189-201.
KNEIB, E. C. (2008). Subcentros Urbanos: construção conceitual e metodológica à sua definição e identificação para planejamento de transportes. Tese de doutorado em Transportes orientado por Paulo Cesar Marques da Silva. Brasília – DF: Departamento de Engenharia Civil e Ambiental - Faculdade de Tecnologia da Universidade de Brasília, 207p.
KOSSMANN, H., RIBEIRO, M. Â. (1984). Análise espacial das cadeias de lojas do comércio varejista no Rio de Janeiro. Revista brasileira de geografia, v.46, n.1, p.197-219.
LAGO, L. C. (2000). Desigualdades e segregação na metrópole: o Rio de Janeiro em tempo de crise. São Paulo e Rio de Janeiro: Revan/Fase.
MCCANN, P. (2014). Schools of Thought on Economic Geography, Institutions, and Development. IN: FISCHER, Manfred M. Handbook of regional science. Heidelberg: Springer.
MELLO, J.A.V.B.; RIBEIRO MELLO, A.J.; ORRICO FILHO, R.D. (2016). Centralidad basada en viaje y su reflexión sobre la estrutura monopolicéntica de la Región Metropolitana de Río de Janeiro. Investigaciones Geográficas, [S.l.], n. 89, p. 74, mar. ISSN 2448-7279.
MELLO, J.A.V.B., ORRICO FILHO, R.D., SOARES, M.R. (2016b). Ocupação do solo e transportes por bondes e trens na região metropolitana do Rio de Janeiro (RMRJ): da viabilização urbana a crise do sistema. Espaço & Geografia, v.19, n.2, p.323-345.
MINISTÉRIO DAS CIDADES – IBAM. (2006). A mobilidade urbana no planejamento da cidade. Rio
de Janeiro: Instituto Brasileiro de Administração Municipal - IBAM, 36p. <
http://www.ibam.org.br/estudos >
MINISTÉRIO DAS CIDADES – IBAM. (2005). Mobilidade e política urbana: subsídios para uma gestão interada. Rio de Janeiro: Instituto Brasileiro de Administração Municipal - IBAM, p. 52. < www.observatorioseguranca.org>
ROCHA, A. S. (2007, julho/dezembro). (Re) pensando a Baixada Fluminense em um contexto da Região Metropolitana do Rio de Janeiro: sociedade, território e representação. Revista geo-paisagem, v.6, n.12. <http://www.feth.ggf.br/baixadafluminense.htm>. ISSN Nº 1677-650 X
HOLOS, Ano 36, v.1, e6273, 2020 11
SÁ-SILVA, J.R.; ALMEIDA, C.D.; GUINDANI, J.F. (2009). Pesquisa documental: pistas teóricas e metodológicas". Revista Brasileira de História & Ciências Sociais. v.1, n.1, p.1-14.
SOJA, E.W. (2000). Postmetropolis: critical studies of cities and regions. Oxford: Blackwell Publishers, 440p.
SOUZA, G.A. (2015). Produção do espaço e mobilidade urbana: na contramão da sustentabilidade. Revista Produção e Desenvolvimento, v.1, n.3, p.42-51.
SPÓSITO, M.E.B. (2007, 1 de agosto). Reestruturação urbana e segregação socioespacial no interior paulista. Scripta Nova. Revista electrónica de geografía y ciencias sociales. Barcelona: Universidad de Barcelona.
TOURINHO, A.O. (2007). Do centro à novas centralidades: uma trajetória de permanências e rupturas conceituais. Arquiteses. vol. 2. São Paulo: FAUUSP/FUPAM/Annablume, pp. 11-28. VILHAÇA, F. (2001). Espaço intra-urbano no Brasil. São Paulo: Studio Nobel - FAPESP: Lincoln Institute, 142p.
WHITE, M.J. (1999). Urban areas with decentralized employment: theory and empirical work. Handbook of Regional and Urban Economics. Edited by E.S. Mills and P. Cheshire. Elsevier