UNIVERSIDADE DA BEIRA INTERIOR
Ciências da Saúde
Promoting Nigrostriatal Protection through the
Intranasal Delivery of a GPER Agonist
Hernâni dos Santos Pinto
Dissertação para obtenção do Grau de Mestre em
Ciências Biomédicas
(2º ciclo de estudos)
Orientador: Prof. Doutora Graça Maria Fernandes Baltazar
Co-orientador: Mestre Julieta Conceição Mendes Borges Oliveira
Agradecimentos
Em primeiro lugar quero dedicar esta dissertação à minha família, e em especial aos meus pais por todo o apoio, ajuda e amor que sempre me deram, sem vocês nada do que sou e percorri até hoje seria possível. A ti Miriam, por embora longe, sempre acompanhares o meu percurso e me apoiares nas mais diversas alturas, o que faz de ti a pessoa especial que és. Quero agradecer à Professora Doutora Graça pela oportunidade de puder abraçar este projeto e pelo empenho e dedicação que sempre demonstrou. Também pelo conhecimento e experiência que me transmitiu, durante todo este percurso, o meu mais genuíno reconhecimento.
À Julieta, pela tua dedicação e empenho, por estares sempre disposta a dar uma mãozinha e pela companhia durante boa parte deste percurso.
Ao Claúdio, pelo bom companheirismo no trabalho, lazer e também nas viagens que partilhámos. À Daniela, com quem caminhei esta etapa desde o início, pelos bons momentos passados, tanto nas horas de trabalho como nas alturas de maior descontração. Quero agradecer também aos colegas Daniela, Diogo e Marta, pela vossa companhia e ajuda durante parte deste percurso e por convivermos momentos de boa disposição.
A todos vocês amigos por convosco passar bons e divertidos momentos, que tanto ajudaram nos alturas de maior apreensão. E claro também aos amigos e parceiros de treino, que também acompanharam este meu percurso, por comigo partilharem o court.
Resumo Alargado
A doença de Parkinson é a segunda doença neurodegenerativa mais comum, caracterizada pela degeneração progressiva e preferencial dos neurónios dopaminérgicos na Substantia
Nigra pars compacta (SNpc) com consequente diminuição dos níveis de dopamina no estriado.
A etiologia desta doença ainda não é totalmente conhecida mas vários estudos demonstram que a neuroinflamação mediada pela microglia está envolvida na génese e desenvolvimento da doença. É reconhecido que os estrogénios têm potencial para proteger os neurónios dopaminérgicos na doença de Parkinson. Porém, o seu uso como terapia acarreta vários efeitos secundários, devido à ativação dos recetores de estrogénios, alfa e beta, que limita o seu uso. Está descrito que o recetor de estrogénios acoplado a proteína G (GPER) induz ativação de vias de sinalização celular com efeitos anti-inflamatórios, sem exibir muitos dos efeitos secundários associados à terapia com estrogénios, o que torna este recetor uma possível alternativa ao tratamento da Doença de Parkinson.
Sabe-se que a ativação seletiva deste recetor pelo seu agonista G-1 confere proteção contra a toxina dopaminérgica MPP+/MPTP, mas também que este recetor é expresso em vários tecidos do organismo e exerce funções em vários sistemas fisiológicos, incluindo o reprodutivo, endócrino, urinário, imunitário, músculo-esquelético e cardiovascular. Supondo que se utiliza este agonista como estratégia de proteção, deve-se fazê-lo da forma o mais específica possível, sabendo também que a molécula de G-1 é uma molécula lipofílica que se dispersa rapidamente pelos tecidos. Sabendo isto, propomos testar a eficácia da administração intranasal deste composto.
Neste trabalho comparamos a eficácia da administração intranasal e subcutânea de G-1 na proteção da lesão induzida pela injeção esterotáxica bilateral de lipopolissacarídeo (LPS), na
Substantia Nigra (SN). Avaliou-se a extensão da lesão por imunohistoquímica para tirosina
hidroxilase (TH) e do efeito neuroinflamatório através da análise dos marcadores adaptador molecular de ligação a cálcio ionizado (iba-1) e proteína glial fibrilar ácida (GFAP), para microglia e astrócitos, respetivamente. Foi também avaliada a capacidade das duas diferentes formas de administração de G-1 em promover recuperação funcional dos danos motores induzidos pelo LPS, analisando o comportamento motor dos animais, através dos testes de Rotarod e Open Field.
Os resultados mostram que a ativação do GPER, tanto pela administração subcutânea de G-1 como pela intranasal, reduziu significativamente quer a reatividade microglial quer a ativação astrocitária neste modelo animal de LPS. Em relação à proteção dopaminérgica, os resultados não foram tão evidentes, visto que a extensão da lesão dopaminérgica que se verificou foi pequena, sendo insuficiente para induzir alterações motoras.
Palavras-chave
Abstract
Parkinson’s Disease (PD) is a neurodegenerative disorder characterized by progressive and preferential loss of dopaminergic neurons in the Substantia Nigra pars compacta (SNpc). Estrogens have been recognized by their potential to protect dopaminergic neurons in PD. However, important side effects have been associated with estrogens therapy, mainly due to the activation of estrogen receptors alpha and beta, which discourages its use. The activation of cell survival pathways, together with the anti-inflammatory effects triggered by G protein– coupled estrogen receptor (GPER) activation makes this receptor a promising target for PD therapeutics avoiding most of the important side effects of estrogen therapy.
We found that selective activation of GPER with G-1 protects neurons against the dopaminergic toxin MPP+/MPTP. GPER is expressed broadly and functions for GPER have been described in almost every physiological system, including reproductive, endocrine, urinary, immune, musculoskeletal and cardiovascular. Taking into consideration that the putative use of this agonists as protective strategy should be as specific as possible and that G-1 is a lipophilic molecule that rapidly diffuses through tissues we propose to test the effectiveness of the intranasal administration of this compound.
We compared the effectiveness of delivering G-1 by subcutaneous injection and by intranasal administration in protecting the nigrostriatal pathway from a lesion induced by stereotaxic injection of lipopolysaccharide (LPS) bilaterally in the Substantia Nigra (SN). Besides evaluation of the lesion extent by tyrosine hydroxylase (TH) immunohistochemistry and the inflammatory effect through analysis of the microglial marker ionized calcium binding adaptor molecule 1 (iba-1) and astrocyte marker glial fibrillary acidic protein (GFAP), we also determined the capability of the two forms of G-1 administration to promote functional recovery of motor impairments induced by LPS by analyzing the motor behaviour of the animals with the Rota Rod and the Open Field test.
Our results showed that both intranasal and subcutaneous delivery of G1 were efficient in controlling microglial reactivity and astrocyte activation in the LPS mice model. Concerning the dopaminergic protection, the results were less clear since in the experimental conditions used the extent of the dopaminergic lesion was very small, being insufficient to induce motor impairments.
Keywords
Parkinson’s disease, neuroinflammation, GPER, G-1, microglia, astrocytes
Index
Figure List ... ix
Table List ... x
Acronyms List ... xi
Introduction ... 2
1.1
Parkinson’s Disease ... 2
1.1.1
Etiology ... 2
1.1.2
Pathological Features ... 3
1.1.3
Current Treatments ... 3
1.2
Neuroinflammation ... 4
1.2.1
Role of neuroinflammation in Parkinson’s Disease ... 4
1.2.2
Astrocytes and neuroinflammation ... 6
1.3
LPS as an in vivo model of Parkinson’s Disease ... 7
1.4
Control of Neuroinflammation by Estrogen Receptors ... 9
1.4.1
Role of estradiol on neuroinflammation ... 9
1.4.2
GPER-mediated protection ... 11
Objectives ... 15
Materials and Methods ... 17
3.1 Animals ... 17
3.1.1
Animal Experimental Procedure ... 17
3.1.2
Effect of intranigral LPS injection on the body weight change in mice .... 18
3.2 Stereotaxic Surgery and Animal Sacrifices ... 18
3.3 Brain Slicing Procedure ... 19
3.4 Immunohistochemistry Protocol ... 19
3.5 Behavioral Evaluation ... 20
3.6 Statistical Analysis ... 21
Results ... 23
4.1 Evaluation of dopaminergic cell loss ... 23
4.2 Microglia reactivity ... 25
4.3 Astrocytic reactivity ... 26
4.4 Behavioural assessment ... 28
4.4.1
Assessment of motor functions ... 28
4.4.2
Measurement of mood impairments of the mice ... 29
Discussion/Conclusions ... 32
Future Perspectives ... 35
Figure List
Figure 1 - Schematic representation of how reactive microgliosis causes
neurotoxicity...6
Figure 2 - Schematic representation of lipopolysaccharide (LPS)-induced DA
neurodegeneration...8
Figure 3 - Structure of G-1 and ligand binding affinities of G-1...12
Figure 4 – Schematic representation of animal procedure, used in the in vivo LPS
model...
......17
Figure 5 – Change of mice body weight during experimental procedure...18
Figure 6 – Effect of LPS bilateral nigral injection and G-1 administration on
dopaminergic (DA) neurons in the Substantia Nigra (SN) and Ventral Tegmental Area
(VTA) of the mice...25
Figure 7 – Effect of LPS bilateral nigral injection and G-1 administration on microglial
activation in the substantia nigra (SN) of the mice...26
Figure 8 - Effect of LPS bilateral nigral injection and G-1 administration on GFAP
fluorescence intensity...
....27
Figure 8 – Effect of LPS bilateral nigral injection and G-1 administration on the Rota
Rod Test...28
Figure 9 – Effect of LPS bilateral injection and G-1 administration on the total
distance travelled by the mice in the Open Field Test...29
Figure 10 – Effect of LPS bilateral injection and G-1 administration on elevations
performed by the mice in the Open Field Test...29
Figure 11 - Effect of LPS bilateral injection and G-1 administration on total center
distance travelled by the mice in the Open Field Test...30
Table List
Table 1 – Description of antibodies used in immunohistochemistry assays...20
Acronyms List
AD
Alzheimer’s Disease
BBB
Blood Brain Barrier
CNS
Central Nervous System
DA
Dopaminergic
DAT
Dopamine Transporter
E2
17β-estradiol
GFAP
Glial Fibrillary Acidic Protein
GDNF
Glial cell line-Derived Neurotrophic Factor
GPER
G-Protein-Coupled Receptor
Iba-1
ionized calcium binding adaptor molecule 1
IHC
Immunohistochemistry
IL-1α
Interleukin-1α
IL-1β
Interleukin-1β
LPS
Lipopolysaccharide
MMPs
Matrix Metalloproteinases
MPTP
1-methyl 4-phenyl 1,2,3,6-tetrahydropyridine
MS
Multiple Sclerosis
NMS
Non-Motor Symptoms
NO
Nitric Oxide
PD
Parkinson’s Disease
RT
Room Temperature
SN
Substantia Nigra
SNpc
Substantia Nigra pars compacta
TH
Tyrosine Hydroxylase
TLR-4
Toll-like receptor-4
TNF-α
Tumour Necrosis Factor-α
UCHL1
Ubiquitin C-terminal Hydrolase L1
VTA
Ventral Tegmental Area
Chapter 1
Introduction
Introduction
1.1 Parkinson’s Disease
Parkinson’s Disease (PD) is the second most common neurodegenerative disorder, after Alzheimer Disease (AD). The prevalence of PD is age-related affecting 1% in people over 60 years of age, and increasing to over 4% in the oldest populations, in developed countries (de Lau et al., 2006; Long-Smith el al., 2009). This disease is characterized by clinical manifestations, such as rest tremor, bradykinesias, rigidity and postural instability. This disease is also characterized by non-motor symptoms that may be present even before the motor symptoms appear, such as depression, dementia and sleep disturbances (Stacy, 2002; Alves et al., 2008; Sami et al., 2004). These pathological features results from the selective loss of dopaminergic (DA) neurons in the substantia nigra pars compacta (SNpc) with the loss of striatal projections that will lead to loss of dopamine in the corpus striatum, deregulating the circuits of the basal ganglia (Long-Smith et al., 2009; Blesa et al., 2015).
1.1.1 Etiology
The etiology of PD is mainly unknown, and it probably results from multiple factors acting together, including ageing, genetic and environment factors.
The decline of neurons in the SNpc is associated with ageing, and related with this, striatal dopamine transporters decline is also suggested to be age-related (McGeer et al., 1977; Samii et al., 2004).
There are reports of patients that developed levodopa-responsive parkinsonism after exposure to 1-methyl 4-phenyl 1,2,3,6-tetrahydropyridine (MPTP), a toxic product that results from the synthesis of a pethidine analogue. This compound is converted to 1-methyl-4-phenylpyridinium (MPP+) within the brain and selectively taken by dopaminergic neurons. Also, other substances in the environment may contribute to the development of this disease, such as pesticide exposure and well water consumption, in rural areas (Samii et al., 2004). Genetic predisposition is also suggested to be a risk for the appearance disease. It is estimated that approximately 5-10% of cases are caused by genetic mutations. Mutations in genes encoding α-synuclein, Parkin, Ubiquitin C-terminal Hydrolase L1 (UCHL1), DJ1, PINK1 or Leucine-Rich-Repeat Kinase 2 (LRRK2) were shown to be associated with an increased risk of developing PD (Toulouse A et al., 2008; Samii et al., 2004).
1.1.2 Pathological Features
One of the pathological features of PD is the presence of intracellular protein aggregates called Lewy bodies. These aggregates found in the SNpc and in other brain regions possess as primary structural component α-synuclein (Toulouse et al., 2008). Mutant α-synuclein protein results in protein misfolding, aggregation and resistance to degradation by the ubiquitin-proteasome system. Also, mutations in Parkin and UCHL1 genes affect the ligation of ubiquitin to proteins targeted for degradation, interfering with normal degradation of these proteins. This results in protein accumulation, as happens in the Lewy bodies accumulation process (Samii et al., 2004).
Also, the SN of PD patients contains high amounts of oxidised and nitrated proteins that contribute to the excitotoxicity. It is studied that a reduction in the mitochondrial complex 1 activity in the SNpc generates more free radicals that damage cell constituents and alter protein degradation. This results in mitochondrial injury, oxidative stress and excitotoxicity which in turn may lead to neuronal death and progression of this disease (Good et al., 1998; Samii et al., 2004).
Moreover, post-mortem analysis of PD brains and animal PD models supports that inflammation also plays a crucial role in the pathogenesis of PD. This process is primarily dependent on the activation of glial cells. These cells provides trophic support to neurons and protection of Central Nervous System (CNS) against infections or injuries, but also release various inflammatory and neurotoxic factors that are believed to contribute to degeneration of DA neurons, characteristic of PD (Dutta et al., 2008).
1.1.3 Current Treatments
Currently the treatment options for this disease aims at slowing down its progression, and provide symptomatic relief of motor and non-motor symptoms. The current standard treatment is based on the reposition of dopamine, mainly employing levodopa (L-Dopa) and dopamine agonists to treat the motor deficits of PD (Sami et al., 2004). In the first years of the disease, dopamine agonists are sufficient to control the disease. However, within 5 years, most patients will need to start levodopa therapy, currently the most potent antiparkinsonian drug, since it provides motor-symptomatic relief during the course of the disease. However, Dopa treatment has reduced effect on non-motor symptoms (Dexter et al., 2013). Also L-Dopa therapy may help to recover the patient functions in the early years of the disease but the motor complications associated with long-term therapy, such as motor fluctuations and dyskinesia, are yet to solve (Salat et al., 2013; Sami et al., 2004).
Non-motor symptoms are currently treated with selective drugs according to the disorder. Depression is usually treated with selective serotonin reuptake inhibitors. Sleep disorders could be alleviated with a long-acting levodopa or low-dose clonazepam administrations, while psychosis/dementia could be treated with an atypical neuroleptic or with central cholinesterase inhibitors (Sami et al., 2004).
Besides all the current therapeutic approaches for PD, there is no cure for this disease. Moreover, treatment aims to replace dopamine in the striatum, and does not halt neurodegeneration. It is crucial that research focus on the causes of PD, exploring the pathology and impaired mechanisms associated with neurodegeneration in this disease.
1.2 Neuroinflammation
Inflammation is crucial against infections, being a defence response expressed by the body, including the CNS. Glial cells of CNS are responsible for the immune functions during an inflammatory process in the brain. Whether from an internal or external insult, when the inflammation and the activation of immune cells become chronic, the products of these mechanisms, such as pro-inflammatory cytokines, tend to be highly expressed. These overexpressed molecules may lead to an immune deregulation and neuronal lesion/loss (Hurley and Tizabi, 2013). Neuroinflammation plays a crucial role in neurodegenerative processes and the progression of various diseases such as PD, AD, Multiple Sclerosis (MS), Huntington’s disease and Amyotrophic Lateral Sclerosis.
1.2.1 Role of neuroinflammation in Parkinson’s Disease
Neuroinflammation was initially suggested to be associated with PD. Data from post mortem samples of the SN of PD patients showed high amounts of microglial cells in this brain region. It was also verified that high levels of pro-inflammatory cytokines were detected in the nigrostriatal tissue, cerebrospinal fluid and in the serum of PD patients (Hirsch and Hunot, 2009; Doorn et al., 2012). Oxidative stress enzymes, such as cyclo-oxygenase-2 (COX-2) and inducible nitric oxide synthase (iNOS) were also detected in post mortem samples of PD patients (Knott et al., 2000). Therefore, it was considered that microglia might play a
significant role in the pathogenic change that occurs in PD (Vawter et al., 1996; Dexter et al., 2013).
Microglia represent the immune system of the CNS and any kind of brain injury provoke its activation, with several structural changes of the cells, switching their response from their resting state to an active profile, in the injured site. Microglial involvement is critical in neurodegenerative disorders such as PD and stroke (Nimmerjahn et al., 2005). In fact, microglia in their active state serve several beneficial functions that enhance survival of
neurons. Some of those beneficial functions include cellular maintenance, removal of dead cells, enhancement of toxin removal, and regulation of the brain development, promoting neuronal survival through the release of trophic and anti-inflammatory factors (Block et al., 2007).
When injury or brain damage occurs, it induces activation of microglial cells with morphological and functional transformations (Nimmerjahn et al., 2005; Rock et al., 2004). Microglial cells are key factors in the innate immunity of the nervous system and the set of its membrane receptors play a major role in recognition of pathogen molecular patterns, such as LPS of the gram-negative bacterial cell wall (Rock et al., 2004; Nimmerjahn et al., 2005). Moreover, activated microglia also release a number of cytokines/chemokines, such as Interleukin-1α (IL-1α) and Interleukin-1β (IL-1β), Tumor Necrosis Factor-α (TNF-α), Matrix Metalloproteinases (MMPs), free radicals (superoxide and nitric oxide (NO), growth factors and several other secretory products. Release of these products induces neurotoxicity. Along with this, it is suggested that microglial abnormal activation lead to a significant decrease of trophic factors secretion, which will compromise normal maintenance of neuronal viability (Block et al., 2007; Dexter et al., 2013).
On the other hand, microglia are not distributed with equal density and morphology across the brain. In fact, evidence suggests that the SN region is particularly enriched in microglia (Kim et al., 2000; Gao et al., 2002) and therefore it is hypothesized that reactive microglia is strongly involved in the initiation and progressive stage of the degeneration of nigral dopaminergic neurons, playing a role in the whole pathogenesis of PD.
Inflammation and oxidative stress induced by reactive microglia is suggested to be crucial to the loss of DA neurons. Initially, microglia recognizes pro-inflammatory stimuli, such as lipopolysaccharide (LPS), which causes its activation and thus promote the release of pro-inflammatory factors. As a consequence, DA neuronal death or damage release several factors that further activate microglia, among them Matrix Metalloproteinase 3 (MMP3), α-synuclein and neuromelanin (Zhang et al., 2005). MMP3 is a proteinase that causes degradation of the extracellular matrix and a microglial activator, inducing DA neurons death. It has been observed that Mmp3-knockout mice have reduced DA neuron death and decreasing microglial activation upon pro-inflammatory stimuli (Kim et al., 2007). One of the other factor, α-synuclein, is the major component of Lewy bodies, typically found in patients with PD and dementia with Lewy bodies (DLB) as above referred. Aggregation of α-synuclein activates microglial cells leading to an increased dopaminergic neurotoxicity (Zhang et al., 2005). Neuromelanin has also a role on inducing dopaminergic neurotoxicity and neurodegeneration. This molecule is made of melanin, peptides and lipid components, and its insoluble granules tend to accumulate in the extracellular space where they induce the activation of microglial cells. It is also suggested that neuromelanin is localized at high concentrations in the human SN, region also enriched in microglia (Zecca et al., 2003).
Release of the agents mentioned above cause overactivation of microglia (reactive microgliosis) which results in a continuous cycle of neuron death in the SN, due to new release of neurotoxic factors, perpetuating neurotoxicity and inflammation (Block et al., 2007; Zecca et al., 2003).
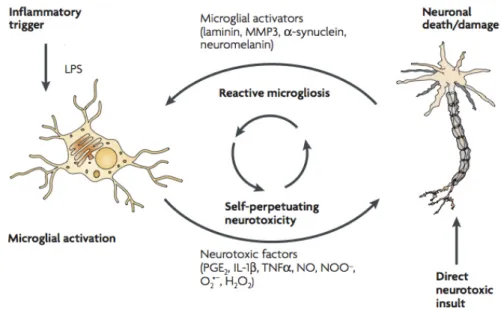
Figure 1 - Schematic representation of how reactive microgliosis causes neurotoxicity. Microglia
become overactivated through two mechanisms. Microglia initially recognizes pro-inflammatory stimuli, such as LPS and release neurotoxic factors that will cause an insult culminating in neuronal death or damage. Consequently, release of several microglial activators by damaged neurons will cause further activation of microglia (reactive microgliosis), perpetuating the cycle of neuron death (adapted from Block et al., 2007).
In conclusion, microglia can act both detrimental and beneficial to neuronal survival. Reactive state of microglia is needed and crucial to act against brain injuries and immunological stimuli, but excessive activation leads to deleterious and neurotoxic effects, resulting in degeneration of neurons and decline of neuronal viability. Therefore, understanding microglial activation characteristics and its role in neurodegenerative disorders, as PD, is crucial.
1.2.2 Astrocytes and neuroinflammation
Astrocytes play an essential role in the response to various insults, such as injuries, ischemia, infections or degenerative disorders like PD (Sofroniew, 2005). Recent studies demonstrate
that astrocytes are essential in diverse brain functions, not only on neuronal support, but also in the synaptogenesis control, neuroplasticity and promotion of myelination (Halliday et al., 2011).
Astrocyte activity regulates neuron and oligodendrocytes viability. Astrocyte loss leads to accumulation of extracellular glutamate, inducing excitoxicity (Sofroniew, 2005). Moreover, these glial cells can reduce the oxidative stress and prevent NO neurotoxicity though generation and release of glutathione. Upon neuronal lesion, astrocytes develop a hypertrophic morphology (reactive astrocytes) which induces the release of several protective agents to the surroundings, which are essential to neuronal support, nutrition and protection, while at the same time they might be stimulating microglia (Lin et al., 1993; Yokoyama et al., 2011).
Degeneration of cell bodies in the SN and nerve terminals to the striatum, as happens in PD, is suggested to be associated with significant glial reaction. Although the neuroprotective reactions exerted by astrocytes is well known, these cells also exhibit potential to induce neural toxicity, in response to different insults (Yokoyama et al., 2011; Sofroniew, 2005). Reactive astrocytes proliferate and migrate to the inflammation sites, generating neurotoxic compounds such as NO and Reactive Oxygen Species (ROS), inducing an inflammatory response that may provoke neural damage and degeneration after an CNS insult. Astrocytes respond particularly to pro-inflammatory cytokines, such as IL-1β and TNF-α, molecules that activate these glial cells upon CNS damage. Moreover, reactive astrocytes produce several factors that induce inflammation in the SN, and also directly lead to microglial activation in various regions of the brain, contributing to degeneration of DA neurons, which is involved in the progression of PD (Yokoyama et al., 2011; Halliday et al., 2011; Streit et al., 1999).
1.3 LPS as an in vivo model of Parkinson’s Disease
In the last three decades several animal PD models have been explored, mainly by exposure to toxins, such as MPTP, 6-hydroxydopamine (6-OHDA) and rotenone (Betarbet et al., 2002), resulting in relevant insights that help to better understand the disease. However, none of them appears to clarify the pathology of the disease as a whole (Dutta et al., 2008).
In the recent years, LPS has been used to clarify the role of glia activation, in particular microglia, in DA neurons degeneration in rodents. LPS is an endotoxin found in the outer membrane of gram-negative bacteria and it acts as an endotoxin inducing multiple pathological effects in human beings. LPS is a stimulator of CNS glia, microglia and astrocytes, and provoke release of immunoregulatory, pro-inflammatory cytokines and free radicals. Some studies refer that microglia is more prominent than astroglia in DA
8
neurodegeneration, since it strongly influences extracellular neurotoxic ROS generation and proinflammatory gene expression, which enhances neurotoxicity as it will be described below (Qin et al., 2004).
LPS associates with a soluble binding protein that enhances the binding of LPS to its intermediate receptor CD14, anchored in the outer membrane of microglial cells. The Toll-like receptor-4 (TLR-4) is a transmembrane protein that binds to LPS-CD14 complex, and together with the accessory adaptor protein MD2 initiates the activation of downstream signalling events involving activation of kinases and upregulation of gene transcription factors such as nuclear factor-kappa B (Figure 1). The release of cytokines, ROS and lipid metabolites from LPS-stimulated microglia leads to the death of the oxidative stress-vulnerable DA neurons.
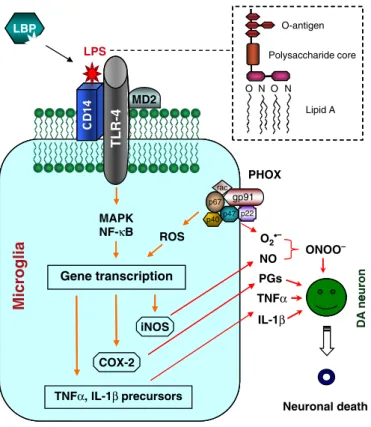
Figure 2 - Schematic representation of LPS-induced DA neurodegeneration. LPS binds to its
intermediate receptor CD14, process enhanced by LPS binding protein (LBP). The association of LPS-CD14 complex with TLR-4 and adaptor protein MD2 initiates a downstream signalling pathway, resulting in release of cytokines, such as TNF-α and IL-1β. Induction of COX-2 and inducible nitric oxide synthase (iNOS) expression, leads to prostaglandins and NO release. Also, activation of multi-subunit phagocyte oxidase complex (PHOX) forms the more damaging peroxynitrite (ONOO-) free radical from combination of NO and superoxide anion. Taking together, the whole insult eventually leads to the death of DA neurons (Dutta et al., 2008).
formation of a complete ‘feeder’ layer and the matura-tion of various neurons has resulted in the formamatura-tion of an intricate neuronal network (Figure 2). Tyrosine hydroxylase-positive neurons are well differentiated and exhibit extensive dendritic processes (Figure 2). Microglia retains the characteristic in vitro resting morphology: round and small [27]. Generally, cultures are ready for treatment with agents of interest at DIV 7 when they are composed of approximately 40% neurons
with !1% being DA neurons, 10% microglia and 50%
astroglia. Treatment of the neuron-glia cultures with LPS (0.1–10 ng/mL) for up to 10 days leads to a selective and progressive degeneration of DA neurons [27]. Several important characteristics of the inflammation-mediated DA neurodegeneration have been revealed through studies using the in vitro LPS PD model. First, LPS-induced neurodegeneration is primarily observed in DA neurons and non-DA neurons are mostly spared [27–30]. Second, microglial activation precedes DA neurodegeneration. For example, significant microglial activation was observed 1 day after treatment with 0.1 ng/mL LPS but DA neurodegeneration was not observed until 10 days later [27]. Third, microglia play a more prominent role than astroglia in the release of various neurotoxic factors that cause DA neurodegen-eration [31].
The in vitro LPS PD model is a powerful system for mechanistic studies of inflammation-mediated DA neuro-degeneration. This is best exemplified by the use of enriched neurons, glia and reconstituted neuron-glia cultures to dissect the cellular and molecular mediators of DA neurodegeneration [27,31]. Application of this strategy to enriched/reconstituted cultures from gene knockout mice has helped pinpoint the contribution of factors to DA neurodegeneration [27,31]. Finally, the in vitro LPS PD model is an economic and efficient system very suitable for the initial screening of neuroprotective agents prior to embarking on the more costly and labor-intensive whole animal studies.
SN single injection LPS PD model
To extend the observations made in the in vitro LPS PD model to a physiologically more relevant setting, the single SN injection model was developed. A single injection of a bolus of low microgram quantities of LPS to the SN region of Wistar, Fisher or Sprague–Dawley rats indeed leads to a marked loss (50–85%) of SNpc DA neurons [32–34]. Compared with the in vitro LPS PD model, the SN single injection model made possible the comparison of the relative vulnerability to inflammatory damage of DA neurons in the SN vs. those in the VTA, DA vs. non-DA neurons in the SN, and DA vs. non-DA neuronal projections in the striata.
Injection of LPS to the SN region results in a progressive, preferential and irreversible loss of the SNpc
DA neurons. In one study, unilateral SN injection of 2lg
LPS to Wistar rats decreased DA levels in both the striatum and SN (!50%) up to 21 days after LPS injection [32]. Non-DA neurons in the SN and DA neurons in the adjacent VTA region were spared of the
R CC MM LBP O-antigen MD2 LPS Polysaccharide core Lipid A O N O N L T gp91 p67 rac PHOX O2•– MAPK NF-κB Gene transcription ail g or ci p22 p47 p40 ROS NO PGs ONOO– en or u iNOS COX-2 TNFα IL-1β n ADe TNFα, IL-1β precursors Neuronal death 41 D R4
-Figure 1 Schematic representation of lipopolysaccharide (LPS)-induced and glial activation-mediated dopamine (DA) neurodegeneration. LPS binding protein works as a chaperon that enhances the binding of LPS to its intermediate receptor CD14. The Toll-like receptor-4 (TLR-4) is a transmembrane protein. Association of the LPS-CD14 complex with TLR-4, together with the accessory adaptor protein MD2 initiates a plethora of downstream signaling events that involve mitogen-activated protein kinases (MAPK) and transcription factors such as nuclear factor-kappa B. Upregulation of gene transcription leads to the production and release of cytokines such as TNF-a and IL-1b. Induction of cyclo-oxygenase-2 and inducible nitric oxide synthase (iNOS) expression results in the biosynthesis and release of prostaglandins and nitric oxide (NO). Activation of the multi-subunit phagocyte oxidase complex (PHOX), also called NADPH oxidase generates superoxide anion that com-bines with NO from iNOS to form the more damaging peroxynitrite (ONOO)) free radical. The collective insult of microglia-released cytokines, ROS and lipid metabolites eventually leads to the demise of the oxidative stress-vulnerable DA neurons.
LPS-induced neuronal loss requires the presence of microglial cells and its degeneration process seems to affect DA neurons while other neurons remain less sensitive to the insult. Importantly, LPS does not seem to directly affect neurons, most likely because of their lack of TLR-4 expression (Liu et al., 2011; Dutta et al., 2008). Also, the SNpc region presents a higher concentration of iron and lower levels of glutathione, making DA neurons present in this region highly sensitive to inflammatory responses (Smeyne et al., 2013). Microglia remains in an overactivated state after LPS stimulation. Also, exposure to LPS during periods of microglial development in utero results in a progressive and growing response to LPS administrations in adult mice (Ling et al., 2002; Langston et al., 1999). This suggests that microglia overactivation induced by LPS, as an early insult may be propagated and intensified through the years, culminating in a continuous and cumulative DA neurons loss, characteristic of the course of this neurodegenerative disorder. This helps us to assume that LPS model can be a great tool to clarify if direct activation of glia, in particular microglia, result in a progressive and selective inflammation-mediated DA neurodegeneration.
1.4 Control of Neuroinflammation by Estrogen Receptors
Microglial activation and its pathogenic inflammation mechanism are behind the cycle of neuronal death that leads to dopaminergic loss in PD and other neurodegenerative disorders. It is needed to find an efficient therapy that stops reactive microgliosis process, halt the neurotoxic factors and microglial activators release and promote the nigrostriatal DA neurons protection.
1.4.1 Role of estradiol on neuroinflammation
Estrogens are signalling molecules that exerts various functions and regulate multiple signaling response, they circulates across the body and have effects on all systems, including the brain (Kuiper et al., 1997). There are three different forms of estrogens: estrone, estradiol and estriol. Estradiol has two isomers, 17α-estradiol and 17β-estradiol (E2), the most potent and the most circulating form of estrogen, with reproductive roles as well as non-reproductive roles, exerting functions in the nervous system, cardiovascular system, immune system, adipose tissue and bone (Rettberg et al., 2015; Turgeon et al., 2006).
E2 is synthesized in the brain, acting as local neuromodulators (Garcia-Ovejero et al., 2005) and also in peripheral endocrine glands such as ovary, placenta and adrenal cortex, and it crosses the blood-brain barrier (BBB), exerting diverse functions in CNS. This hormone is synthesized from cholesterol and acts directly in neurons and glial cells (Garcia-Ovejero et al., 2005). Many years of research suggest that estrogen has a fundamental role on signalling
processes within the brain, exerting its functions through its receptors (Estrogen Receptor α (ERα) and Estrogen Receptor β (ERβ)), widely distributed there, and present in both neurons and glial cells (Ishihara et al., 2015; Rettberg et al., 2015).
Microglial cells and circulating monocytes also express the ERα and ERβ, and E2 controls microglia responsiveness. Evidence shows that E2 regulate the synthesis of inflammatory mediators, induced by LPS (Pozzi et al., 2006). Importantly and regarding this fact, it was observed that E2 may interfere with the transduction signal induced by LPS, preventing the nuclear translocation of NF-κB, a transcription factor of inflammatory genes as referred above (Pozzi et al., 2006; Chakrabarti et al., 2014; Ishihara et al., 2015). Also, estrogen generally acts through nuclear translocation of its receptors, but it is suggested that it can also interfere on intracellular signal transduction pathways. In fact, E2 may cause rapid activation of MAPK pathways in microglial cells and it is thought that such activation is needed for the subsequent anti-inflammatory effects (Camps et al., 1998). The use of the antiestrogen ICI,182,780 blocked the anti-inflammatory effects and the activation of MAPK, which suggests this is an estrogen/ER complex-mediated process (Bruce-Keller et al., 2000). As consequence of the role of E2 and ERs on these mechanisms, gene transcription in microglial cells is altered and release of pro-inflammatory agents such as NO, TNF-α, COX-2, IL-1α and IL-1β, cytokines and chemokines that results from microglial activation can be attenuated (Smith et al., 2011; Vegeto et al., 2006). E2 can also directly modulate chemokine levels, through ERα and ERβ, such as CCL5 and CXCL1, and it is suggested that it can suppress IL-1β and IL-6 after LPS challenge (Brown et al., 2010).
Although estrogen has proved beneficial effects in the brain, human treatment with estrogen is limited by some of the reported side effects that it entails. Recent investigation suggests that long-term hormone exposure may be associated with cancers in ovary and lung (Taylor et al., 2011). Estrogen was also reported to increase the risk of endometrial and breast cancer (Ishihara et al., 2015). Moreover, estrogen induces peripheral actions in reproductive organs, and due to activation of Estrogen Receptors, it causes debilitating secondary effects that limits its use in the clinic.
Therefore, alternative compounds that share some mechanisms of action with E2, inducing the same beneficial impact on neuroinflammation, and with a safer profile to be used in the clinic might represent putative treatments for PD. Regarding this challenge, selective estrogen receptor modulators (SERM) or G protein-coupled estrogen receptor (GPER) could be a possible alternative to estrogen therapy. GPER is involved in many estrogen effects, in various tissues, but it does not induce an estrogenic response in reproductive organs (Bourque et al., 2013).
1.4.2 GPER-mediated protection
As referred above, estrogen may play a neuroprotective role through other signalling actions than ER’s, mediated by pathways involving other receptors, including G-Protein-coupled receptors such as GPR30 (GPER) (Litim et al., 2015).
Human GPER is a G Protein-coupled seven transmembrane receptor, comprising 375 amino acids with a molecular mass of approximately 41kDa (Mizukami, 2010).
There are evidences that this receptor is expressed in various tissues and in multiple regions of the brain, such as the neocortex, hippocampus, thalamus, dorsal striatum, among others (Srivastava et al., 2013). This receptor is expressed by both neurons and glial cells (Brailoiu et al., 2007). Relatively to intracellular localization of GPER, some authors refer that it is localised both in endoplasmic reticulum and Golgi apparatus, others refer that this receptor is also present on the plasmatic membrane, but it has yet to be clarified (Funakoshi et al., 2006; Almey et al., 2012).
GPER is expressed broadly and is involved in many biological functions including the regulation of immunological and circulatory systems and glucose homeostasis. Previous findings have verified that GPER activation may induce thymocyte apoptosis contributing to atrophy of the thymus (Wang et al., 2008) Concerning the cardiovascular functions, GPER may be involved in the reduction of blood pressure, due to the expression of this receptor in the endothelium of peripheral vessels. The production of NO by E2 causes vasodilation, leading to blood pressure alteration, and is suggested that this is a GPER-mediated process (Mizukami, 2010). There are studies reporting that GPER is also expressed in pancreatic islet cells and may interfere with the E2-induced release of insulin, affecting the regulation of blood glucose levels (Mizukami, 2010). These facts suggest that there may be GPER-related diseases such as hypertension or diabetes, and the biological functions of this receptor have to be clarified in the near future.
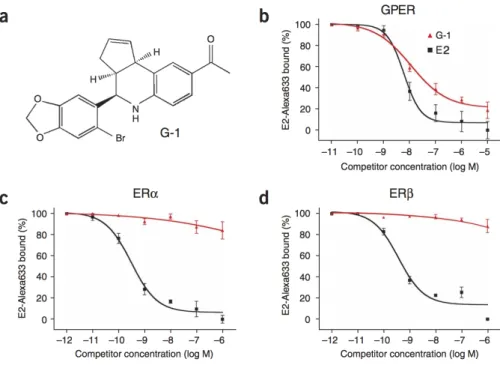
G-1 has been identified as the first GPER-specific agonist. G-1 presents higher affinity to this receptor than several other compounds. It is a lipophilic molecule, a nonsteroidal compound that competes with other ligands, among them E2, 4-hydroxytamoxifen or ICI182,780 (an ER antagonist) to bind GPER (Bologa et al., 2006, Blasko et al., 2009). Moreover, G-1 does not interact with Estrogen Receptors (ERα and ERβ) when competing with E2 (Figure 3).
Figure 3 - Structure of G-1 and ligand binding affinities of G-1. (a) Representation of G-1 chemical
structure. (b-d) Ligand-binding affinity of E2 and G-1 for GPER, ERα and ERβ (adapted from Bologa et al., 2006).
Studies in animal models showed that GPER activation is crucial in the progress of some brain diseases, namely in MS. IL-10 production is a key factor for the severity of this disease, and GPER is suggested to have a role on the regulation of this process, proved by the lack of disease improvement in GPR30KO mice when also treated with a synthetic estrogen (Yates et al., 2010). Also regarding MS, another study showed that GPER activation mediated by G-1 inhibited the LPS-induced production of cytokines, such as TNF-α and IL-6, along with chemokine CCL5 reduction, suggesting that this receptor may reduce the severity of disease and provide an alternative of treatment of inflammatory diseases (Blasko et al., 2009). In what concerns PD, recent work from our group suggests that G-1, by overexpressing GDNF, protects DA neurons from 4-phenylpyridinium (MPP+) toxicity, with the same potency as E2 (Bessa et al., 2015). This suggests that GPER activation may reproduce the neuroprotective effects of E2.
It was observed in animal models that G-1 administration impacts on cognitive tasks, affecting sensory-motor functions, spatial learning and attentional mechanisms (Hammond et al., 2009; Hawley et al., 2014).
It was shown that GPER may induce several beneficial responses in neurodegenerative diseases, but it is also relevant that GPER is broadly expressed and involved in many
biological functions. It is crucial that any therapeutic strategy based on GPER activation occurs selectively, predominantly in the brain, avoiding accumulation in peripheral tissues and adverse side effects. The GPER agonist (G-1) with high selectivity and affinity for GPER has been identified, and may potentially be used as a therapeutic approach of PD.
Chapter 2
Objectives
Objectives
G-1 is a molecule that rapidly scatters through tissues, so it would be highly relevant to compare different ways of administration of this compound, in an animal model. Therefore, subcutaneous and intranasal deliveries were proposed. The subcutaneous administration is the most used form of in in vivo studies and it is proven to be efficient in delivering G-1 to the brain. Noteworthy, nasal mucosa displays a large surface area, where the olfactory receptors are connected to regions of the CNS. Also, this region is highly irrigated with weak BBB that facilitates the migration to the brain, restricting the systemic absorption. This led us to test a different delivery of the molecule, the intranasal delivery.
A recent unpublished work from our group has shown that G-1 administration, with subcutaneous injection, was able to protect DA neurons from a unilateral LPS lesion and also to induce functional recovery in LPS-treated mice. This encouraged us to continue to study the effect of G-1 administration against an LPS lesion, in a PD animal model.
Therefore, the aim of this work was to compare the effectiveness of delivering G1 by two different approaches, subcutaneously and intranasally, on impeding the neuroinflammatory process induced by nigral injection of LPS, and also its effect on dopaminergic lesion and motor impairments.
Chapter 3
Materials and Methods
Materials and Methods
3.1 Animals
For this work, a total of 48 male C57BL/6J mice with approximately 4 months of age and a weight between 19-30g were used. Animals were housed in cages under 12h light/12h dark, with a temperature of 22º. All animals were injected twice a day, according to respective treatment group [(5µg G-1 (Tocris Bioscience) per animal or Phosphate Buffer Saline (PBS) solution (1.4M NaCl, 27mM KCl, 15mM KH2PO4), vehicle] during 18 days. All experiments with animals were executed according to the national ethical requirements for animal research, and in accordance with the European Convention for the Protection of Vertebrate Animals Used for Experimental and Other Scientific Purposes (Directive 2010/63/EU). The use of animals in the current project was previously approved by the national authorities.
3.1.1 Animal Experimental Procedure
Animal testing started with handling of the mice, three days before the beginning of injections, to allow the animals to get used to the procedure and to the person that handles them.
G-1 was administrated subcutaneously, via intraperitoneal injection, with a syringe (Braun). Intranasal delivery was performed with a pipette, touching with the tip in the nasal mucosa of the mice, allowing the fluid to be aspired by the animal.
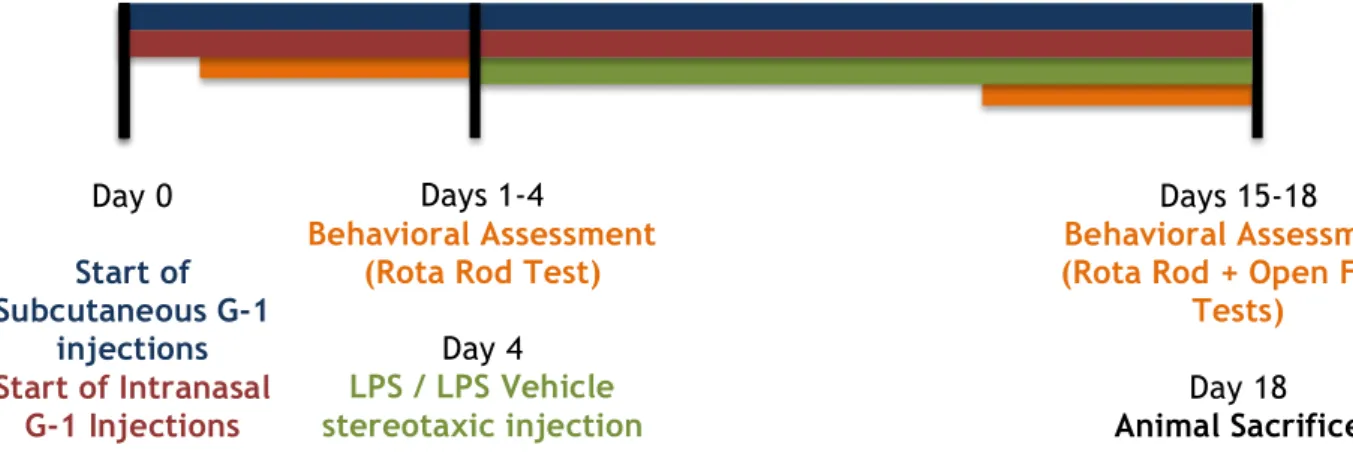
Figure 4 presents the timeline of animal procedure, schematically presenting the days of G-1, or vehicle administrations, stereotaxic injections of LPS (Sigma-Aldrich), behavioral assessment and end of animal testing.
Figure 4 – Schematic representation of animal procedure, used in the in vivo LPS model.
Day 0
Start of
Subcutaneous G-1
injections
Start of Intranasal
G-1 Injections
Days 1-4
Behavioral Assessment
(Rota Rod Test)
Day 4
LPS / LPS Vehicle
stereotaxic injection
Days 15-18
Behavioral Assessment
(Rota Rod + Open Field
Tests)
Day 18
3.1.2 Effect of intranigral LPS injection on the body weight change in
mice
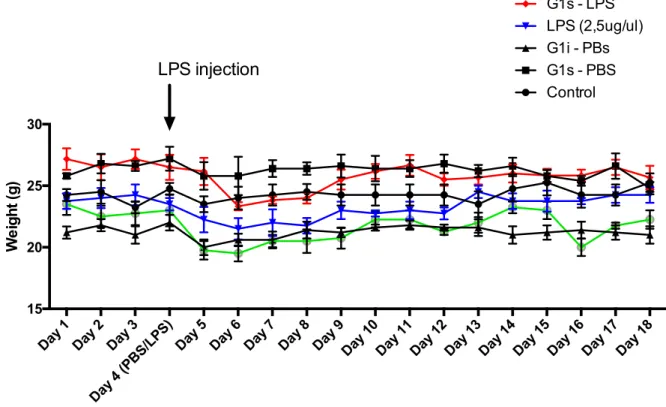
Figure 5 presents the weight change in the mice during the experimental procedure. The body weight was measured everyday, from the first administrations day till the day of animal sacrifices.
Figure 5 – Change of mice body weight during experimental procedure. Bar graph shows weight
change in different treatment groups. Weight was registered from the first day until the last of the animal procedure. Each value represents mean of 5-8 animals from each experimental group.
As verified, and despite minor variations, practically all the animals fully recovered from the slight weight loss that occurred in the days following stereotaxic injection, maintaining the weight until the last procedure day.
3.2 Stereotaxic Surgery and Animal Sacrifices
At day 4, all animals were surgically injected with LPS or LPS vehicle, under anaesthesia, according to treatment group. A bilateral injection of LPS (5µg dissolved in 4µL of PBS) or LPS vehicle (4µL of PBS) was performed using stereotaxic coordinates corresponding to the SN,
Day 1 Day 2 Day 3
Day 4 (PBS/LPS)
Day 5 Day 6 Day 7 Day 8 Day 9 Day 10 Day 11 Day 12 Day 13 Day 14 Day 15 Day 16 Day 17 Day 18 15 20 25 30 We ight (g) Control G1s - PBS G1i - PBs LPS (2,5ug/ul) G1s - LPS G1i - LPS
LPS injection
measured from anatomic location of bregma. Coordinates used were 2.8mm posterior, 1.3mm/-1.3mm lateral to bregma and 4.5mm ventral to the surface of the dura mater. Both LPS and LPS vehicle were injected during 5 minutes, keeping the needle for further 5 minutes after the injection, to allow the complete diffusion and softly removed from the defined location in the brain. This procedure was performed in both sides of the mice brain. Finally, 15 days after stereotaxic surgery, animals under anaesthesia were perfused with NaCl 0,9% through the heart, followed by PFA 4% perfusion by the same method. Brains were removed and stored in PFA 4% at 4ºC. In the next day, the brains were transferred from PFA 4% solution to sucrose solution (30% sucrose diluted in PBS), and two days after brains were stored at -80ºC.
3.3 Brain Slicing Procedure
Before brain slicing in cryostat (Leica CM3050), brains were stored at -20ºC for 2 hours and then moved to the cryostat with object temperature set at -21/-22ºC. Brains were sliced in 35µM thick coronal sections. Slices corresponding to the striatum and the midbrain area that contains SN region were collected to 24 wells plates (Orange Scientific). All brain sections were stored in antifreeze solution (Sodium Phosphate, Milli-q H2O, Sucrose and Ethylene Glycol), at -20ºC, after the slicing procedure.
3.4 Immunohistochemistry Protocol
In order to initialize the immunohistochemistry (IHC) procedure, brain sections were firstly moved from the antifreeze solution to PBS 0,1% Tween (PBS-T) solution, then permeabilized with PBS 1% Triton X-100 solution, three times for 15 min at Room Temperature (RT). After, sections were incubated in PBS-T containing 10% Fetal Bovine Serum (FBS) (Biochrom) for 2h, in order to reduce nonspecific binding of the antibodies. Antibodies were used as indicated in Table 1, diluted in PBS-T containing 10% FBS. Incubation with primary antibodies was performed at 4ºC for 48h. Next, the sections were washed with PBS-T three times for 15 min and incubated with the secondary antibodies, diluted in PBS-T containing 10% FBS, for 2h at RT. After three 15 min washes with PBS-T, the sections were incubated with 2µM Hoechst 33342 (Invitrogen), diluted in PBS-T, for 10 min at RT. Finally, the sections were mounted with DAKO medium (cat. S3023; DAKO) in Superfrost slides, pressing the coverslips against the slide. The slides and coverslips were sealed using nail polish. Fluorescent images from the sections were obtained with a fluorescence microscope (Zeiss) with 20x magnification, collecting images from both sides of the brain of each animal. Images corresponding to the complete Ventral Tegmental Area (VTA), SNpc and Substantia Nigra pars reticulata regions were captured. Images were acquired from four to six sections per animal.
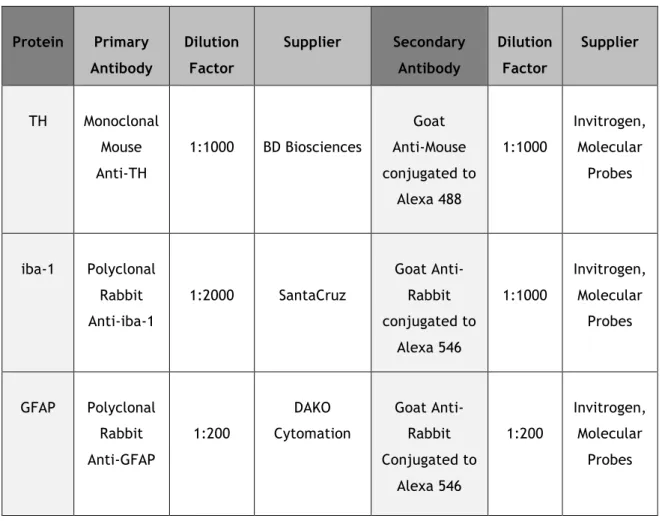
Table 1 – Description of antibodies used in immunohistochemistry assays.
Protein Primary Antibody Dilution Factor Supplier Secondary Antibody Dilution Factor Supplier TH Monoclonal Mouse Anti-TH 1:1000 BD Biosciences Goat Anti-Mouse conjugated to Alexa 488 1:1000 Invitrogen, Molecular Probes iba-1 Polyclonal Rabbit Anti-iba-1 1:2000 SantaCruz Goat Anti-Rabbit conjugated to Alexa 546 1:1000 Invitrogen, Molecular Probes GFAP Polyclonal Rabbit Anti-GFAP 1:200 DAKO Cytomation Goat Anti-Rabbit Conjugated to Alexa 546 1:200 Invitrogen, Molecular Probes
3.5 Behavioral Evaluation
Rota Rod performance test was performed daily during four days before the LPS stereotaxic injection, and also during four days before the last day of the animal procedure. Animals were placed above a rotating rod (cat. 47600; UGObasile), accelerating from 4rpm to 40rpm during 300 seconds. The time of fall of each mouse, in seconds, was registered. Each daily test consisted of four assays, with intervals of twenty minutes between assays. The first three days of the Rota Rod test were used as a trial, and the 4th day was used for posterior analysis, after calculating the mean time of the four assays.
The Open Field test was performed on the last day of the animal procedure. Animals were placed into an arena with walls, preventing their escape (ActiMot2, TSE Systems). The infrared beams of the apparatus processes the assessment, and measures patterns such as the grid line crossings, total distance travelled inside the platform, total distance travelled in the center of the square, elevations performed and some other parameters (PhenoMaster). The procedure was performed only once with a duration of 10 minutes, with no stressful conditions.
3.6 Statistical Analysis
Data are expressed as percentages of values comparing to control conditions or as total number of cells or counts, and are presented as mean ± Standard Error of the Mean (S.E.M) of at least three animals. Statistical analysis was performed using Student’s t-test. Values of P<0.05 were considered significant. All statistical procedures were performed using GraphPad Prism 6 (GraphPad Software, Inc.).
Chapter 4
Results
Results
As referred above, astrocyte and microglia plays a crucial role in neuroinflammation, acting as a friend or a foe on the degeneration of DA neurons in PD. If astrocytes are essential to neuronal support, they have also the potential to induce neuronal toxicity in response to different insults, and importantly, they activate and recruit microglia (Sofroniew, 2005). Microglial activation further enhances the cycle of neuronal death (Halliday et al., 2011; Block et al., 2007). In order to evaluate the putative protection effect of the subcutaneous and intranasal injection of G-1 in the loss of DA neurons induced by nigral injection of LPS we assessed the number of dopaminergic neurons through an IHC against the dopaminergic marker Tyrosine Hydroxylase (TH). TH is the enzyme responsible for the conversion of the amino acid L-tyrosine to L-3,4-dihydroxyphenylalanine (L-DOPA) (Kaufman et al., 2016), the first step in the synthesis of catecholamines. TH is a broadly used marker for dopaminergic neurons.
4.1 Evaluation of dopaminergic cell loss
As verified in Fig. 6, the number of TH+ neurons in the SN decreased to 63,7% of control in animal exposed to LPS. However, in animals treated with G-1, either by subcutaneous or intranasal delivery, the number of TH+-neurons in LPS-lesioned animals increased 19,86% and 42,02% respectively, comparing to control. Although the differences were not statistically significant the data suggest that G1-treatment induce a protection/recovery from the LPS-induced degeneration of DA neurons. Despite the fact that LPS was injected in the SN, our results showed that the dopaminergic lesion induced by LPS extended to the VTA. The number of TH+-neurons in the VTA area was reduced to 67,8% of control in LPS treated animals (32,2% reduction). The dopaminergic loss induced by LPS was reduced by intranasal delivery of G-1 (8,67% of loss in comparison with control animals).
(A) Control LPS TH (B) (C) Control G1s - PBS G1i - PBS LPS (2,5ug/ul) G1s - LPS G1i - LPS 0 50 100 150 No . o f T H immu n o p o s iti v e n e u ro n s n=7 n=7 n=7 n=7 n=5 n=7 Control G1S - PBS G1i - PBS LPS (2,5ug/ul) G1S - LPS G1i - LPS 0 50 100 150 No . o f T H immu n o p o s iti v e n e u ro n s n=7 ** n=7 n=4 n=7 n=7 n=7
Figure 6 – (A) Representative image of the IHC using TH marker to quantify dopaminergic neurons, comparing control group with LPS group. The images were acquired using fluorescence microscope (Zeiss) with 20x and 63x magnification. (B) Effect of G-1 administration on LPS-induced nigral dopaminergic cells loss. (C) Effect of G-1 administration on LPS-induced loss of VTA dopaminergic cells. Bar graph shows number of TH+ neurons in different treatment groups. Counts were made from
the mean of 5/6 sections, for each animal (n). Statistical significance ** p≤0.01 with respect to control group. Each value represents mean ± standard error of the mean (SEM) of the number of animals indicated from each experimental group.
4.2 Microglia reactivity
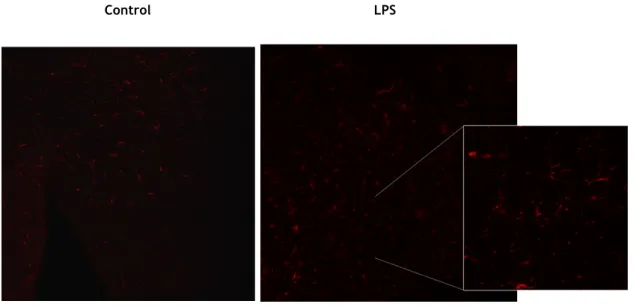
In order to determine if the effect in the dopaminergic loss correlate with the glial reactivity induced by LPS we next analysed the expression of microglial markers in the SN. The results shown in Fig. 7 were obtained from IHC for iba-1 marker, also known as AIF-1 (allograft inflammatory factor-1) or MRF-1 (microglia response factor), which is currently described as a selective marker for microglia (Wu D. et al., 2005). iba-1 is selectively expressed in microglia and the expression of this marker can be correlated with microglia reactivity.
The results show that LPS injection induced a significant increase (116,82% increase) in the mean intensity of iba-1+ marker. Which confirms the neuroinflammatory effect induced by LPS. Interestingly intranasal administration of G-1 administration prevented the increase in 1 intensity, whereas the subcutaneous G-1 was unable to modify the effect of LPS on iba-1 labelling. Moreover, subcutaneous administration of G-iba-1 in the absence of LPS induced an increase on iba-1 staining intensity, which suggests that repetitive subcutaneous injections with G1 may enhance local inflammation and somehow spread to neuroinflammation exerted by microglia.
(A)
Control LPS
iba-1
Figure 7 – (A) Representative image of the IHC using the iba-1 marker to quantify microglial activation, comparing control group with LPS group. The images were acquired using fluorescence microscope (Zeiss) with 20x and 63x magnification. (B) Effect of G-1 administration on LPS-induced microglial activation in the SNpc of the mice. Bar graph shows the mean intensity of iba-1 marker in
different treatment groups. Mean intensity was obtained from 5/6 sections, in each animal (n). Statistical significance **** p≤0.0001 with respect to control group, ## p≤0.01 with respect to LPS group and $$ p≤0.01 with respect to G-1 administration groups. Each value represents mean ± SEM of the number of animals indicated from each experimental group.
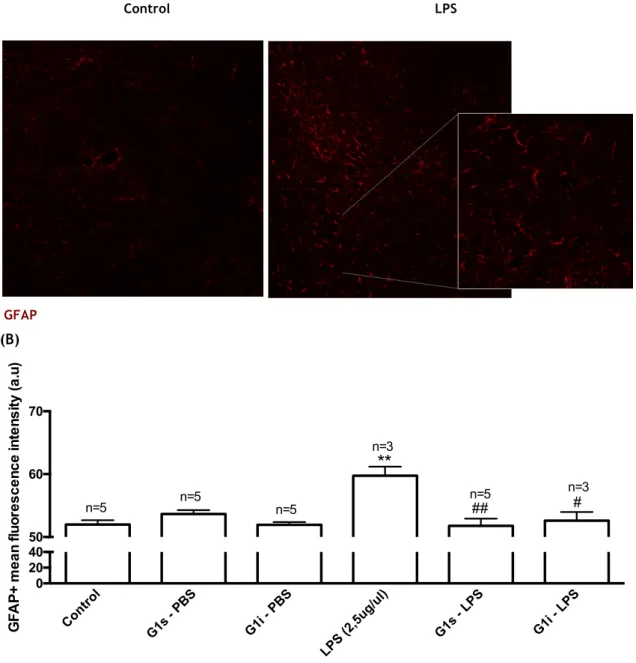
4.3 Astrocytic reactivity
The results shown in Figure 8 were obtained from IHC for the astrocytic marker GFAP. This protein is expressed by numerous cell types of CNS, including astrocytes, and is used as a astrocyte marker (Roessmann et al., 1980). An increase of GFAP expression correlates with astrocyte reactivity, and therefore this protein was used to analyse the effect of G-1 administrations after LPS injection on the reactivity of these cells. Exposure to LPS significantly increased GFAP labelling by 14,96%, when compared to the control (p≤0.01). GFAP intensity was not affected by G-1 administrations, subcutaneous or intranasal, per se. Interestingly, G-1 administrations, either subcutaneous or intranasal, totally impeded the effect of LPS on astrocyte reactivity.
Control G1s - PBS G1i - PBS LPS (2,5ug/ul) G1s - LPS G1i - LPS 0 4 8 12 iba -1 + m e a n f luor e s c e nc e int e ns ity (a .u)
****
n=7 n=7 n=7 n=7 n=7 n=4 ##****
$$(A)
Control LPS
GFAP
(B)
Figure 8 – (A) – Representative image of the IHC using the GFAP marker to quantify astrocyte activation, comparison of control group and LPS group. The images were acquired using fluorescence microscope (Zeiss) with 20x and 63x magnification. (B) - Effect of G-1 on GFAP fluorescence intensity in the SNpc of the mice exposed to LPS. Bar graph shows the mean intensity of
GFAP marker in different treatment groups. Mean intensity was obtained from 5/6 sections, in each animal (n). Statistical significance ** p≤0.01 with respect to control group and # p≤0.05, ## p≤0.01 with respect to LPS group. Each value represents mean ± SEM of the number of animals indicated from each experimental group. Control G1s - PBS G1i - PBS LPS (2,5ug/ul) G1s - LPS G1i - LPS 0 20 40 50 60 70 GFA P + m e a n f luor e s c e nc e int e ns ity (a .u)
**
n=5 n=5 n=5 n=3 n=5 n=3 # ##4.4 Behavioural assessment
4.4.1 Assessment of motor functions
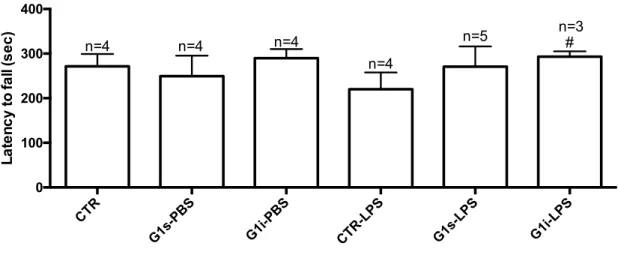
Behavioural assessment were obtained from Rota Rod Performance Test, performed in 4th and 18th days of experimental procedure and Open Field Test, performed in the 18th day. Figure 9 presents the results from Rota Rod test, and Figures 10,11 and 12 present different parameters from the Open Field test. From Rota Rod test we can assess the mice motor capabilities, where the scale measures the length of time that a mice stands on the rotating rod, which may be correlated with the balance, coordination and physical condition of the mice. We verify a slight decrease in latency to fall in the LPS-treated mice, 18,87% decrease when comparing to control, although with no statistical significance. G-1-treated mice presented an increase in the latency to fall, 22,99% increase and 33,07% increase for animals treated with subcutaneous and intranasal administrations respectively, when comparing to LPS-treated mice.
Figure 9 – Effect of G-1 administration on the LPS induced motor impairments assessed by the Rota Rod Test. Statistical significance # p≤0.05 with respect to LPS group. Each value represents mean ± SEM
of 4 assays, from the number of animals indicated from each experimental group.
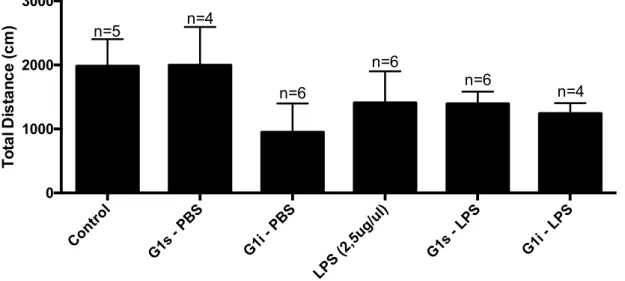
In the Open Field test we can measure both the locomotor activity and exploration skills of the mice. In this test, non-stressful conditions are required, such as no habituation, reduced noise and low lighting conditions, and the experiment must be short-lasting (no more than 10 minutes). These conditions were ensured during the procedure. Figure 10 describes the total distance travelled inside the platform and Figure 11 presents the number of elevations performed. We verify that LPS treated mice present lower values on both parameters, as compared to the control group. Also, no recovery on these parameters was observed with the different administrations of G-1. CTR G1s-PBS G1i -PBS CTR-LPS G1s-LPS G1i-LPS 0 100 200 300 400 La te nc y to f a ll ( s e c ) n=4 n=4 n=4 n=4 n=5 n=3#