UNIVERSIDADE DA BEIRA INTERIOR
Ciências Sociais e Humanas
The assessment of a world-ranked wheelchair
sprinter aerodynamics analysis by computer fluid
dynamics
Pedro Miguel Gomes Forte
Tese para obtenção do Grau de Doutor em
Ciências do Desporto
(3º ciclo de estudos)
Orientador: Prof. Doutor Daniel A. Marinho Orientador: Prof. Doutor Tiago M. Barbosa
“Pouco conhecimento faz com que as pessoas se sintam orgulhosas. Muito conhecimento, que se sintam humildes…”.
Leonardo Da Vinci
Academic thesis submitted with the purpose of obtaining a doctoral degree in Sport Sciences according to the provisions of Portuguese Decree-Law 107/2008 of 25 June.
Funding
This thesis was supported by National Funds through FCT - Portuguese Foundation for Science and Technology (UID/DTP/04045/2013) - and the European Fund for regional development
Acknowledgments
First of all, I would like to thanks the Sports Department of the University of Beira Interior. Without all the members and this institution this work would not be the same.
Second, thanks to Professors Daniel Marinho and Tiago Barbosa for their supervision. Without them this work was not possible to be concluded. Thank you for your exceptional knowledge and patience.
To professors Pedro Morouço and Jorge Morais for their contribution to my academic formation, to provide me solutions and for their attention in these years. A special thanks also to professor Jorge Morais to follow my formation along the last five years.
To my girlfriend Lúcia Ribeiro, for her patience in this work development, to believe and encourage me. Thanks for your affection, you were always there. Even more, without you this work was not possible to be concluded.
To my family, specially parents and brother. To my parents for the values they had transmitted to me, my education and for the men they helped me to be. To my brother, for the example of perseverance. Thanks for teaching me that, when it depends of us, it will be become truth for sure. To my grandmother for all the worries with me. Finally, my aunt Maria José, you helped me a lot during my academic formation. Thanks to all.
To my friends and colleges, Eric, Marisa, Flávio and Ana. Thank you Pe. José Antonio, we do know how much you helped me, thanks for the conversations, the worries and the presence. To all that i did not refer but that encouraged me to proceed the studies, for asking and worry with me. Thank you.
List of Publications
This doctoral thesis is supported by the following publications:
Forte, Pedro; Marinho, Daniel A; Barbosa, Tiago M. (2015). Technologic Appliance and Performance Concerns in Wheelchair Racing – Helping Paralympic Athletes to Excel. New Perspectives in Fluid Dynamics, ed. Chaoqun Liu, 101 - 121. ISBN: 978-953-51-2228-9. Rijeka: InTech.
Forte, Pedro; Marinho, Daniel A; Morouço, Pedro; Barbosa, Tiago M. (2016). CFD analysis of head and helmet aerodynamic drag to wheelchair racing. 1st International Conference on Technology and Innovation in Sports, Health and Wellbeing (TISHW), 1-6.
Forte, Pedro; Marinho, Daniel A; Morais, Jorge E; Morais; Morouço, Pedro G; Barbosa, Tiago M. (2016). Comparison by computer fluid dynamics of the drag force acting upon two helmets for wheelchair racers. AIP Conference Proceedings 1863(1): 520005 – 520008.
Forte, Pedro; Marinho, Daniel A; Morais, Jorge E; Morouço, Pedro G; Barbosa, Tiago M. 2018. "The variations on the aerodynamics of a world-ranked wheelchair sprinter in the key-moments of the stroke cycle: A numerical simulation analysis", PLOS ONE 13, 2: e0193658 - e0193658.
Forte, Pedro; Marinho, Daniel A; Morais, Jorge E; Morais; Morouço, Pedro G; Barbosa, Tiago M. (2018). Estimation of mechanical power and energy cost in elite wheelchair racing by analytical procedures and numerical simulations. Computer Methods in Biomechanics and Biomedical Engineering.
Resumo
A analise da aerodinâmica desempenha um papel determinante nas provas de velocidade em cadeiras de rodas. Assim, o objetivo desta tese passou por analisar a aerodinâmica de um sujeito das provas de velocidade em cadeiras de rodas, com recurso à análise computacional de fluidos. Para tal, foram realizados quatro estudos, uma revisão de literatura e três estudos empíricos. Foram objetivos dos estudos: (i) rever a literatura quanto ao estudo da aerodinâmica das provas de velocidade em cadeiras de rodas; (ii) comparação de dois capacetes do tipo contrarrelógio e pista em duas posições (olhar em frente e olhar para baixo); (iii) comparação aerodinâmica entre as diferentes fases de um ciclo de puxada com recurso às simulações numéricas; (iv) estimativa da potência mecânica e custo energético num sprinter das provas de velocidade em cadeiras de rodas através de procedimentos analíticos e simulações numéricas. As principais conclusões obtidas foram que: (i) existe pouca literatura e conhecimento acerca das provas de velocidade em cadeiras de rodas, nomeadamente no estudo da aerodinâmica com recurso às simulações numéricas; (ii) os capacetes contrarrelógio são mais efetivos desde que o atleta mantenha o olhar em frente tanto quanto possível; (iii) a aerodinâmica de um atleta das provas de velocidade em cadeiras de rodas variou nas diferentes fases do ciclo de puxada; (iv) a potência mecânica e custo energético foram maiores na fase da pegada, seguida da largada e por fim a fase de recuperação. A principal conclusão desta tese é que torna-se possível melhorar a aerodinâmica de um sujeito das provas de velocidade em cadeiras de rodas através do correto uso do capacete ideal e mantendo tanto quanto possível o alinhamento e sincronização corporal durante as puxadas.
Palavras-chave
Abstract
Aerodynamics can play an important role in the performance of a wheelchair spinter. The aim of this thesis was to analyse the aerodynamics of a wheelchair sprinter by computer fluid dynamics. This thesis comprises a series of four studies (a review of the literature and three
empirical studies). The studies aimed to: (i) review the literature on aerodynamics in wheelchair racing; (ii) compare two different helmets (road vs time trial) at several speeds and head positions by CFD. (iii) assess the aerodynamics in different key-moments of the stroke cycle by CFD; (iv) compare the mechanical power and energy cost of transportation delivered by an elite wheelchair sprinter in key-moments of the stroke cycle. The main conclusions were: (i) there is a lack of research on wheelchair racing aerodynamic’s assess by CFD; (ii) a time trial helmet imposed lower drag keeping a neck hyperextension; (iii) the aerodynamics of a wheelchair racing athlete varied over the different phases of the stroke cycle; (iv) the mechanical power and energy cost in elite wheelchair racing varied in different phases of the stroke cycle. The main conclusion of this thesis was that it is possible to enhance the aerodynamics of a wheelchair sprinter by selecting the best sport garement and equipment, as well as keeping a good body alignment in the key-phases of the stroke cycle.
Keywords
Table of Contents
Acknowledgment vii
List of Publications ix
Resumo xi
Abstract xiii
List of Figures xvii
List of Tables xix
List of Abbreviations xxi
Chapter 1. General Introduction 1
1.1. Background 1
1.2. Aerodynamics 1
1.3. Drag Assessment by Computer Fluid Dynamics 2
1.4. Research Gap 3
1.5. Aims 3
1.6. Hypotheses 3
1.7. Significance of the study 4
1.8. Thesis structure 4
Chapter 2. Technologic Appliance and Performance Concerns in Wheelchair
Racing – Helping Paralympic Athletes to Excel. 5
2.1. Introduction 6
2.1.1. The wheelchair race 6
2.2. Main Determinants in Wheelchair Racing 9
2.2.1. Propulsion 12
2.2.2. Inertia 13
2.2.3. Air Drag and Rolling Resistance 14
2.3. Analytical Models, Experimental Testing and Numerical Simulations
in Wheelchair Racing 14
2.3.1. Experimental testing: Coast-down Technic 14
2.3.2. Wind tunnel testing 16
2.3.3. Analytical method for drag assessment 16
2.3.4. Numerical simulations: Computer Fluid Dynamics 17
2.3.5. Numerical Simulations on Wheelchair Racing 21
2.4. Summary and Conclusions 22
Chapter 3. Comparison by computer fluid dynamics of the drag force acting upon
3.2. Methods 27
3.3. Results 28
3.4. Discussion 29
3.5. Conclusion 29
3.6. Practical Applications 30
Chapter 4. The variations on the aerodynamics of a world-ranked wheelchair sprinter in the key-moments of the stroke cycle: a numerical simulation analysis. 31
4.1. Introduction 32
4.2. Methods 34
4.2.1. Subject 34
4.2.2. Scanning the model 34
4.2.3. Numerical simulation 35 4.2.4. Boundary Conditions 36 4.2.5. Outcomes 37 4.3. Results 37 4.4. Discussion 40 4.5. Conclusion 43 4.6. Practical Applications 43
Chapter 5. Estimation of mechanical power and energy cost in elite wheelchair
racing by analytical procedures and numerical simulations. 45
5.1. Introduction 46
5.2. Methods 48
5.2.1. Participant 48
5.2.2. Scanning the Model 48
5.2.3. Boundary Conditions 49
5.2.4. Numerical Simulation 49
5.2.5. Drag force 50
5.2.6. Mechanical Power and Energy Cost 50
5.3. Results 51
5.4. Discussion 53
5.5. Conclusion 56
5.6. Practical Applications 56
Chapter 6. General Discussion 57
Chapter 7. Overall Conclusion 61
7.1. Conclusions 61
7.2. Limitations 61
7.3 Suggestions for Future Research 61
List of Figures
Chapter 2. Technologic Appliance and Performance Concerns in Wheelchair Racing – Helping Paralympic Athletes to Excel.
Figure 1. Stroke cycle in wheelchair racing. 7
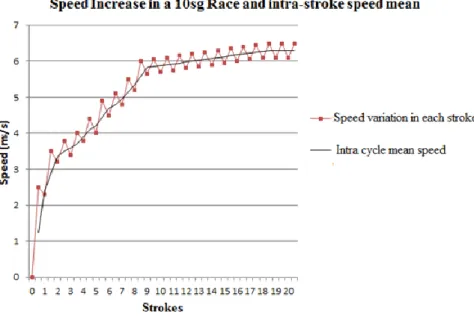
Figure 2. Theoretical representation of the speed over time in 20 stroke cycles. 8
Figure 3. Free body diagram in wheelchair racing [21]; FI – Inertial force; FD – Drag force; FR – Rolling friction forces; FA – The applied force by the ground on the rear wheels.
10
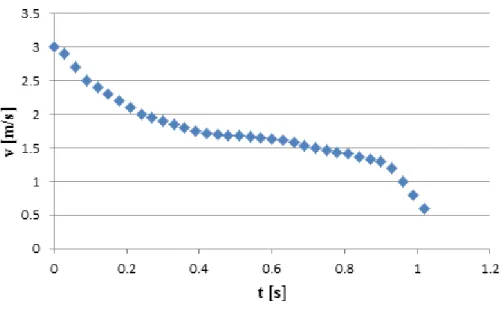
Figure 4. The velocity decay of a manual wheelchair over a typical trial. 16
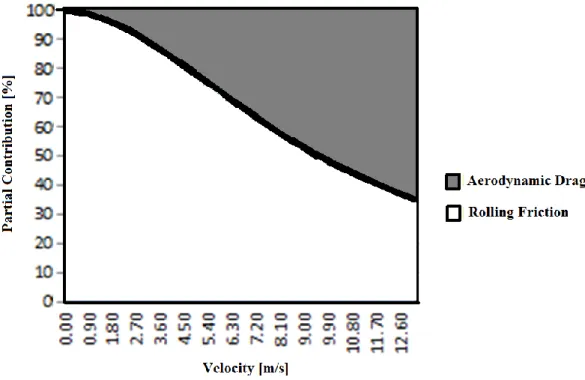
Figure 5. Partial Contribution of aerodynamic drag and rolling friction by Barbosa
et al. (2014). 17
Figure 6. CFD methodology of a scanned model in TotalSim
(http://www.totalsimulation.co.uk/wp/cfd-image-gallery/). 22
Chapter 3. Comparison by computer fluid dynamics of the drag force acting upon two helmets for wheelchair racers.
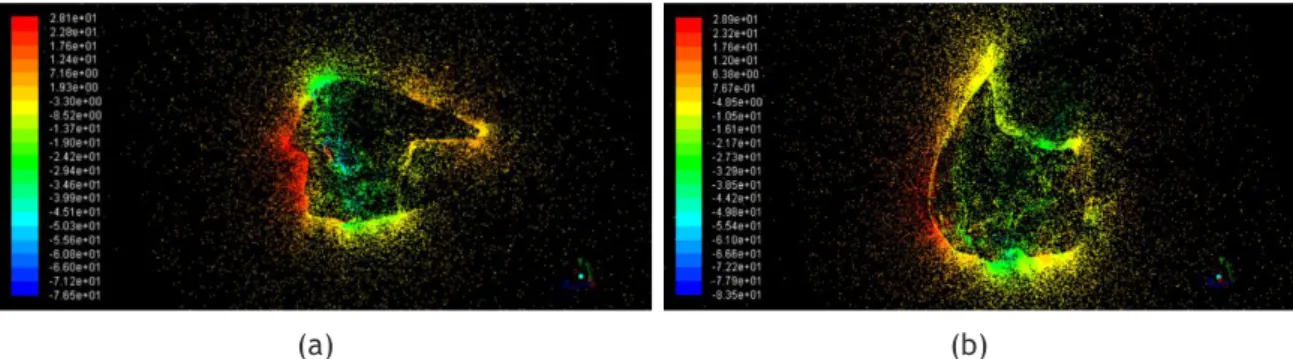
Figure 1. Static pressure zones of the time-trial helmet at 0º (a) and 90º (b)
position, at 6.5 m/s. 28
Figure 2. Flow velocity vectors at 6.5 m/s coloured by static pressure on the
surface area in time-trial helmet at 0º (a) and 90º position (b) respectively. 28
Chapter 4. The variations on the aerodynamics of a world-ranked wheelchair sprinter in the key-moments of the stroke cycle: a numerical simulation analysis.
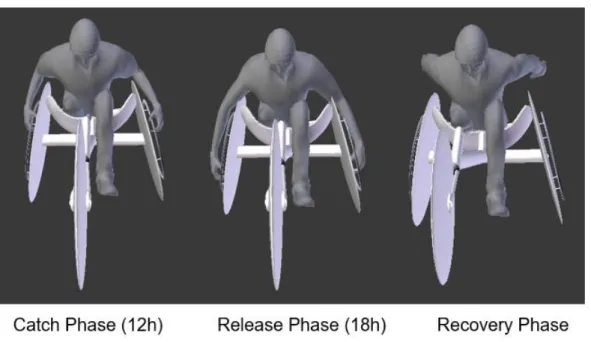
Figure 1. Three different scanned positions: (i) catch (i.e., the beginning of the propulsive phase, being the hands in the 12h position on the hand-rim); (ii) the release (i.e., hands in the 18h position on the hand-rim) and; (iii) recovery phase (i.e., hands do not touch the hand-rim and are hyperextended backwards) respectively
35
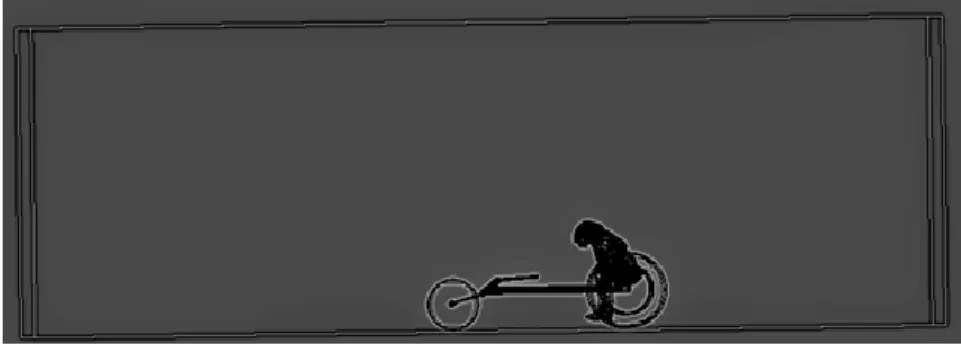
Figure 2. Wheelchair-athlete system in the enclosure. 36
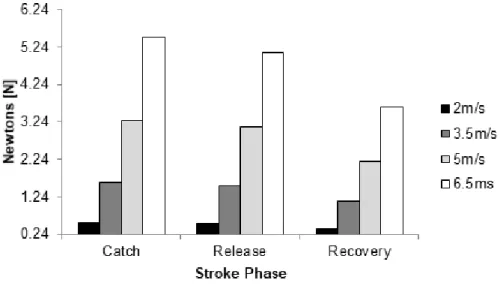
Figure 3. Viscous drag over the stroke cycle at 2.0 m/s (black column), 3.5m/s
(dark grey column), 5.0 m/s (light grey column) and 6.5 m/s (white column). 37 Figure 4. Pressure drag over the stroke cycle at 2.0 m/s (black column), 3.5m/s
grey column), 5.0 m/s (light grey column) and 6.5 m/s (white column).
Figure 6. Effective area over the stroke cycle at 2.0 m/s (black column), 3.5m/s
(dark grey column), 5.0 m/s (light grey column) and 6.5 m/s (white column). 39
Chapter 5. Estimation of mechanical power and energy cost in elite wheelchair racing by analytical procedures and numerical simulations.
Figure 1. CAD model of the three different scanned positions: (i) catch phase; (ii)
the release phase and; (iii) recovery phase respectively 48
Figure 2. Power to overcome drag (Pd), external mechanical power (Pext) and total power (Ptot) in the three key-moments of over the stroke cycle at 2.0, 3.5, 5.0 and 6.5.
52
Figure 3. Energy cost (C) over the three key-moments of the stroke cycle at 2.0,
List of Tables
Chapter 3. CFD Analysis of Head and Helmet Aerodynamic Drag to Wheelchair Racing.
List of Abbreviations
ACd Effective surface area
Ad Surface area
C Energy Cost
CCD Coast-down distance
Cd Drag coefficient
CFD Computer fluid dynamics
CR Rolling coefficient
FA Applied force by the ground on the rear wheels
Fd Drag force FI Inertial force gr Grams k Kinetic energy Kg Kilograms m Meters N Newtons
Pd Power to overcome drag
Pext External Mechanical Power
Ptot Total Power
RANS Reynolds-Averaged Navier-Stokes
S Seconds
Chapter 1. General Introduction
1.1. Background
There is a concern about not to include people with disabilities in several areas of society (Duarte & Santos, 2003). Sports play an important role in including people with disabilities in the society (Paciorek, 2004; Winnick, 2004).
Wheelchair sports appeared after World War II. The first wheelchair games were organized in 1948. In 1952 were organized the first international wheelchair sporting competition for disable people (Cooper, 1990). Wheelchair racing was recognized as an Olympic sport in 1986. Paralympics are the major event for athletes with disabilities. Now, every race detail may help athletes to excel and define new strategies. The subject participations are in accordance to their category and injury type in spine C5-6, C7-8, T1-7e T8-S4 for the classes T51, T52, T53 and T54 respectively (IPC, 2007).
In wheelchair racing, the athlete had to push the handrim to generate motion (Cooper, 1990; Fuss, 2009; Forte, Marinho and Barbosa, 2015). It is possible to divid the stroke cycle in propulsion and and recovery. The propulsive moment is subdivided in: the catch phase (the hand contact moment on the handrim, usually near 12 and 14 o’clock); drive (is the moment that the hand wrist acceleration on the handrim); and release phase (the time period that the hand does not contact on the handrim) (Fuss, 2009). The recovery moment is the period of time between the release moment and a new catch moment. During the two moments is possible to observe three or four equilibrium horizontal forces. During the propulsion it is possible to observe the inertial force in negative direction in pair with drag and rolling friction force. The generated force by the ground on the rear wheel as a positive direction. In the recovery phase, the forces are the rolling resistance, aerodynamic drag and inertial (Petrushov, 1998; Fuss, 2009). Thus, to reach a higher acceleration, the inertial force and the ground force on the rear wheels must be maximized. The rolling friction and drag must be minimized to sooner reach and maintain the maximal speed. Then, it is possible to observe that drag plays an important role in athlete’s performance.
Candau, 2002). At world record speed, drag force may account by 34.89% of the overall resistive forces (Barbosa et al., 2014). The aerodynamics of the wheelchair-athlete system, is mainly determined by the frontal area and the subject’s posture. The drag area in racing wheelchairs ranges between 0.123 and 0.145 m2 (Fuss, 2009).
The rolling friction and drag encompasses the resistive forces. The drag reduction will minimize the resistive forces. For that, during the race, some athlete’s concerns are the head and body alignment (Barbosa et al., 2016). Equipment’s such as helmets may help to reduce the aerodynamic drag. The ideal body position may also contribute about 10% for aerodynamic drag reduction (Harder et al. 2010). Reducing the drag, athlete’s will need less effort to reach the maximal speed.
1.3. Drag Assessment by Computer Fluid Dynamics
It is possible to measure the aerodynamic drag by analytical procedures, experimental tests and numerical simulations by computer fluid dynamics (CFD) (Forte, Marinho and Barbosa, 2015). CFD is a biomechanics subarea that analyses the fluid flow behaviour around an object. This methodology consists in the discretization of Navier-Stokes equations by the finite volumes approach. These equations are underpinned by Newton’s second law of fluid mechanics. It is assumed that the fluid stress is the sum of its viscosity diffusion resulted from the applied pressure term. The equations solution determines the fluid velocity in a given space and time moment. Then, CFD is based in one approximated finite volume. The space is subdivided in small particles intending to generate a mesh of greed. Then, an algorithm is applied to resolve the volume motion equations (Marinho, et al., 2012). CFD can be used to predict the fluid flow behaviour, the mass and hot transference, chemic reactions and other related issues. This analysis allows to answer different questions without resource to experimental tests. CFD can provide a bridge between theory and practice and could be used for aerodynamics studies (Lyttle & Keys, 2006).
In sports sciences, CFD has presented validity and accuracy in different fluids, bodies and tasks in sports. It has been validated and classified as feasible in hydro and aerodynamics testing (Liu, 2002). CFD has been presented as a valid and appropriated instrument assess aerodynamics and to simulate wind tunnel testing (Forte, Barbosa & Marinho, 2015; Dabnichki & Avital, 2006).
CFD is a reproducible methodology, in experimental tests the outputs may depend of several factors. This does not occur in numerical simulations where the output depends only from the input (Dabnichki & Avital, 2006).
Chapter 1. General Introduction
1.4. Research Gap
The athlete’s posture and equipment’s use seem to influence drag. To better understand the equipment’s and posture influence on drag, aerodynamics analysis must be performed. It was not founded any study in literature about wheelchair racing aerodynamics analysis by CFD. However, is is possible to find some studies assessing aerodynamics by experimental tests and analytical models. Thus, there is a need to fulfil this lack of research assessing the aerodynamics of a wheelchair racer by CFD. Then, it becomes possible to provide details about pressure, viscosity and total drag, respective drag coefficients, effective surface area and estimate the mechanical power and energy cost to overcome the resistive forces.
1.5. Study aims
This thesis aimed to:
Review the literature on aerodynamics in wheelchair racing;
Compare two different helmets (road vs time trial) at several speeds and head positions by CFD.
Assess the aerodynamics in different key-moments of the stroke cycle by CFD;
Compare the mechanical power and energy cost of transportation delivered by an elite wheelchair sprinter in key-moments of the stroke cycle.
1.6. Hypotheses
The hypotheses under testing were:
There is a lack of research in the use of numerical simulations by CFD in wheelchair racing.
A time trial helmet is more effective compared to a track helmet keeping a neck hyperextension.
The aerodynamics of a wheelchair racing athlete varies in different phases of the stroke cycle.
The mechanical power and energy cost in elite wheelchair racing vary in different phases of the stroke cycle.
Chapter 1. General Introduction
1.7. Significance of the study
This thesis gave insights about the type of helmet to wear. This may prevent that para-athletes adopt postures and/or positions that can impair the aerodynamics and ultimately their performance. This thesis may help athletes about which garment’s wear and body postures and positions adopt during a sprinting event.
Based on the findings reported here, researchers may design, produce and customize helmets for a specific athlete. Advice on the athlete’s positions and helmets to be wear can also be provided. Knowing athletes drag, coaches can also estimate the mechanical power and energy cost of the athletes at different positions and speeds. Based on this work, coaches should develop an evidence-based practice basing their sets on a target mechanical power.
1.8. Thesis structure
This thesis is composed by a series of four studies:
Chapter 2 is a revision of the determinant factors in wheelchair racing sprinting events, technological appliance in this modality and aerodynamic drag evaluation methods.
Chapter 3 compares the differences between aerodynamic drag in two different positions (looking downwards and forward) with a time-trial helmet at different speeds.
Chapter 4 compares the variations on the aerodynamics of a world-ranked wheelchair sprinter in the key-moments of the stroke cycle: a numerical simulation analysis. Chapter 5 compares an estimation of mechanical power and energy cost in elite
wheelchair racing by analytical procedures and numerical simulations.
As last chapter a final discussion will be presented by the presented studies (Chapter 4), followed by the main conclusion and limitations of this study (Chapter 5). Some suggestions for further studies are presented in chapter 6.
Chapter 2. Technologic Appliance and
Performance Concerns in Wheelchair
Racing – Helping Paralympic Athletes to
Excel.
Abstract
Numerical simulations have provided useful evidence in helping several sportsmen to excel in their field. This methodology aims to have a deeper understanding on the influence of equipment and sports techniques on sports performance. In wheelchair racing, technology was used without considering specific sport (some of the Paralympic sports used the same technology of their Olympic counterparts). It has induced unique changes in prosthetic and wheelchair devices. Eventually, technology has become an essential part of Paralympic sports, wheelchair-racing being one of the most popular events. Numerical simulations can help us gather evidence on the effects of drag force acting upon the athlete-chair system. Different types of wheelchairs are designed for racing (track and road races), net, and invasion sports. One of the various strategies to enhance performance is to minimize the aerodynamic drag of the frame, tires, helmet, sports outfit, and body posture.
Numerical simulations can be used to predict the fluid dynamics.
The goal of this chapter is to review the state-of-the-art numerical simulations and suggest further studies in wheelchair racing. The chapter will include sections covering: (i) main determinants in wheelchair racing; (ii) the effect of aerodynamic force in in wheelchair racing performance; (iii) analytical models, experimental testing, and numerical simulations in wheelchair racing; and (iv) numerical simulations on equipment and techniques.
Chapter 2. Technologic Appliance and Performance Concerns in Wheelchair Racing – Helping Paralympic Athletes to Excel.
2.1. Introduction
Wheelchair racing it’s a major event in Paralympics. In this sport are held races from short (100m) to long distances (42km). The athletes are classified according to their condition into classes (T5i, i.e., i=1, 2, 3 and 4 with injuries at C5-6, C7-8, T1-7 and T8-S4 respectively) (IWAS, 2008; IPC, 2007)]. In wheelchair racing sports science, has been expressed as a need the modelling and computer simulations of racing wheelchairs and the racing itself (Depaux, 1986; Depaux, 1988).
In 1960 took place in Rome, the first games for disabled persons in pair with the Olympic Games. Pioneer research on wheelchair racing happened in the 1980s based on high-speed films at laboratory or running track settings (Cooper, 1990c). In the 1980s, manufacturers estimated that more than 10,000 racing wheelchairs commercialized worldwide (Lakomy, Cambell & Williams, 1987). Being this sport increasingly popular, the competitions became tighter between contenders and research is eagerly needed to help Paralympic athletes to excel.
These days, most world-ranked Paralympic athletes, including wheelchair racers, develop an evidence-based practice with the help of coaches and sports analysts. Every detail of a race is deeply examined to have a deeper insight of the determinant factors that might help to excel. The resistance acting on the wheelchair racer is one of the major concerns for practitioners. The resistance force having an opposite direction to the displacement must be minimized so that for a given amount of thrust, the subject can reach a higher acceleration and speed. Lately a few research projects were reported in the literature under this topic. So, the aim of this chapter is to review the state of the art on the numerical simulations in wheelchair racing and suggest further studies in the sport.
2.1.1. The wheelchair race
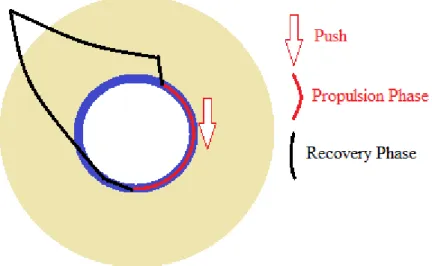
The stroke cycle in wheelchair racing is divided in two phases, the propulsion and the recovery phase (figure 1). The propulsion phase is characterized by the tangential force applied to the handrim. In the beginning of the race, these one should be as high as possible and for the longest contact time so that the mechanical impulse is high (Ridgway, Pope & Wilkerson, 1988). Propulsion phase represents 33% to 35% of the full stroke cycle. 65% to 67% of the stroke time is the recovery phase in elite wheelchair racers (Bymes, 1983; Cooper, 1990b; Ridgway, Pope & Wilkerson, 1988; Sanderson & Sommer, 1985). In the recovery phase we have the time period that the hand does not contact the rims. The hand tends to follow different paths until being positioned in the rim again to a new propulsion phase (Cooper, 1990; Davis, Ferrara & Byrnes, 1988; Higs, 1985). However, the recovering phase may change,
Chapter 2. Technologic Appliance and Performance Concerns in Wheelchair Racing – Helping Paralympic Athletes to Excel.
the free chosen push frequency (the preferred stroke frequency adopted by each subject) ranged from 32 to 86 pushes/min at a 6.58 m/s in wheelchair racing.
The stroke cycle can also be divided in 5 phases: catch, drive, release, lift and stretch and finally acceleration. Catch is the hand contact moment on the handrim, it usually occurs nearly the 1 and 2 o’clock. Drive phase is the moment of the hand and wrist acceleration on the handrim and it usually occur nearly the 2 and 5 o’clock. Release phase is the moment of the contact breaking of the hand with the handrim, closer to the 6 o’clock. Lift and stretch phase is characterized by the elbow flexion and elevation in the sagittal plan. Acceleration moment is when the elbow extension is done before the handrim contact.
Figure 1. Stroke cycle in wheelchair racing.
During a race, the racers aim to reach the maximal speed as soon as possible and keep it for the remaining time (Figure 2). Figure 2 also depicts the intra-cycle speed (i.e due to hand contact and recovery phase). So, from here this becomes clear that at a given moment propulsive forces are higher than resistance ones (i.e. positive acceleration) and other than the later ones have a higher intensity (i.e. negative acceleration).
Chapter 2. Technologic Appliance and Performance Concerns in Wheelchair Racing – Helping Paralympic Athletes to Excel.
Figure 2. Theoretical representation of the speed over time in 20 stroke cycles.
Stroke kinematics are selected on regular basis to report the stroke cycle. These include the assessment of the average speed, stroke frequency and stroke length.
The stroke frequency can be evaluated by measuring the number of cycles per minute and stroke speed is given by the product of stroke length by the stroke frequency. Stroke length is the difference between the contact distance of a stroke and the contact covered distance of the next stroke. Thus, stroke length can be explained as the covered distance with handrim contact in one stroke (Chow & Chae, 2007). The average speed is calculated dividing the stroke length by the stroke frequency (Chow & Chae, 2007).
A higher stroke frequency combined with the hand linear velocity will lead to a greater energy cost, and probably will enhance cardiorespiratory stress affecting blood lactate and heart rate (Costa et al., 2009). The increase of speed it is related with blood lactate concentration and the rise of heartrate. Despite this, the increase of the handrim diameter seems to reduce the blood lactate concentration at 20km/h, however it didn’t happen at 22km/h (Costa et al., 2009).
An increased time of hand contact on the handrim without wrist acceleration will generate deceleration by friction resistance applied by the hand on the handrim. Therefore, to achieve a lower contact it is recommended to produce a high speed soon after the start (O’Connor, Robertson & Cooper, 1998), which is possible to improve as demonstrated by sprinters in strength development (Keogh, 2011). The elbow motion seems to range from 60.9º to 5.2º in flexion to extension movement and the maximum flexion velocity ranges between 515.4º/s and 572.8º/s, which is independent of the light weight of the wheelchair. However, the propulsion arc reduces by 12º to 14º in the pumping-stroke technique, that results from the
Chapter 2. Technologic Appliance and Performance Concerns in Wheelchair Racing – Helping Paralympic Athletes to Excel.
shortest handrim contact possible, usually at the start of the race (Rudins et al., 1997). In the 1986 National Wheelchair Track and field Championship in Illinois, in elite finalists, both in paraplegic and quadriplegic wheelchair racers, the mean velocity-time ranged in each stroke from 5.1m/s to 5.5m/s and 3.7m/s to 4.27m/s respectively. The mean velocity in each stroke ranged 0.4m/s and 0.6m/s between the propulsion and recovery phase for the same subjects respectively. As the stroke frequency increases, velocity peak also enhances, despite the negative correlation between the velocity peak and the hand contact time with the handrim. The contact phase of the hand in handrim ranged from 13.58º to 15.6º for quadriplegics and paraplegics. The start acceleration phase at the rims starts at 48.54º and 71.1º. The break contact happens at 187.5º and 238.9º. The peak velocity for each stroke, occur at 181.1º and 223.5º for quadriplegics and paraplegics respectively. These results were founded in a 10 second sprint with 20 to 25 propulsive cycles (strokes) for each subject (Gehlsen, Davis & Bahamonde, 1990).
The velocity peak seems to occur near to the 10 seconds of sprint in wheelchair track racers (Ridgway, Pope & Wilkerson, 1988). Wheelchair basketball players, achieve 80% of the peak velocity in the first three strokes. Otherwise, wheelchair racers at the third stroke only achieve 55% of the peak velocity. The stroke frequency in short distances is greater than in long distances. In 10 seconds, sprints were obtained with 2 strokes per second (Couts, 1990). However, in an 800m race, the stroke frequency ranged between 1.77 and 1.72 Hz (Ridgway, Pope & Wilkerson, 1988).
2.2. Main Determinants in Wheelchair Racing
The wheelchair racing athlete intends to reach the maximum acceleration as soon as possible. According to Newton’s second law the acceleration (a) in given as the ratio between force (f) and mass (m) (Equation 1).
(1)
In the wheelchair racing case, it is also possible to say that,
(2)
Chapter 2. Technologic Appliance and Performance Concerns in Wheelchair Racing – Helping Paralympic Athletes to Excel.
handrim, generating motion (i.e. the applied force by the ground in the wheel). The resistive forces are the rolling friction (Fr) and aerodynamic drag (Fd).
Figure 3. Free body diagram in wheelchair racing [21]; FI – Inertial force; FD – Drag force; FR – Rolling friction forces; FA – The applied force by the ground on the rear wheels.
Fuss (2009) reported an analytical model to describe the performance based on these major determinants. The inertial force is the required force to change the body state and start the motion. The drag force is the air resistance to the wheelchair-athlete system. Rolling friction is the resistive force of the ground on the wheels’ tires. Considering Newton’s third law, the applied force by the ground on the rear wheel is the opposite one of the wheel in the ground derived by propulsion.
According to Fuss (2009), the total energy expended by the athlete is taken by rolling friction and air drag. It is possible to say, that the velocity is dependent on the kinetic energy of the system, and mass.
(3)
In the equation, v is the velocity, Ein is the energy produced by the athlete and Eloss is the
energy lost.
(4)
The total kinetic energy is obtained from the sum of all mobile parts with a speed higher than zero. It is also considered that other movement oscillations do not contribute to the kinetic energy. Then:
Chapter 2. Technologic Appliance and Performance Concerns in Wheelchair Racing – Helping Paralympic Athletes to Excel.
In equation 5, Ii is the moment of inertia and ωi is the angular velocity of wheel i.
When the inertia force (FI) gets combined with distance, the kinetic energy (Ekin) can be formulated as:
(6) Equations 7 and 8 consider that velocity comes from the work of the rear wheel (ωri) and acceleration is the angular velocity of the rear wheel (a = αri), then solving it for FI, we obtain:
(7)
In this formula, m is the mass of wheelchair-athlete system and I is obtained from the relation between the one wheel mass and the wheel radius gyration squared. The mass of one wheel times its radius of gyration squared. When accelerated, an equivalent mass results in FI:
(8)
The propulsion cycle is given by the stroke and recovery phases, the equilibrium forces in the stroke one are given by:
, (9)
(10)
CD is the drag coefficient, v is the instantaneous velocity (considering distance and time at a given moment) and the acceleration (d2x/ dt2). The CD cluster is obtained from, 0.5ρcDA,
being the product of air density (ρ) with the drag coefficient of the air (CD) and the frontal
surface area (A). Considering that wheelchairs are in straight line and according to Equation 14, 12 and 13, FR is given by:
(11)
Where µR is the rolling friction coefficient, m is the mass, g the gravitational acceleration and
kf the coefficient of speed.
Chapter 2. Technologic Appliance and Performance Concerns in Wheelchair Racing – Helping Paralympic Athletes to Excel.
(13)
And C2,
(14)
Thereby, in a wheelchair-athlete system the responsible variables for the energy losses are FD and FR and both forces are equal to zero in a loss-free environment.
2.2.1. Propulsion
In the propulsion phase, Fuss (2009) described 4 forces as the main ones. The ground applied one at the rear wheel, aerodynamic drag force and the rolling friction one. When the mass gets accelerated produces an inertial force (FI). The kinetic energy derived from FI, is stored on the wheels, it depends of the moment of inertia and the angular speed of the wheels creating the system motion. The 4 forces in equilibrium are described as,
(15)
FA Is the force applied to the ground on the wheels derived from the tangential force applied
on the handrim (FI). For movement occurring, FA must be higher than FI, FD and FR.
Several investigations have been made to better understand the physiological factors and demands that may affect the wheelchair propulsion. Others for instance, (Sanderson & Sommer, 1985) presented the motion of the racing wheelchair derived by the sum of all external forces by:
F(R/rpr) = My + Iv/R + If v/r + Fa + MB/rax + Mb/raxf + FR + Fr + Wsin0(x) (16)
Where, “R/rpr” represents the gear ratio of the handring to the wheel. F - The tangential
force in the handrings; R and rpr - The radius of the rear wheels and handrings; M - The mass
of the system athlete-wheelchair; v - The velocity of the athlete-wheelchair system, given by: v = x = dx/dt; I and If- The inertia of the rear wheels and the wheels inertia; r - The radius of
the front wheels; Fa - The air resistance of the athlete-wheelchair system; MB - The rear hubs
bearing resistance; Mb - The front hubs bearing resistance; rax and raxf - The radius of the rear
and front axles respectively; FR and Fr- The rolling resistance of the rear and front wheels
respectively; W - The weight of the athlete-wheelchair system; Θ (x) - The inclination angle (i .e., changes in elevation); x - The covered distance;
Chapter 2. Technologic Appliance and Performance Concerns in Wheelchair Racing – Helping Paralympic Athletes to Excel.
2.2.2. Inertia
The sum of the kinetic energy to all mobile parts is given by equation 5. that includes the energy of the 3 wheels and the translational energy. The kinetic energy is equal to the inertial force combined with distance (equation 6). Thus, the inertial force (FI) is given by:
(17)
M represents the sum of the inertial moments.
The Inertial Force is the required force for a body state change. At the beginning of the wheelchair race, the inertial force is the required force for starting the wheelchair. Therefore, it is clear that the mass influences the inertial moment in the system and that the mass reduction will lead to a sooner and/or higher speed. Fuss (2009) reported that a reduction of 1kg in a wheelchair-athlete system will improve the winning time by 0.132sg.
2.2.3. Air Drag and Rolling Resistance
In wheelchair racing, the air drag results from the air resistance in the surface area of the athlete-wheelchair system. In contrast, the rolling resistance results from the friction of the tyres on the ground. Aerodynamic resistance can be minimized by reducing the frontal area of the subject, intending to improve the winning time of a racing wheelchair. At speeds greater than 5m/s aerodynamic drag represents 90% of the resistive forces (LaMere & Labanowich, 1984). Between 5.32m/s and 6.83m/s, rolling resistance is greater than aerodynamic drag with a partial contribution of 65% to 75% and 25% to 35% respectively. At greater speeds, aerodynamic drag starts to represent a greater contribution of the resistive forces (Barbosa, Forte, Morais & Coelho, 2014).
Air drag and rolling resistance can be acceded from equation 18 for rolling resistance and equation 19 for air drag:
(18)
(19)
In these two equations, FR is the rolling friction, µg is the rolling friction coefficient, m is the
mass of the athlete-wheelchair system, g is the gravity acceleration and kf is the coefficient
of the speed influence in rolling resistance force, ρ is the air density, Ad is the frontal area, v2
Chapter 2. Technologic Appliance and Performance Concerns in Wheelchair Racing – Helping Paralympic Athletes to Excel.
Lightweight clothes worn by wheelchair racers to reduce the aerodynamic drag (Barbosa, Forte, Morais & Coelho, 2014). A flexed upper trunk position also reduces the aerodynamic drag, as does reducing the rear wheel spokes to 24 (LaMere & Labanowich, 1984). In cycling, a flexed upper trunk position reduces the frontal area in 20% to 29% (Burke, 1986). In wheelchair racing, the same position reduces the frontal area in 3% to 4% (Hedrick, Wang, Moeinzadeh & Adrian, 1990).
Mass would also influence the rolling friction; reducing the wheelchair-athlete system would also improve the speed, mainly in short distances. A 1kg reduction would improve 1-2.3% of the winning time in wheelchair racing (Fuss, 2009).
2.3. Analytical Models, Experimental Testing and Numerical
Simulations in Wheelchair Racing
2.3.1. Experimental testing: Coast-down Technic
Aerodynamic and rolling resistance can be tested providing realistic opportunities that cannot be achieved in laboratory. The coast down-methods founded in literature are: (i) - roll distance applying the ramp methods; (ii) – the timing gate method, that measures the velocity decrease in different points between two marks (gates); (iii) – The velocity method that measures directly the speed in each time.
The roll distance applying the ramp method consists rolling, a wheelchair from a ramp to the field, measuring the covered distance by the wheelchair (FIFA, 2001). The timing gate method was developed as an alternative to the roll distance, produced in less time and space compared with the whole roll until the wheelchair stops. Two marks should be performed counting the time when the wheelchair passes between them (Kolitzus, 2003). In the velocity method, the racer reaches the maximum speed, stops the propulsion and the velocity is recorded in each instant (Kolitzus, 2003; Fuss, 2009). A dynamometer-based coast-down test was used for the wheel deceleration calculus (Kwarciak, Yarossi, Ramanujam, Dyson-Hudson & Sisto, 2009). For wheel deceleration in each trial, hub (Hubxyz) and handrim (Rimxyz)
markers were placed. The wheel rotation on each time was assessed by the law of cosines:
(20)
Chapter 2. Technologic Appliance and Performance Concerns in Wheelchair Racing – Helping Paralympic Athletes to Excel.
To avoid wheel size differences, the angular speed was converted in linear one. It was fitted a line to the linear velocity (v) data intending to determine the wheel deceleration (ad), the time to coast down from 2 m/s to 1 m/s is represented by “t” and the initial wheel velocity is represented by “v0”.
(21) The estimation for rolling resistance can be done based on Cooper’s method (Sanderson & Sommer, 1985). Intending to simplify the method, aerodynamic drag, wheel and roller bearing resistances, as other external resistances were neglected. Thus, the rear wheel motion was described by:
(22)
Where, “Tw” was the torque applied by the hand to the rear wheel; “Ir” and “Iw” were the moment of inertia of the roller and the rear wheel, respectively; “r” and “R”, the roller and rear wheel radius, respectively; “aw” and “FRR” as the angular acceleration of the rear wheel and the rolling resistance force respectively.
Considering that the propulsive force was discontinued, “Tw” is equal to zero, and “aw” represents the wheel angular deceleration. The equation is being used to describe the rear wheel rotation. The roller inertial moments (0.87 ± 0.15 kg-m2) and wheels (0.12 ± 0.02
kg-m2) were experimentally acceded resourcing the acceleration method by DiGiovine et al.
(2009). Applying the “Ir” and “r” values into Equation 22, and rewriting “aw” as the ratio between linear deceleration and radius (ad/R), rolling resistance force is obtained from the wheel radius, inertia, and deceleration, calculated by:
(23)
Coast-down distance (CDD) calculation was computed using the equation of motion, where acceleration is assumed to be constant and t is the time for coast-down technic ends, when the wheelchair stops:
(24)
Another method consists in accelerating the wheelchair (e.g., from 2.5 to 12.8m/s). The rider stops the propulsive phases reaching the target speed counting the length and/or time until the wheelchair stops (Candau et al., 2001). In this method both aerodynamic drag and rolling
Chapter 2. Technologic Appliance and Performance Concerns in Wheelchair Racing – Helping Paralympic Athletes to Excel.
Figure 4. The velocity decay of a manual wheelchair over a typical trial.
2.3.2. Wind tunnel testing
At least one paper can be found in the literature reporting the assessment of the aerodynamics in wind tunnel between two wheelchair models (MacLeish, Cooper, Harralson & Ster, 1993). The drag forces were measured for speeds between 54.86km/h and 164.60km/h with intervals of 18.28km/h. However, air viscosity and ground motion effect are not taken into account with this methodology. Besides this, a better wind tunnel test should be performed intending to determine the best helmet and clothes to use in races (MacLeish, Cooper, Harralson & Ster, 1993). The Drag was proportional with the speed in the two models A and B. Model A presented a strict nose, with fenders at the wheels and an exceeded front angle attack. The drag force was acceded in grams (gr) and ranged from 26(gr) to 360(gr) in booth models, with and without pilot. With and without pilot, the model B presented a lower drag force for velocities lower than 91.44km/h. At higher speeds the model A presented lower drag force with and without pilot.
From this experimental test it is possible to confirm that specific wheelchairs should be made for specific racers, and a sprint race wheelchair should be different to a long race wheelchair.
2.3.3. Analytical method for drag assessment
For rolling friction and aerodynamic drag, Burton, Fuss & Subic (Burton, Fuss & Subic, 2010) presented an analytical procedure to estimate rolling friction and aerodynamic drag. FR is
Chapter 2. Technologic Appliance and Performance Concerns in Wheelchair Racing – Helping Paralympic Athletes to Excel.
tyres, reduces in the ground higher speed in parabolic function. The equations for these two forces are expressed before in equations 18 and 19.
According to Fuss (2009), based in vehicles data (Petrushov, 1998), considering that the µg of
a racing wheelchair is 0.01, Kf is 5x10⁻⁶ s2m-2, a mean speed of 10 m/s and a mass
athlete-wheelchair system of 80kg the first and second term of the equation 22 is 7.85 and 0.35N. In a partial contribution assessment of air drag, Barbosa et al., (2014) assumed the air density of 1.2041 kg/m3 in the sea level at 20º C. The surface area was measured with the photogrammetric technique in the frontal plane and the drag coefficient was assumed to be 0.7. All estimations were completed in each speed moment between 0 m/s and 13m/s increasing in every 0.1m/s. considering the world speed record, the air drag represents 34.89%.
Figure 5. Partial Contribution of aerodynamic drag and rolling friction by Barbosa et al. [23].
2.3.4. Numerical simulations: Computer Fluid Dynamics
Computational Fluid Dynamics (CFD) has been used over the last 20 years. There are a lot of benefits on CFD and tools such as FLUENT, CFX, STAR-CD and FiDAP are all commercially available and used in industrial settings in the engineering community since the 1990s. Engineers and scientists started to use these simulations in competitive sports to reach a performance advantage, to improve sports equipment design and elite athletes’ aerodynamics
Chapter 2. Technologic Appliance and Performance Concerns in Wheelchair Racing – Helping Paralympic Athletes to Excel.
In sport sciences, the CFD presented concordance between numerical simulations and in vivo tests. For the simulation, a 3D body model scan is required and the images processing can be made with recourse to Anatomics Pro (Anatomics, Kannapolis, NC, USA) and FreeForm (Sensable Technologies, Woburn, MA, USA). The scan files are saved as IGES (*.igs) format, intending to be executable in Gambit/Fluent (Fluent Inc, Hanover, NH, USA). In Gambit/Fluent it is possible generate the greed and to define the finite elements in 3D areas. The numerical simulation consists in discretization of Navier-Stokes equations by the finites volumes methods. These equations come from Newton’s second law in fluid mechanics, assuming that the fluid stress is the sum of diffusion of its viscosity, resulting from an applied pressure term. The equation resolution determines the fluid speed in a determined point at space and time. CFD is based in an approximated finite volume. In this approximation space is divided in small cells to form a mesh or greed, applying a solver algorithm for the equations of fluid volume motion resolution (Marinho, Barbosa, Mantha, Rouboa & Silva, 2012; Marinho et al., 2011).
The Reynolds-Averaged Navier-Stokes (RANS) comes from decomposing the instantaneous values into means and/or fluctuating components. Fluid flow behaviour (equation 25), Reynolds Stresses (equation 26), temperature (equation 27) and mass transfer (equation 28) can be solved in this methodology.
(25)
(26)
(27)
(28)
The µi and xi are the instantaneous velocity and the position, p the instantaneous pressure, t
is the time, ρ the fluid density, ʋ is the molecular kinematic viscosity, cp heat capacity, k the
thermal conductivity and Sij the strain-rate tensor, c is the instantaneous concentration and D
the molecular diffusion coefficient.
The Reynolds stresses component ( ), describes the turbulence of the mean flow being the exchange of momentum by the change of the fluid parcels. In a laminar flow, the molecules are the responsible for momentum exchange (molecular viscosity). However, in a
Chapter 2. Technologic Appliance and Performance Concerns in Wheelchair Racing – Helping Paralympic Athletes to Excel.
momentum. To finish this calculus, it is also necessary to use a turbulence model to represent flow scales. The first order Boussinessq eddy-viscosity hypothesis to model the Reynolds stress in function of velocity and time is used. However, it is also a necessary model for the linear or non-linear eddy-viscosity distinction. The Reynolds stress is given by:
(29)
Where, vt is the turbulent viscosity and the mean strain rate Sij is given by,
(30)
The turbulent kinetic energy (k) is given by,
(31)
And the kronecker delta (δij),
(32)
Assuming the gradient diffusion (Gradient-diffusion Assumption) for heat and mass fluxes, as function of the temperature gradients in the mean flow, the turbulence hot flow is given by,
(33)
Where Dθt is the turbulent heat diffusivity (turbulent Prandtl number), and is the
temperature gradient in the mean flow. The turbulent Prandtl number is obtained by,
(34)
And the turbulent mass flow is given by,
(35)
Where, Dc,t is the turbulent mass diffusivity (turbulent Schmidt number) and the
Chapter 2. Technologic Appliance and Performance Concerns in Wheelchair Racing – Helping Paralympic Athletes to Excel.
(36)
Once RANS needed a turbulence model, less expensive equations are created with additional variables, transforming in meanings of the instantaneous equations calculations. This results from removing several small equations and adding other unknown variables, determined by the turbulence models. Standard K – ε turbulence model was used by Caboz (2010) in a computational simulation on a counter-clock cyclist helmet, however it is only valid in a completely turbulent fluid. The same mode is assumed for wheelchair racing. In Fluent the turbulence models available are: (i) Standard K – psilon; (ii) Standard K – ε; (iii) Spalart – Allmoras; (iv) Reynolds Stress (RSM) (White, 1999).
In this model (Standard K – ε) the Bussinesq hypothesis is given by,
(37)
Where the turbulent viscosity,
(38)
The mean tension rate is given by the equation 30. The kinetic energy of turbulent fluctuation and the dissipation of the kinetic energy (m2/s2) are given by equations 31 and 40
respectively.
(39)
k, is the energy measuring associated with the turbulent fluctuations in the flow.
(40)
ε, is caused by the work of the smallest eddies against the viscous stresses in the flow.
Then the determination of k (equation 41) and ε (equation 42) by their transport equations are,
(41)
Chapter 2. Technologic Appliance and Performance Concerns in Wheelchair Racing – Helping Paralympic Athletes to Excel.
Where, and are the variation of the local in time, and the
adjective term, and are the diffusion, Gk is the
generation of k by the gradients mean velocity, Gb the generation of k due the fluctuation
and ρε the dissipation of k. σk and σε are the turbulent Prandtl numbers for k and ε respectively. And the constants C1ε, C2ε, Cµ, σk e σε were experimentally determined, C1ε =
1.44; C2ε = 1.92; Cµ = 0.09; σk =1.0; σε = 1.3.
The Gambit software allows the building of a representative graphic model of the volume subdivided in sub volumes, trying to make the process as realistic as possible. This software also allows defining the frontiers. In solid frontiers and close to them, the FLUENT software computes the Reynolds tension and ε. It applies solid specific frontiers conditions for Reynolds tension using balance hypotheses, without considering the convection and diffusion of tension transport (equation 25). In a local coordinate system, T is tangential coordinate, η the normal and λ the binomial one. The Reynolds tension in the adjacent cells to the frontier, are calculated by the equation:
(42)
FLUENT solves the transport equation (41) for k obtaining. For calculous convenience the equation is globally solved, albeit the calculus of the k values is only necessary near the frontier. In the rest of the domain the k is calculated by the equation (26).
The mesh can be constructed by quadrangular elements, with a space size of 0.1mm. The resulting data from the computational simulation of the determined flow regime and the visualisation of the pressure profiles and speed are obtained by FLUENT. The data’s processing allows calculating the drag coefficient in the diverse forms (Carvalho, 2008).
2.3.5. Numerical Simulations on Wheelchair Racing
CFD methodology starts being used for equipment tests. In wheeler riders’ helmets, CFD has shown that airflow velocities could be improved with grooves in polymer foam liner and also improving the sweat evaporation. A top helmet hole would improve the velocity in that point, however velocities at the back became lower (Pinnoji & Mahajan, 2006).
The ideal posture and some changes in the wheelchair could be possible to define the three first places. The tests revealed that the most drag negative influence in performance came from the athlete and not from the wheelchair. With a subtle modification in the seating
Chapter 2. Technologic Appliance and Performance Concerns in Wheelchair Racing – Helping Paralympic Athletes to Excel.
CFD methodology must be applied in different fabrics, helmets and wheelchairs. The frame design, as the tube sizes must influence the fluid flow behaviour. Also different positions should be considered to be analysed the flexed head in the start of the race or the look forward position. In each stroke phase, the different fluid flows should also be analysed intending to reach the ideal motion in the stroke phase and recovery one, as the effect of the wheelchair designs and materials in the fluid flow (Barbosa, Forte, Morais & Coelho, 2014). Thus, fluid dynamics analysis should be performed intending to evaluate possible different designs of the wheelchairs and fulfil the lack of literature in this area. There is a need of results presentation such as drag and drag coefficient in different positions, helmets and cloths at different speeds.
Figure 6. CFD methodology of a scanned model in TotalSim (http://www.totalsimulation.co.uk/wp/cfd-image-gallery/)
2.4. Summary and Conclusions
The sports science of wheelchair racing lacks research. However, there is some information that could positively contribute to increase performance in athletes. Managing the mathematical models based on physics laws, coaches could identify the mechanic performance obstacles and try to minimize them.
The drag reduction by the rolling and air resistance assess also contributed to increase the performance in athletes. Better propulsion could be obtained by reducing the total drag combined with a mass reduction and other possible aerodynamic positions. The purpose of computational simulations and/or computer fluid dynamics is the time improvement achieved by reducing the aerodynamic drag. No data was found about CFD tests in wheelchair racing. The stroke technique should also be focused. Despite that there are no indications about how many hours that should be taken off training after an injury occurrence. It is defined that the high angular velocities near the shoulder and the elbow generated by the strokes, induce an
Chapter 2. Technologic Appliance and Performance Concerns in Wheelchair Racing – Helping Paralympic Athletes to Excel.
overuse stress increasing the risk for joint injuries. There are also some indications about the contact zones, force applying and contact break at the rear wheels.
Physiological variables should also be studied in wheelchair racing athletes, an area that also has a lack of information in this sport. Thus, a precise control of the total drag and the efficiency of the stroke technique, which is related to high levels of strength derived by the strength and physical condition training, will positively contribute for a better performance.
Chapter 3. Comparison by computer
fluid dynamics of the drag force acting
upon two helmets for wheelchair racers.
Abstract
The aim of this study was to compare the drag force created by two helmets (time trial and track) used by a wheelchair racer. The head and helmet of the racer were scanned to obtain the 3D models. Numerical simulation was run on Fluent, having as output the drag force for both helmets (track and time trial) in two different positions (0º and 90º) and increasing velocities (from 2.0 to 6.5 m/s). The greatest aerodynamic drag was noted wearing a time trial helmet in 90º ranging from 0.1025N to 0.8475N; this was also the position with the highest drag. The velocity with higher drag for booth helmets was at 6.5 m/s. The time trial helmet at 0º had the lower aerodynamic drag, compared with the same position of track helmet. The drag force seems to be lower wearing the time trial helmet and keeping the 0º position and, thus, should be considered for sprinting events.
Chapter 3. Comparison by computer fluid dynamics of the drag force acting upon two helmets for wheelchair racers.
3.1. Introduction
Computer Fluid Dynamics (CFD) is an area under Computer-Aided Engineering and provide insights on 2D and 3D digital geometries. This methodology has been applied to assess competitive sports such as cycling, swimming, golf or ski jumping. It also allows to assess variables such as drag force, drag coefficient and pressure, of gears, equipment and apparel in these sports (Martin, 2009).
Aerodynamics plays an imports role in sprinting events. It represents more than 90% of the resistive forces at speeds higher than 5m/s (LaMere and Labanowich, 1984). This analysis was done as well at greater speeds, such as 15m/s, 20m/s or even higher (Alam et al., 2014). In sports like cycling, the rider’s posture could be evaluated. Small variations in the rider’s position could account for 10% variation in the drag force (Rushby-Smith and Douglas, 2012). Being based on the same rational, the helmet used and the position of a wheelchair racer may have a meaningful effect on the resistance, notably in racing sprinting events.
CFD presents concordance between the numerical simulations and experimental testing. A 3D model obtained with specific 3D scan is needed for the computer simulations. Software’s such as Artec Studio 0.7 (Artec, USA), Geomagic (3D Systems, USA) and Maya (Autodesk Inc., USA) allows model digitalization, and scans merge and editing. Upon merging the scans and editing, it is possible to generate a 3D mesh, and areas and elements definition (Forte et al., 2015).
This methodology consists in the discretization of Navier-Stokes equations by the finite volumes methods. This set of equations encompass the Newton’s second law of motion. The fluid stress, resulted from an applied pressure term and it comes from the sum of diffusion of its viscosity. Reynolds-Avereged Navier-Stokes equations decompose instantaneous values into means and/or fluctuation compounds (Marinho et al., 2011; Marinho et al., 2012). The fluid flow behaviour (equation 1), Reynolds stress (equation 2), temperature (equation 3) and mass transfer (equation 4) could be solved with resource to this methodology.
(1)
(2)
(3)
Chapter 3. Comparison by computer fluid dynamics of the drag force acting upon two helmets for wheelchair racers.
Therefore, this technique can be used to learn the effects of different helmets and positions by the wheelchair racer, as the racer can wear either a track helmet or a time trial helmet. It is unclear which model will impose a lower aerodynamic drag. Thus, the aim of this study is to compare two different helmets (track vs time trial) at different speeds and head positions by CFD.
3.2. Methods
A Paralympic wheelchair racer (category T-52) was recruited for this research. He is a European medallist in sprinting events and a world championships finalist. The subject wore two different models of helmets. One is a track helmet (LAS, Istron) and the other a time trial model (LAS, Cronometro).
The geometries were obtained by a 3D scan Artec (Artec-L, Artec Group, Inc., USA). The scans were performed by Artec Studio 0.7 (Artec, USA) (Figure 1).
Fluent (Fluent, Inc., USA, New York) code, allows to compute numerical simulations applying a mathematical model to the fluid flow, at a created domain with discretized algebraic expressions of the Navier-Stokes equations. Fluent software solves the equations with a finite volume approach (Marinho et al., 2011). The domain is represented by a 3D mesh of subdivided cells representing the fluid flow around the head and helmets in the different positions.
Realizable k-epsilon was the applied turbulence model, this one, is much more efficient in computation economy and converged after 1404 interactions (Aroussi et al., 2001).
The 3D mesh was made with more than 6 million cells for booth helmets domains. The angles of attack were set as 0º (i.e., looking forward, with the opposite direction of the fluid flow) and 90º (looking downwards, perpendicular to the fluid flow direction).
The fluid flow velocity was set in inlet portion of the dome surface at 2m/s, with increments of 1.5 m/s up to 6.5 m/s. Typically the wheelchair racer will reach these range of speed over an event. The aerodynamic drag was computed as:
(5) Where FD is the drag force, CD represents the drag coefficient, v the velocity, Ad surface
Chapter 3. Comparison by computer fluid dynamics of the drag force acting upon two helmets for wheelchair racers.
3.3. Results
The contours of static pressure obtained in fluent, represents the pressure zones (Pa) in the helmets at 6.5m/s. Zones with red colour indicate high pressure and low pressure with blue colour (figure 1). It is possible to observe that the helmet at 90º increases the surface area and consequently the pressure zones.
(a) (b)
Figure 1. Static pressure zones of the time-trial helmet at 0º (a) and 90º (b) position, at 6.5 m/s. It is also possible to recreate the fluid flow velocity simulation around the object at 6.5 m/s. With this simulation it is possible to observe the velocity vectors coloured with the static pressure around the surface area of the geometry (figure 2).
(a) (b)
Figure 2. Flow velocity vectors at 6.5 m/s colored by static pressure on the surface area in time-trial helmet at 0º (a) and 90º position (b) respectively.
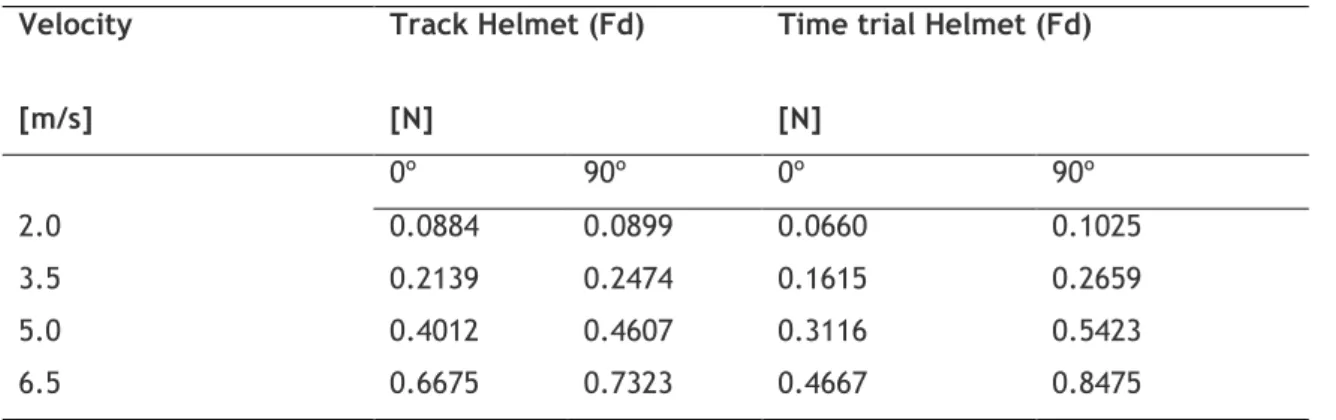
Aerodynamic drag is prone to increase for booth helmets with increasing velocities. The drag force ranged between 0.0660 N and 0.8475 N (table 1).
In both helmets, a higher drag was noted at 90º angle of attack, when compared to a 0º angle.
The time trial helmet presented higher aerodynamic drag compared to the track model at 90º. These are kept for all velocities selected though. However, at 0º time trial helmet presented lower drag compared with the track one.
Chapter 3. Comparison by computer fluid dynamics of the drag force acting upon two helmets for wheelchair racers.
Table 1. Drag force at different velocities and attack angles.
Velocity [m/s]
Track Helmet (Fd) [N]
Time trial Helmet (Fd) [N] 0º 90º 0º 90º 2.0 0.0884 0.0899 0.0660 0.1025 3.5 0.2139 0.2474 0.1615 0.2659 5.0 0.4012 0.4607 0.3116 0.5423 6.5 0.6675 0.7323 0.4667 0.8475
3.4. Discussion
The obtained aerodynamic drag ranged from 0.0660 and 0.8475 N. Some authors presented similar results, near 1 N. However, reports in the literature assessed the performed at velocities higher than 6.5 m/s and the rider shoulders were also included in the simulations (Alem et al., 2014). A higher surface area (because the shoulders were scanned) will contribute for a higher aerodynamic drag.
Others reported 0.319N of drag force for a time trial helmet. This data is in accordance to our outputs. However, it should be noted that they run the simulation only for the helmet (i.e., without scanning the head) but at a higher velocity (13.4 m/s or faster) (Sidelko, 2007).
3.5. Conclusion
Wheelchair racing athletes might wear time trial helmets when they keep looking forward. In the event of looking downwards, the aerodynamic drag will increase meaningfully in comparison to track helmet. Thus, racers should be aware of this drawback wearing time trial models.
CFD methodology might be useful for better understanding the technical features intending to optimize athlete’s performance. Namely with, different helmets, speeds and angles of attack study. Futures researches could evaluate and create customized helmets for each athlete in agreement with his characteristics.
Chapter 3. Comparison by computer fluid dynamics of the drag force acting upon two helmets for wheelchair racers.
3.6. Practical Applications
The helmets use seems to be one of the strategies to reduce drag in wheelchair racing athletes. A time trial helmet, should be used by athletes for short or long distances. The athletes must look forward with a time trial helmet. A neck flexed position during the race will increase the surface area and drag. Thus, for a time trial helmet use, coaches should perform training sessions for the garments adaptation. This technic training should intend to help the athlete to maintain the head raised, with the neck in hyperextension with a helmet use.
![Figure 3. Free body diagram in wheelchair racing [21]; FI – Inertial force; FD – Drag force; FR – Rolling friction forces; FA – The applied force by the ground on the rear wheels](https://thumb-eu.123doks.com/thumbv2/123dok_br/19172960.941994/32.892.116.551.188.417/figure-diagram-wheelchair-racing-inertial-rolling-friction-applied.webp)