Vol.50, n. 5 : pp. 851-860 September 2007
ISSN 1516-8913 Printed in Brazil BRAZILIAN ARCHIVES OF
BIOLOGY AND TECHNOLOGY
A N I N T E R N A T I O N A L J O U R N A L
Elementary Chemical Analysis in Leaves Infected by
Fumagina by X-Ray Fluorescence Technique
Maria Sélia Blonski1*, Carlos Roberto Appoloni1, Paulo Sérgio Parreira1, Pedro Henrique Arruda Aragão1and Virgilio Franco Nascimento Filho2
1
Universidade Estadual de Londrina; Centro de Ciências Exatas; Departamento de Física; C.P.: 6001; Londrina -PR - Brasil. 2Universidade de São Paulo; Center of Nuclear Energy in Agriculture - Piracicaba - SP - Brasil.
ABSTRACT
Energy Dispersion X-Ray Fluorescence Technique (EDXRF) was employed to study the effects of the fumagina disease on the elementary chemical composition of the leaves. The experimental set up consisted of a Mo X-ray tube (K∝= 17.44 keV) with Zr filter and a Si (Li) detector. The measurements were performed with the infected and healthy leaves of citric plants. The elements Ti, Mn, Fe, Cu and Zn were quantified, with an average DL of 69, 12, 8, 4 and 4 µg.g-1 respectively. The obtained concentration for Fe varied from 44 to 192 µg.g-1 in healthy leaves and from 363 to 704 µg.g-1 in infected leaves with fumagina .
Key words: Fumagina, leaves, fluorescence of X-rays
*
Author for correspondence
INTRODUCTION
Several microorganisms including fungus and virus infect Citrus plants. "Fumagina” is an association of fungus, which presents a soot coloration and attack Citrus trees, producing a yellow cover and fall of the leaves, reducing the size and amount of the fruits” (Fanta et al.,1992). Fumagina is produced by the Capnodium fungi (Almeida et al.,2003), a fungus from Dothideales
order that lives associated with the yellow aphid (
Monelliopsis pecanis), excreting a heavy load of a
sugary substance that provides the sooty fungus development, covering, in some cases in totality, of leaves, fruits and branches surfaces (Aragão et al., 2001). The physical block of the photosynthesis is one of the largest problems caused by the disease. This reduction in the photosynthesis, however, affects the reserves of carbohydrates in the plant, resulting in the reduced
Blonski, M. S. et al.
Brazilian Archives of Biology and Technology 852
from external level to internal level, it is followed by the emission of an X-ray with very defined energy or wave length, characteristic of the element.(Lachance, 1994). The analysis by X-rays fluorescence consists of three phases: excitation of the elements that constitute the sample, dispersion and detection of the X-ray emitted. (Nascimento,1993). The samples used in this work were infected and healthy leaves of Citric plants orange and lemon trees (Rutaceae-Citrus spp). Through the EDXRF technique Aragão et al., (2001) have observed that in the healthy olive leaves, from Mediterranean area, the concentration of iron was smaller than the one of calcium, while in the plant leaves infected by fumagina this relation was inverted, observing a quite high amount of iron in relation to calcium. This was the only work in which the variation in the concentration of Fe was measured in the plants infected by fumagina. Ivanova et al., (1999), using the EDXRF technique with radionuclide sources, measured elements concentrations in four species of the healthy plant leaves. Guohui and Shouzhong (1995) reported the direct determination of 25 elements (11
≤
Z≤
82) in dry powdered plant materials by X-ray fluorescence spectrometry. It was using the pressed powder pellets of the plant samples, containing 1 g of the dry powdered material. The measured elements concentration was in the range from 0.2 to 30460 ppm, and the lower level detection (LLD) was in the range from 0.25 to 23.6 ppm. The aim of this work was to analyze the amount of the chemical elements in the healthy and fumagina infected leaves by EDXRF. Ajasa et al. (2004), using atomic absorption spectrophotometry, measured a total of 10 elements (11≤
Z≤
82) in powdered medicinal plant samples. The measured elements concentration was in the range from 0.21 to 36600 ppm.MATERIALS AND METHODS
Experimental Set-Up and Parameters
The excitation of the samples was accomplished with a Mo X-ray tube (K∝= 17.44 keV) with Zr
filter, whose operation conditions were 10 mA and 25 kV.It used a Canberra semiconductor Si(Li)
detector, model SL 80175, 80 mm2 of active area and resolution of 175 eV for the 6.4 keV Fe X-ray line.An Ag collimator of 6.3 mm diameter was used over the Si (Li) detector, in order to minimize the detection of dispersed radiation produced by the experimental arrangement and also to reduce the dead time. The time of excitation and detection for the samples was 300 seconds and varied from 100 to 500 seconds for the MicroMatter element standards. The measurements were accomplished at the Laboratory of Nuclear Instrumentation in the Center of Nuclear Energy in Agriculture, CENA/USP, Piracicaba, São Paulo. The data were analyzed at the Laboratory of Applied Nuclear Physics of the State University of Londrina, Paraná, using the software AXIL (Espen et al., 1977).
Preparation of the Samples
The samples of Bahia, Valência, native orange
leaves and Tahiti lemon leaves collected in the School Farm of the Agronomy Department of the State University of Londrina were prepared and measured in three stages:
1) In natura: without any preparation. Three
different leaves were collected and measured directly.
2) In tablets: the samples of leaves were washed and placed to dry in oven at 200º C during 48 hour. After drying, the samples were crushed and, using 1g of this material, tablets of 3.1 cm of diameter were made by pressing the material at 12 t.cm-2 for five seconds, resulting in a superficial density of 0.132 g.cm-2. Three tablets of each kind of leaf were prepared for measurement.
3) Tablets with boric acid: 0.1g of dry leaves material was diluted in 0.9 g of boric acid (H3BO3). Tablets were made using 1g of this
Table 1- Elemental concentrations of thin film standard .
Elements Concentrations
(µg cm-2)
Ca 30.90
Ti 43.30
Mn 44.69
Fe 49.40
Cu 42.30
Zn 16.16
Quantitative Analysis – Emission and Transmission Method
The concentration of the elements in the pellets was determined through the equation (Giauque et al.,1973) :
A
S
I
c
.
=
(1)Where:
c- element concentration in the tablets (µg.cm-2) S – elementary sensibility of the analyte (cps.µg
-1.cm2)
I – intensity of the analyte (cps)
A- absorption factor of the characteristic X-ray of the element of interest by the matrix (no dimensional)
The factor A is given by:
A =
D
e
D.
. .
ο ρ χ
ρ
χ
ο
.
−
−1
(2)Where:
χρ0D=ln
−
+
I
I
I
am am
irrad irrad
( 3 )
Iirrad – characteristic X-ray intensity of the element
of interest i from the irradiator Iirrad+am - characteristic X-ray intensity of the element of interest i transmitted by the sampleIam - characteristic X-ray intensity of the element of interest i originated from the sample.
The conversion of the element concentrations in the pellets to the analyzed citric species leaves was accomplished through the equation:
ý
a
C
c
p
ff
=
⋅
( 4)Where:
Cff - element concentration in the fresh leaf (µg g
-1)
cp - element concentration in the pastilles (µg cm-2)
a – pellets area (7.55 cm2) and:
m
y
x
ý
=
⋅
( 5)
ý
- ratio between the mass of fresh leaves andthe mass of dry leaves powder
x
- mass of fresh leavesy
- mass of dry leaves powderm- 0.1g, mass of dry leaves powder used to make the tablets
Detection Limit
The detection limit was calculated through the following equation (BERTIN,1975):
( )
t
i
A
S
DL
I
BG.
3
=
(6)where: DL -detection limit for the analyte (µg.cm
-2)
Ii(BG)– intensity of background under analyte peak
(cps)
A - absorption factor (no dimensional)
Blonski, M. S. et al.
Brazilian Archives of Biology and Technology 854
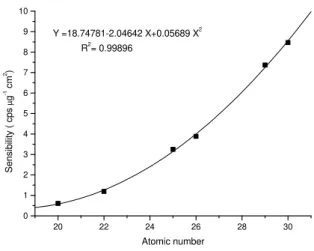
Figure 1 - Elementary sensibility in function of the atomic number for the Micro Matter standards
Figure 2 – Typical behavior of the absorption factor in function of the atomic number for a sample of Valência orange with fumagina
Fig. 1 displays the sensibility in function of the atomic number for the mentioned standard. Through the equation shown in the respective figure the sensibilities were calculated for the elements of interest. For all the biological samples, the absorption factors were determined with the aid of equation 2, using an irradiator containing the elements V, Mn, Cu, Se, Br and Rb (atomic numbers ranging from 23 to 38). Fig. 2 shows the relation between the absorption factor and the atomic number for a sample of Valência orange with fumagina. And for the sample of Valência
orange with fumagina (Fig. 2 ). All the samples presented correlation between the absorption factor and the atomic number.
Fig. 3 displays the relation between the detection limit and the atomic number for the samples with fumagina analyzed in this work. For the atomic number 22, the detection limit varied between 50 and 86 µg.g-1. For the atomic numbers from 25 to 30, the detection limits were lower, varying between 2.8 and 15 µg.g-1.
20 22 24 26 28 30
0 1 2 3 4 5 6 7 8 9 10
R2 = 0.99896
Y =18.74781-2.04642 X+0.05689 X2
S
e
n
s
ib
ili
ty
(
c
p
s
µ
g
-1 c
m
2)
Atomic number
22 24 26 28 30 32 34 36 38
0,1 0,2 0,3 0,4 0,5 0,6 0,7 0,8
Atomic number
Y= 0.04319x-0.84645
R2 = 0.99519
A
b
s
o
rp
ti
o
n
f
a
c
to
Figure 3 - Minimum limit of detection in function of the atomic number for the samples with fumagina
RESULTS AND DISCUSSION
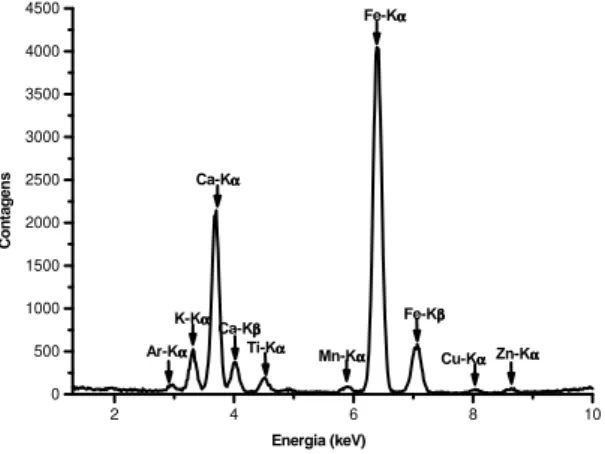
Figs. 4 and 5 presents typical spectra of Bahia
orange samples analyzed in natura, with and
without fumagina, respectively.
For the other samples analyzed, Valencia orange, Native orange and Tahiti lemon, the spectra were similar. The spectra presented at Figs. 4 and 5 show the concentration of iron in the healthy leaves, without fumagina, smaller than the
concentration of calcium, while in the infected leaves the behavior is opposite, the concentration of iron is much larger than the one of calcium.
This behavior was observed in all the analyzed species and innatura as in form of tablet. Tables 2 to 5 show the average values and standard deviations for the concentrations obtained from the measurements of three different samples from each leaf type as well as the average values of the detection limits for the samples analyzed.
Figure 4 - Typical spectrum of a in natura Bahia orange leave sample with fumagina (time of excitation and detection of 300 s)
22 24 26 28 30
0 50 100 150 200
B Bahia orange C Valência orange D Nativa orange E Tahiti lemon
M
in
im
u
m
l
im
it
o
f
d
e
te
c
ti
o
n
(
µµµµ
g
.g
-1 )
Atomic number
2 4 6 8 10
0 500 1000 1500 2000 2500 3000 3500 4000 4500
Zn-Kαααα Cu-Kαααα Fe-Kββββ Fe-Kαααα
Mn-Kαααα Ti-Kαααα Ca-Kββββ Ca-Kαααα
K-Kαααα Ar-Kαααα
C
o
n
ta
g
e
n
s
Blonski, M. S. et al.
Brazilian Archives of Biology and Technology 856
Figure 5 - Typical spectrum of a in natura Bahia orange leave sample without fumagina (time of excitation and detection of 300 s)
Table 2 - Average concentrations, standard deviations and limits of detection (µg g-1) of the elements Ca, Ti, Mn, Fe, Cu e Zn determined for Bahia orange leaves samples with and without fumagina. Three different samples for each kind of leaf average results.
Bahia orange with Fumagina
Bahia orange without Fumagina
Elements Average Concentration
(µg g-1)
Standard Deviation
(µg g-1)
Limit of detection
(µg g-1)
Average Concentration
(µg g-1)
Standard Deviation
(µg g-1)
Limit of detection
(µg g-1)
Ca 94788 36273 681 48862 2818 1019
Ti 111 38 50 < 78 78
Mn 32 14 8.7 30 3 13
Fe 704 250 5.7 132 3 8.6
Cu 5.8 1.9 3.1 < 4.7 4.7
Zn 9.8 2.7 2.8 6.4 0.6 4.3
Table 3 - Average concentrations, standard deviations and limits of detection (µg g-1) of the elements Ca, Ti, Mn, Fe, Cu e Zn determined for Valência orange leaves samples with and without fumagina. Three different samples for each kind of leaf average results.
Valência orange
with fumagina
Valência orange without fumagina
Elements Average Concentration
(µg g-1)
Standard Deviation
(µg g-1)
Limit of detection
(µg g-1)
Average Concentration
(µg g-1)
Standard Deviation
(µg g-1)
Limit of detection
(µg g-1)
Ca 125573 4295 1158 103796 6632 1132
Ti < 86 86 < 84 84
Mn 70 1 15 59 2 14
Fe 422 4 9.6 170 11 9.4
Cu 133 2 5.3 33 2 5.2
Zn 21.2 0.5 4.8 13.3 0.5 4.7
2 4 6 8 10
0 500 1000 1500 2000 2500 3000 3500 4000 4500
Zn-Kαααα Fe-Kαααα
Ca-Kββββ Ca-Kαααα K-Kαααα Ar-Kαααα
C
o
n
ta
g
e
n
s
Table 4 - Average concentrations, standard deviations and limits of detection (µg g-1) of the elements Ca, Ti, Mn, Fe, Cu e Zn determined for native orange leaves samples with and without fumagina. Three different samples for each kind of leaf average results.
Native orange with fumagina
Native orange without fumagina
Elements Average Concentration
(µg g-1)
Standard Deviation
(µg g-1)
Limit of detection
(µg g-1)
Average Concentration
(µg g-1)
Standard Deviation
(µg g-1)
Limit of detection
(µg g-1)
Ca 108628 17860 1087 83368 1614 698
Ti 86 32 81 62 7 51
Mn < 14 14 < 8.7 8.7
Fe 374 46 9.2 192 3 5.6
Cu < 5.0 5.0 < 3.1 3.1
Zn 7.3 0.7 4.6 4.7 0.3 2.8
Table 5 - Average concentrations, standard deviations and limits of detection (µg g-1) of the elements Ca, Ti, Mn, Fe, Cu e Zn determined for Tahiti lemon leaves samples with and without fumagina. Three different samples for each kind of leaf average results.
Tahiti lemon with Fumagina
Tahiti lemon without Fumagina
Elements Average Concentration
(µg g-1)
Standard Deviation
(µg g-1)
Limit of detection
(µg g-1)
Average Concentration
(µg g-1)
Standard Deviation
(µg g-1)
Limit of detection
(µg g-1)
Ca 91313 5164 852 30967 1714 703
Ti < 64 64 < 54 54
Mn 15 1 11 < 9.2 9.2
Fe 363 23 7.0 44 1 6.0
Cu < 3.9 3.9 < 3.3 3.3
Zn 6.9 0.2 3.5 5.9 0.5 3.0
Tables 2, 3, 4, and 5, showed that for all the species of analyzed leaves samples (Bahia orange,
Valência orange, Native orange and Tahiti lemon),
there was an increase in the concentrations of Ti, Mn, Cu and Zn in the infected samples with fumagina in relation to the healthy ones, without fumagina. In the infected sample with fumagina high increase was observed in the concentration of Fe in relation to the one without fumagina. It was also observed that these concentrations were much larger than the limit of detection. For K and Ca the technique was not viable for the quantitative determination, presenting limitations for the elements with atomic number smaller than 25. There were no reports on the quantitative or qualitative values of concentration variation of elements in infected plants with fumagina.
However, in a work with leaves of olive tree from Mediterranean area, Aragão et al.,(2001), observed through the EDXRF technique, observed a metabolic disorder of Fe and Ca. Analyzing the spectra of healthy olive tree leaves and comparing them with the ones infected by fumagina, they observed that in the healthy leaves, the concentration of Fe was smaller than Ca and in the infected leaves with fumagina it was opposite with a quite high amount of Fe in relation to Ca. The concentration of Fe measured in the infected leaves of olive trees with fumagina was 80ppm, quite inferior to the observed values in the infected leaves studied in this work. Ivanova, et al.(1999), using the EDXRF technique with radionuclide sources, analyzed the species of healthy plants
Blonski, M. S. et al.
Brazilian Archives of Biology and Technology 858
abies and Populus nigra “Italica”. Table 6 shows
the results of the concentrations obtained for K,
Ca, Mn, Fe, Cu and Zn. .
Table 6 - Concentrations (µg.g-1) measured by Ivanova, et al. in healthy plants leaves
Plants K Ca Mn Fe Cu Zn
Taraxacum officinale 32200 11400 24 188 8.7 31
Populus nigra“Italica” 2000 10000 44 100 0.90 7
Pleurozium schreber - - 110 153 4.1 23.7
Picea abies 3234 3991 7 16 1.5 21
Guohui and Shouzhong (1995), using X-ray fluorescence spectrometry, measured 25 elements in the dry powdered plant materials. The results of
the concentrations obtained for K, Ca, Ti, Mn, Fe, Cu and Zn can be observed in Table 7.
Table 7 - Results of elements concentrations (µg.g-1) measured by Guohui and Shouzhong in plant samples.
Plants K Ca Ti Mn Fe Cu Zn
Orchard leaves (USA) 15200 19564 28.1 94 298 12.4 24.6
Pepper leaves (Japan) 15815 14828 7.3 2050 212 342.5 342.5
Citrus leaves (USA) 17132 30460 - 22.3 78 25.2 25.2
Ajasa et al. (2004), using atomic absorption spectrophotometry measured a total of 10 elements in the powdered medicinal plant samples. The analyzed plant samples were Anacardium occidentale, Azadirachta indica, Butyrospermum paradoxum, Mangifera indica, Morinda lucida, Ocimum canum, Solanum erianthum, Solanum
torvum, Zingiber officinale and Hyptis suaveolens.
The results of the concentration obtained for elements K, Ca, Mn, Fe, Cu and Zn can be observed in Table 8.
Table 8 - Results of elements concentrations in plant samples (ppm) measured by Ajasa et al.
Plants K Ca Mn Fe Cu Zn
A.occidentale 6380±25 6103±15 89.9±0.03 35.6±0.02 2.96±0.01 3.31±0.02
A.indica 19220±55 3543±15 46.5±0.04 188±0.10 1.12±0.01 15.7±0.01
B.paradoxum 8170±16 21850±40 31.7±0.06 96.1±0.05 10.3±0.01 8.87±0.01
M.indica 7470±15 18810±11 133±0.06 46.6±0.01 3.07±0.01 3.24±0.01
M.lucida 13100±101 51340±21 685±0.02 122±0.02 16.5±0.01 33.6±0.01
O.canum 36600±350 32420±52 51.3±0.04 241±0.05 15.1±0.01 30.8±0.01
S.erianthum 28750±51 7280±30 34.1±0.02 178±0.05 21.7±0.01 24.2±0.01
S.torvum 31550±102 11390±20 48.7±0.06 208±0.03 13.9±0.02 23.4±0.01
Z.officinales 25280±113 2610±10 413±0.70 144±0.05 14.4±0.01 33.3±0.01
H.suaveolens 18260±233 19780±8 39.4±.0.30 142±0.10 24.4±0.01 35.1±0.01
Comparing the results of Table 6 with those of this work for healthy leaves (Tables 2 to 5), it could be observed that the range of concentration of Fe in both works had the same order of magnitude. Ivanova et al. (1999), didn't
this work, while for Cu, the range obtained in the present work was quite superior to that measured in the plants analyzed by Ivanova et.al. (1999). Comparing the results of Table 7 for the Citrus leaves samples with those of this work for healthy leaves (Tables 2 to 5), it could be observed that the range of Fe, Mn and Cu concentrations in both the works had the same order of magnitude. Guohui and Shouzhong (1995), didn't present any results for Ti. For Zn, the range of concentration measured by Guohui and Shouzhong (1995), was a little higher than that measured in this work. Comparing the results of Table 8 with those of this work for the healthy leaves (Tables 2 to 5), it could be observed that the concentrations of Fe and Zn were a little higher than those measured in this work. Ajasa et al. (2004), didn't present any results for Ti. The values obtained for the concentration of Mn were higher than that measured in this work. For Cu the range of concentration measured by Ajasa et al. (2004), was a little smaller than that measured in this work.
CONCLUSIONS
The obtained results employing the three different samples preparation methods resulted in similar conclusions for the various elements behavior comparing healthy and infected leaves. In healthy leaves samples, without fumagina, the obtained concentrations for the analyzed elements varied from 44 to 192 µg.g-1 for Fe, 54 to 84µg.g-1 for Ti, 8.7 to 59 µg.g-1 for Mn, 4.7 to 13.3 µg.g-1 to Zn e 3.1 to 33 µg.g-1 to Cu. The obtained concentrations in samples of infected leaves with fumagina varied from 363 to 704
µg.g-1 for the element Fe, 64 to 111 µg.g-1 for Ti, 14 to 70 µg.g-1 for Mn, 6.9 to 21.2 µg.g-1 for Zn and from 3.9 to 133 µg.g-1 for Cu. The concentration of Fe in the leaves infected by fumagina, in relation to the healthy ones increased by a factor 5.3, 2.5, 1.9 and 8.2, respectively for the leaves of Bahia, Valência
and native oranges, and Tahiti lemon.
Comparing the citric species among themselves, it can be observed that the Tahiti lemon leaves were more affected by fumagina than the three orange species leaves. In the EDXRF qualitative determination of K, Ca, Ti, Mn, Fe, Cu and Zn
in samples of citric plants leaves analyzed in
natura and in the form of tablet of the pure
material of leaves powder, it was possible to observe clearly the effects of fumagina in the several analyzed species, whose behavior was identical to the measured in the quantitative analyses.
ACKNOWLEDGEMENTS
The authors would like to thank CAPES, Brazil, for the financial support for this work.
RESUMO
Foi empregada a técnica de fluorescência de raios X por dispersão de energia (EDXRF), para estudar os efeitos da doença fumagina na composição química elementar de folhas. O arranjo experimental consistiu de um tubo de raios X com anodo de Mo (K∝= 17.44 keV) com
filtro de Zr e um detector de Si(Li). As medidas foram realizadas com folhas de plantas cítricas infectadas e sadias. Foram quantificados os elementos Ti, Mn, Fe, Cu e Zn, com um limite de detecção médio de 69, 12, 8, 4 e 4 µg.g-1 respectivamente. As concentrações obtidas para o Fe variaram de 44 a 192 µg.g-1 em amostras de
folhas sadias e de 363 a 704 µg g-1 para as folhas infectadas com fumagina.
REFERENCES
Ajasa.A. M. O, M. Bello.O, Ibrahim.A. O, Ogunwande I. A, Olawore.N. O (2004) Heavy trace metals and macronutrients status in herbal plants of Nigeria. Food Chemistry 85, p.67-71. Almeida, F. A., Araujo, E., Goncalves J., Hermeset
al. (2003) Diagnóstico e quantificação de doenças fúngicas da acerola no Estado da Paraíba. Fitopatol. bras., mar./abr. vol.28, no.2, p.176-179. ISSN 0100-4158.
Aragão.P.H.A, Cesareo. R., Fernandes E.A, Balogun.F, Prota. U, Fiori. M(2001) – Iron in olive tree leaves in the Mediterranean area. Journal of Radioanalytical and Nuclear Chemistry, v.249, p.509-512.
Blonski, M. S. et al.
Brazilian Archives of Biology and Technology 860
Espen P. V, Nullens.H, Adams F (1977). A computer analysis of X-ray fluorescence
spectra. Nuclear Instruments and Methods, v. 142, p. 243-250.
Fanta. N., Quaas. A, Zulueta.P, Perez L. M(1992)– Release of reducing sugars from citrus seedlings, leaves and fruits. Effect of treatment with pectinase and cellulase from alternaria and trichoderma. Phytochemistry, v.31, p.3359-3364.
Giauque.R. D. Goulding.F.S, Jaklevic.J.M, Pehl.R.H (1973). Trace element determination with semicondutor detector X-ray spectrometers. Analitical Chemistry, Washington, v.45, n.4, p.671-681.
Guohui. L, Shouzhong. F(1995) – Direct determination of 25 elements in dry powdered plant materials by X-ray fluorescence spectrometry. Journal of Geochemical Exploration 55, p.75-80.
Ivanova. Ju, Djingova.R, Kuleff.I(1999) – Possibilities of ED-XRF with radionuclide sources for analysis of plants. Radioanalytical and Nuclear Chemistry, v.242, p.569-575.
Lachance G.R, Claisse. F (1994) – Quantitative X-Ray Fluorescence Analysis Theory and Aplication, John Wiley and Sons 400p.
Nascimento Filho, V. F. (1993). Técnicas analíticas nucleares na pesquisa agropecuária: Fluorescência de raios X e Ativação neutrônica. Centro de Energia Nuclear na Agricultura/CENA-ESALQ/USP, Piracicaba p.1-24.