© 2014 Science Publications
doi:10.3844/jcssp.2014.697.704 Published Online 10 (4) 2014 (http://www.thescipub.com/jcs.toc)
Corresponding Author: Hermawan Syahputra, Department of Mathematics, Faculty of Mathematics and Natural Sciences, State University of Medan, Medan, Indonesia
PLANT RECOGNITION USING STEREO LEAF
IMAGE USING GRAY-LEVEL CO-OCCURRENCE MATRIX
1
Hermawan Syahputra,
2Agus Harjoko,
2Retantyo Wardoyo and
2Reza Pulungan
1
Department of Mathematics, Faculty of Mathematics and Natural Sciences, State University of Medan, Medan, Indonesia
2
Department of Computer Science and Electronics, Faculty of Mathematics and Natural Sciences, Universitas Gadjah Mada, Yogyakarta, Indonesia
Received 2013-10-29; Revised 2013-12-21; Accepted 2013-12-24
ABSTRACT
Adequate knowledge, such as information about the unique characteristics of each plant, is necessary to identify plant. Researchers have made plant recognition based on leaf characteristics. The leaf image-based plant recognition in view of different angles is a new challenge. In this study, the research on the plant recognition was conducted based on leaf images resulted from 3D stereo camera. The 3D images are very influential in the development of computer vision theory, which can provide more detailed information of an object. One of the information that can be obtained is about the position of the object in its image with the background as well as of the camera. One of the ways used to obtain such information is to calculate the disparity. However, this method will only tell the position of the object compared to other objects without that of range. Sum Absolute Different (SAD) is a method that can be used to find the disparity value. The SAD method does not require heavy computations and long process. Before calculating the disparity, all the images should be previously segmented. The objective of this segmentation is to separate all the objects from the background. Furthermore, filtering and polynomial transformation at the results of disparity is necessary to improve the quality of resultant images. Furthermore, 22 features were extracted using GLCM features (second order statistics) of images resulted from disparity improvement. The highest accuracy of match in the recognition of plant varieties was obtained at 50 cm distance and in the recognition of three plant varieties was 83.3%. Keywords: Disparity, Plant Recognition, Stereo Vision, GLCM
1. INTRODUCTION
This The recognition of plants is very important to study the genetic diversity of plant (Singh et al., 2011; Lu et al., 2012), ecological sensitivity, environmental durability, the maintenance of atmospheric composition, nutrient cycle and other ecosystem processes (Du and Wang, 2011). Some researchers developed the recognition of plant to manage food production (Wu et al., 2009), to recognize medicinal plants (Ershad, 2011; Pornpanomchai et al., 2011a), to manage and control the growth of plants (Chuanyu et al., 2011) and to meet the objectives of research in the field of botany. In addition, the recognition of plants can also be used to identify and control pests and plant diseases (Hashim et al., 2010) and so on.
Sufficient knowledge is required to identify the plants such as knowledge or information about the unique characteristics of each plant. The characteristics of plants can be obtained through the structure of plant organs, such as stems, leaves, flowers, seeds or other structures. However, many researchers do plant recognition based on leaf characteristics (Wu et al., 2009; Singh et al., 2010; 2011; Pornpanomchai et al., 2011b). This is because the leaves of plants are more easily obtained than others. Fruits and flowers on the plant cannot be obtained from plants.
Moreover, the plant leaves that are the 3D objects appear as the 2D objects if they are captured by a regular camera, so that extraction of the features of 2D images does not directly correspond to the object model. This led to the possibility of errors in identifying the plant leaves. Therefore, a method is required to provide a more detailed description of the images corresponding to the original object. The transformations of 2D to 3D or 2D to 3D images should be done before the features are observed and matched with the 3D object model. To retain the features of an object from different positions is very difficult. Researcher believes that study in the recognition of plant based on leaves can be developed using the resultant images of leaves captured by the 3D camera, so it can improve the ability and accuracy of recognition.
1.1. Preliminaries
1.1.1. Stereo Vision
Stereo vision is an attempt to get the stereo images of object from two different positions. The stereo images are obtained by placing two cameras in the same field with a certain distance or using a camera with two lenses (stereo camera).
1.2. Disparity
The types of 2D or 3D images are very influential in the development of computer vision theory to construct a system that can provide information about an object. One of the information that can be given is the position of the object in the image with a background and of the camera. One of the techniques that can be used to obtain this information is the calculation of disparity or just called as disparity.
Disparity is a component of the stereopsis process, indicating the difference of an image captured by left and right eyes. It is obtained by comparing a stereo image that overlap with other images in turn. The stereo images are two images taken from the same object using two cameras with a certain distance or a camera with two lenses in a certain distance, which usually has a distance equal to the distance of two human eyes.
The method used to find out the disparity value is the Sum of Absolute Differences (SAD). This method does not require a lot of computations and a long process, though the calculation speed also depends on the specifications of computer used. To estimate the difference, the process selects the same values of comparative operations between two images (Kamencay et al., 2012).
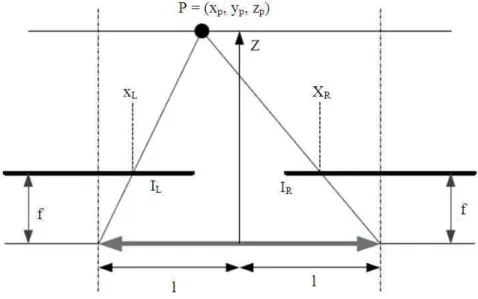
The idea of disparity can be illustrated in Fig. 1, where an arbitrary location of the point P in three dimensions is considered as a distant object seen by two
cameras that are positioned in the same orientation but separated by a distance called the baseline. Furthermore, the object will appear in the same position in the two stereo images. Distance between the objects in the left and right images known as d disparity is defined by Equation (1), where xL and xR are the x coordinates of projection for the 3D coordinates into the left and right field of IL and IR images (Kamencay et al., 2012).
The image plane of left and right camera are located in the same plane, so the y coordinates of both images are the same (YL = YR) and the disparity is equal to the difference between the horizontal coordinates (xL - xR).
p p
L R
p p
x l x l d x x f
z z
+ −
= − = −
(1)
1.3. Longan Leaf as Object Sample
Longan (also called Dimocarpus Longan or
Sapindaceae) is a fruit plant from Southeast Asia. Longan plant has umbrella-like canopy shape and lush compound leaves with opposite arrangement along the stem. A stem has 3-6 pairs of leaflets. Upper leaf surface is glossy dark green in color. Leaf edge is flat with tapering tip, tapered base and pinnate leaf venation. The leaves grow on the limb with 6-9 leaves. The leaf ranges from 4-9 cm in length and 2-4 cm in width. Figure 2 shows several types of Longan.
1.4. Texture Analysis Using Gray-Level
Co-Occurrence Matrix (GLCM)
Gray-Level Co-occurrence Matrix (GLCM) is one of the well-known texture analysis methods to estimate the image properties related to second-order statistics (Lu et al., 2012). The matrix is designed to measure the spatial relationship between pixels. This method is based on the belief that the information of texture is resulted from some relationships. Each entry (i,j) in GLCM is in accordance with the number of occurrences of a pair of gray levels i and j, which are separated by distance d as a distance in the original image.
To estimate the similarity between different gray-level co-occurrence matrices, some researchers used 22 features in his study and others also used a number of different features. In this study, 22 features were used as it is believed that the 22 features can distinguish objects well (Babaghorbani et al., 2010; Ehsanirad, 2010; Ershad, 2011). These features were as follows:
• Angular Second Moment (Energy), indicating the size of the image homogeneity properties:
( )
{
}
2i j
Fig. 1. A simple stereo system (Wang and Ju, 2009)
Fig. 2. The variety of LonganSource: Telaga Nursery Prambanan, Pemukit baru, Tlogo RT12 RW 04, Prambanan, Klaten
where, p(i,j) states the values in row i and column jin the co-occurrence matrix:
• Contrast, indicating the size of image matrix element spread (moment of inertia):
( )
2
k i j i j k
CON k p i, j
− =
=
∑ ∑∑
• Correlation 1, indicating the linear dependence of the size of the gray level, so providing guidance in a linear structure image:
( ) ( )
x yi j x y
ij .p i, j
COR1= − µ µ
σ σ
∑ ∑
where, σx and σy are standard deviation values of consecutively column and row elements in the matrix of p(i, j):
• Correlation 2:
( )(
x)
(
y)
i j x y
p i, j i j
COR 2= − µ − µ
σ σ
∑∑
( ) ( )
i j
AUC=
∑∑
ij .p i, j• Variance, indicating variation of the co-occurrence matrix elements:
(
x)
(
y)
( )
i j
VAR=
∑∑
i− µ j− µ p i, jwhere, µx dan µy are the average values of consecutively row and column elements in the matrix of p (i, j): • Inverse Different Moment (Homogeneity), indicating
that the homogeneity of image at the same level is gray. The homogeneity of image IDM will have a great value:
( )
2 i j
1
IDM1 p i, j
1 i j
=
+ −
∑∑
• Inverse Different Moment (Homogeneity) 2:
( )
i j
1
IDM2 p i, j
1 i j
=
+ −
∑∑
• Different Inverse Normalized:
( )
i j
1
IDN p i, j
i j
=
−
∑∑
• Inverse Different Moment Normalized:
( )
2( )
i j
1
IDMN p i, j
1 i j
=
+ −
∑∑
• Entropy, indicating the size of the form less shape. ENT with a great value is for gray level images with uneven transition, while that with a little value is for irregular image structure:
( )
2( )
i j
Ent2=
∑∑
p i, j .log p i, j• Cluster Shade:
( ) (
)
3x x
i j
Cshad=
∑∑
p i, j . i− µ + − µj• Cluster Prominence:
( ) (
)
4x x
i j
Cprom=
∑∑
p i, j . i− µ + − µj• Maximum Probability:
( )
m i, j
C =max p i, j
• Sum Average (Mean):
( )
2G
k 2 i, j
AVER k p i, j
=
=
∑ ∑
• Sum Entropy:
( )
( )
i j k
2G
k 2 i, j
SE p i, j log p i, j
+ =
=
=
∑∑
• Sum Variance:
(
) ( )
2G
2
i 1
SV 1 SE p i, j
=
=
∑
−• Difference Variance (Contrast):
( )
i j k
G 1 2
k 0 i, j
DIVAR i log p i, j
− =
−
=
=
∑ ∑
• Difference Entropy:
( )
( )
i j k
G 1
k 0 i, j
DENT p i, j log p i, j
− = − = =
∑ ∑
• Dissimilarity:( )
i jDisim=
∑∑
i−jp i, j• Information measured of correlation1
This information is generated from the correlation coefficient of normal distribution:
{
}
HXY HXY1 InfoCor1
maks HX, HY
− = Where:
( )
( )
( )
( )
( )
( )
( )
(
( )
)
( )
(
( ) ( )
)
( ) ( )
(
( ) ( )
)
2 i 2 j 2 i j 2 i j 2 i jHX p i log p i
HY p j log p j
HXY p i, j log p i, j
HXY1 p i, j log p i p j
HXY2 p i p j log p i p j
• Information measured of correlation 2:
( )1
2
2 HXY 2 HXY
InfoCor2 1 e= − − − −
Information correlation coefficient is the probability density function of the joint distribution p (x, y) of two variables x and y.
2. MATERIALS AND METHODS
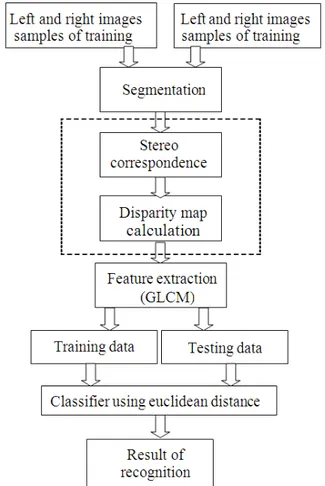
In the recognition of Longan plant’s leaves, the Fujifilm 3D camera stereo was used as a tool to capture the leaf objects. Once the images were captured, STHmaker software was used to convert the file formats from .MPO to .JPG. The scheme of this research is shown in Fig. 3.
2.1. Input of Stereo Images
The amount of leaf images used was 600 pairs of left and right leaf images for the training data and 150 ones for the testing for each variety of Longan, so the total number for 9 varieties was 5400 pairs for the training data and 1350 pairs for the testing.
2.2. Segmentation
Leaf images were previously segmented before the disparity value of a pair of leaf images was calculated. The objective of the segmentation was to separate the objects from the background.
2.3. Stereo Correspondence and Stereo Map
Calculation quations
In this step, a pair of left and right images was matched with each other. In the experiment, the selection of maximum disparity value (so-called dismax) and window value that was able to give better disparity outcomes was made. The disparity (comparison of two images) of the stereo images was obtained from stereo vision. However, this method only tells the position of the object to another object without any distance between positions.
SAD algorithm was one of the measures of inequality in the matching of left and right stereo images with a square window. It calculated difference in intensity for each central pixel (i, j) in the window W(x, y) as follows:
N
L R
(i, j) W ( x, y)
SAD(x, y,d) I (i, j) - I (i - d, j)
∈
=
∑
where, IL and IR were functions of the pixel intensity of left and right images respectively. W (x, y) was a square window centered at (x, y) pixel and d was the maximum disparity.
Fig. 3. Research scheme
2.4. Feature Extraction using GLCM
Once the difference value was obtained from each pair of the leaf images, 22 features were extracted by using GLCM features (second order statistics).
2.5. Euclidean Distance Similarity
At each pattern matching process, a measure that can provide information about the similar characteristics of compared images was required. For those with vector-shape characteristics (such as Fourier spectrum, edge and texture), Euclidean distance was commonly used to measure the similarity with the following formula:
2 2 1/ 2
1 1 n n
d(x, y) = x - y = [(x - y ) +...+ (x - y ) ]
3. RESULTS
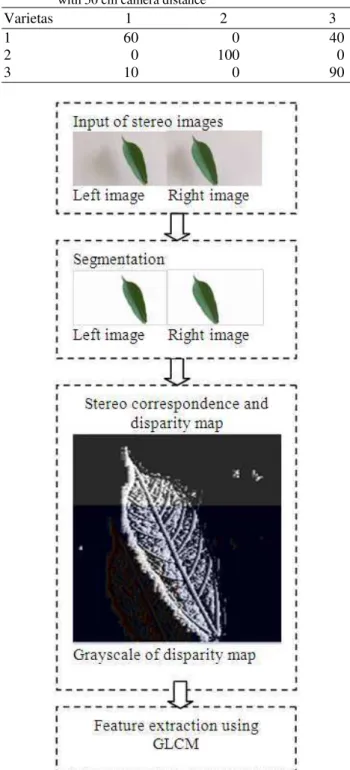
The implementation of the research scheme was done using Matlab 7. Results of the implementation are shown in Fig. 4.
First, each pair of the left and right leaf images was taken from leaf images in image database folder.
Second, each leaf image was segmented, so that the images containing original objects (colorful) with white background were produced. Before segmented, each leaf image was resized into the ratio of 500×500, adjustments were made, conversions were done from RGB format into gray scale format and the threshold was determined to be able to separate objects from the background.
Third, both disparity map and stereo correspondence were calculated by the SAD method. The calculation of SAD (x, y, d) disparity was repeated within the framework of x coordinate in the drawing lines, which were defined by zero and the possible maximum disparity (dismax) of 3D scene searched. The minimum value of difference in frame indicates the best matching pixel and the minimum position defines difference from the actual pixel. The quality of 3D disparity maps depends on the size of the square window, because the larger size of such square window in accordance with the greater probability of true difference in pixel is calculated from the match point, though the calculation will be slower (Kamencay et al., 2012). In this experiment, the dismax value of 7 and the square window of 3 were selected.
Fourth, disparity results were refined by using a polynomial transformation to improve the image quality.
Finally, the matching was done using the Euclidean distance. By the Euclidean distance, it takes only a single process, i.e., to measure the features of distance from the features of the training data and to compare each distance to get the minimum distance.
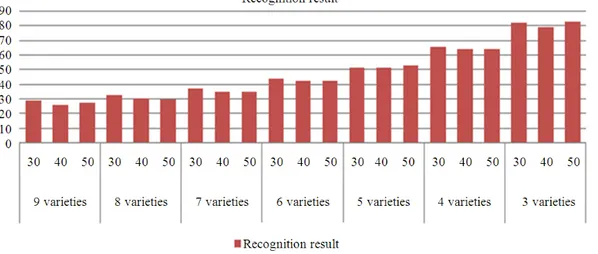
The implementation of the matching of Longan plant varieties was done by using some variations in the number of varieties and in three different distances. Results of the matching can be seen in Fig. 5.
Based on Fig. 5, it can be seen that the highest accuracy was obtained in the recognition of three plant varieties with 50 cm camera distance, i.e., 83.3%. Meanwhile, Table 1 shows the classification errors in the recognition of three plant varieties with 50 cm camera distance.
Variety 1 was recognized as variety 1 with 60% and recognized as variety 3 with 40%; variety 2 was recognized with 100%; and variety 3 was
appropriately recognized with 90% and recognized as variety 1 with 10%.
Table 1. The result of recognition among three plant varieties with 50 cm camera distance
Varietas 1 2 3
1 60 0 40
2 0 100 0
3 10 0 90
Fig. 5. The result of similarity among nine plant varieties in three different camera distances
4. DISCUSSION
Based on Table 1, the result of recognition among three plant varieties using 3D leaves images is 83,3%. It have low accuracy compared with plants recognition using 2D leaves images.
In recognizing 3 leaves types using two different shape modeling techniques, i.e., Moments-Invariant (MI) model and Centroid-Radii (CR) model, the accuracy is 90-100% using Artificial Neural Network (Chaki and Parekh, 2011). Moreover, in recognition of 3 different leaves images groups with varying size and lighting using combined feature extraction by Transform Gabor, local Phase Quantization (LPQ) and Principle Component Analysis (PCA), the accuracy is 84,89% with Support Vector Machine as the classifier (Venkatesh and Raghavendra, 2011).
Factors causing high accuracy in leaves recognition in the previous study compared with current study are, first, plant types recognized tend to have different characteristics. Pornpanomchai et al. (2011a) and Kadir et al. (2011) identify 32 herb types with different shape characteristics. Second, the entire leaves objects in input images had similar positioning, which was frontal position. Third, input images used were 2D images. Meanwhile in this study plants recognition was done between varieties with high similarity.
In this research we use disparity map features of images. Plants recognition based on stereo images should have higher accuracy. This was because 3D stereo images will give more detailed information compared with 2D images. Therefore, plants recognition based on
3D stereo images should be developed using more accurate models. In future work, we will develop a preprocessing technique to identify leaves images using depth map from stereo images.
5. CONCLUSION
This study proposed plant recognition based on stereo leaf images using 22 features of Gray Level Co-occurrence Matrix. The implementation of matching was done with some variations in number of plant varieties in three different camera distances, i.e., 30, 40 and 50 cm. By using the similarity in Euclidean distance, some resultant accuracy of the matching was produced. The highest accuracy of the matching in the recognition of plant variety was obtained at 50 cm camera distance and the recognition of three plant varieties was 83.3%. Therefore, the new scheme of plant recognition based on the stereo leaf images provided better but not optimum results, so the system is necessary to develop in the future by taking the depth of image into account.
6. REFERENCES
Chaki, J. and R. Parekh, 2011. Plant leaf recognition using shape based features and neural network classifiers. Int. J. Adv. Comput. Sci. Applic., 2: 41-47.
Chuanyu, W., G. Xinyu and Z. Chunjiang, 2011. Detection of corn plant population and row spacing using computer vision. Proceedings of the Second International Conference on Digital Manufacturing and Automation (ICDMA), Aug. 5-7, IEEE Xplore Press, Zhangjiajie, Hunan, pp: 405-408. DOI: 10.1109/ICDMA.2011.106
Du, M. and X. Wang, 2011. Linear discriminant analysis and its application in plant classification. Proceedings of the 4th International Conference on Information and Computing, Apr. 25-27, IEEE Xplore Press, Phuket Island, pp: 548-551. DOI: 10.1109/ICIC.2011.147
Ehsanirad, A.S.K., 2010. Leaf recognition for plant classification using GLCM and PCA methods. Oriental J. Comput. Sci. Technol., 3: 31-36.
Ershad, S.F., 2011. Color texture classification approach based on combination of primitive pattern units and statistical features. Int. J. Multimedia Applic.
Hashim, H., M.A. Haron, F.N. Osman and S.A.M. Al-Junid, 2010. Classification of rubber tree leaf disease using spectrometer. Proceedings of the 4th Asia International Conference onc Mathematical/Analytical Modelling and Computer Simulation, May 26-28, IEEE Xplore Press, Kota Kinabalu, Malaysia, pp: 302-306. DOI: 10.1109/AMS.2010.67
Kadir, A., L.E. Nugroho, A. Susanto and P.I. Santosa, 2011. Leaf classification using shape, color and texture features. Int. J. Comput. Trends Technol. Kamencay, P., M. Breznan, R. Jarina, P. Lukac and M.
Zachariasova, 2012. Improved depth map estimation from stereo images based on hybrid method. Radioengineering, 21: 70-71.
Lu, H., W. Jiang, M. Ghiassi, S. Lee and M. Nitin, 2012. Classification of Camellia (Theaceae) species using leaf architecture variations and pattern recognition techniques. PloS, 7: e29704-e29704. DOI: 10.1371/journal.pone.0029704
Pornpanomchai, C., C. Supapattranon and N. Siriwisesokul, 2011a. Leaf and flower recognition system (e-Botanist). Int. J. Eng. Technol., 3: 347-351. Pornpanomchai, C., S. Rimdusit, P. Tanasap and C.
Chaiyod, 2011b. Thai Herb Leaf Image Recognition System (THLIRS). Kasetsart J., 45: 551-562. Singh, K., I. Gupta and S. Gupta, 2010. SVM-BDT PNN
and fourier moment technique for classification of leaf shape. Int. J. Signal Proc. Image Proc. Patt. Recogn., 3: 67-78.
Singh, K., I. Gupta and S. Gupta, 2011. A comparison of 2D moment based description techniques for classification of bamboo plant. Proceedings of the International Conference on Computational Intelligence and Communication Networks, (CICN), Oct. 7-9, IEEE Xplore Press, Gwalior, pp: 15-20. DOI: 10.1109/CICN.2011.4
Venkatesh, S.K. and R. Raghavendra, 2011. Local gabor phase quantization scheme for robust leaf classification. Proceedings of the 3rd National Conference on Computer Vision, Pattern Recognition, Image Processing and Graphics (NCVPRIPG), IEEE Xplore Press, Hubli, Karnataka, pp: 211-214. DOI: 10.1109/NCVPRIPG.2011.52 Wang, G. and H. Ju, 2009. A disparity map extraction
algorithm for lunar rover BH2. Proceedings of the IEEE International Conference on Intelligent Computing and Intelligent Systems, Nov. 20-22, IEEE Xplore Press, Shanghai, pp: 385-389. DOI: 10.1109/ICICISYS.2009.5357641