Synthesis and Characterization of Non-Linear Optical Crystal of Manganese Mercury
Thiocyanate Glycol Monomethyl Ether
Cynthia Sundararaja, Suresh Sagadevanb*
Received: August 14, 2016; Revised: October 19, 2017; Accepted: October 25, 2017
The design and synthesis of organic nonlinear optical (NLO) crystals are a promising area of current research in materials science. Organic materials are found to possess better non linear optical properties when compared to inorganic materials. Recently, there has been a widespread interest in the metal-organic coordination compounds, which are a combination of metal and organic ligands, having exciting NLO properties. Non-linear optical single crystals of Manganese mercury thiocyanate glycol monomethyl ether(MMTG) were grown from a mixed solvent of glycol monomethyl ether and water by slow evaporation method. Optimum conditions for the growth at ambient temperature were found by investigating different growth parameters. The percentage of optical transmittance by the grown crystal was ascertained by a UV-visible spectral study. The growth features of MMTG crystal was observed by Field Emission Scanning Electron Microscopy technique and Epifluorescence studies for the same were carried out for the first time thus revealing the excitation of the sample around 545 nm. Dielectric measurements on MMTG single crystal were carried out for various frequencies at different temperatures.
Keywords: Organometallic, solvent evaporation method, second harmonic generation, Epifluorescence.
*e-mail: [email protected]
1. Introduction
Nonlinear optical (NLO) materials have been extensively studied in the recent years, due to their potential applications in various fields like optical data storage, optical switching, image processing and manipulation1-3. Organic nonlinear
materials are drawing a great deal of attention, due to their efficient nonlinearities and rapid response in electro-optic effect when compared with the inorganic nonlinear materials. A number of organic nonlinear optical materials have been accounted in literature owing to their non-linear optical and photonic applications4,5. As second order non-linear optical
materials, bimetallic thiocyanates exhibit efficient SHG at short wavelength. The metal thiocyanate and their lewis-base adducts are one of the interesting themes of structural chemistry6. Due to high second order non-linearity, bimetallic
ligand based crystals are gaining much attention. Based on the double-radical structural model, a series of efficient metal organic crystals have been reported. The hard or soft group of metals is suitably selected by considering different percentages of constituent metals and the parent metals are selected to increase the electron transformation7. In the present paper,
MMTG single crystal have been successfully synthesized and grown by slow evaporation technique. With the guidance of this theory, many metal-organic coordination materials with good NLO effect have been designed and synthesized.
2. Materials and Methods
Single crystal of MMTC was grown by slow evaporation technique using the commercially available mercury chloride, manganese chloride and potassium thiocyanate from double distilled water. MMTG have been prepared by taking the raw material in 2:1:1 stoichiometric ratio and synthesized based on the following reaction:
(1)
Single crystals of MMTG were grown by dissolving the MMTC in glycol monomethyl ether taken with water in the ratio (1:2) as a ligand. The solution was vigorously stirred for about 9 hours and then filtered. The filtered solution was kept for nucleation. The solution was allowed to evaporate in room temperature. The chemical reaction is as follows:
(2)
Single crystals of MMTG were grown within a period of 50-55 days of dimensions up to 14x7x3 mm3 by slow
evaporation technique as shown in Fig.1. The grown crystal exhibits hygroscopic nature. In order to avoid the loss of optical transparency the crystals were kept in a dark place. The solubility of MMTG was determined for different temperatures by adopting the same procedure. The solubility of MMTG at room temperature was found to be moderate. After attaining saturation, the equilibrium concentration aDepartment of Physics, Justice Basheer Ahmed Sayeed College for Women, Chennai, India
bDepartment of Physics, AMET University, Chennai, India
KSCN MnCl HgCl MnHg SCN KCl
4 + 2+ 2$ Q V4+
MnHg SCN
CH OC H O
MnHg SCN
CH OC H O
4 3 2 5
4 3 2 5
$
+
Q
of the solute was analyzed and the solubility curve was obtained. The resulting solubility diagram of MMTG salt is shown in Fig.2. It is observed that ZCTC has positive solubility gradient.
the randomly oriented micro crystals was focused by a lens and detected by a photo multiplier tube. Bright green radiation confirms the second harmonic generation property of the crystal. The conversion efficiency of MMTG crystal was found to be 1.8 times as that of standard potassium dihydrogen phosphate9.
3.2 Single Crystal XRD and fundamental
parameters
The crystal system and lattice parameters were determined by single crystal X-ray diffraction analysis using X-ray diffractometer ENRAF NONIUS CAD 4. The results obtained from the instrument shows that the crystal belongs to the tetragonal system. The determined cell parameters are a = 14.0644 Å, b = 14.240 Å, c = 9.732 Å; α = 80.634°, β = 92.143°, γ = 86.73°, V = 1174 (Å)3. This is in good
agreement with the reported value10. The calculated value of
the molecular density of the grown crystal was found to be ρ = 1.137g/cm-3. The valence electron plasma energy ℏω
p is,
(3)
Where, z is the total number of valence electrons, ρ the density and M the molecular weight of the crystal. Explicitly the factors depending on ℏωp are the Penn gap Ep and the
Fermi energy EF given by,
(4)
The electronic polarizability (∝) was obtained using the relation,
(5)
The value of ∝ so obtained agrees well with the Clausius-Mosotti relation,
(6)
Where the symbols have their usual significance and Na
is the Avogadro number. The calculated fundamental data of the grown MMTG crystal obtained. The high frequency dielectric constant of materials is a very important parameter for calculating the physical or electronic properties of materials. All the above parameters were calculated and shown in Table 1.
3.3 Linear optical property
The optical absorption study is an important tool in identifying the usefulness of a NLO material in the visible Figure 1. As grown MMTG crystal
Figure 2. Solubility curve of MMTG crystal
3. Results and Discussion
3.1 Second Order non-linear optical property test
The second harmonic generation efficiency of materials crystallized in non-centrosymmetric crystal structures has been confirmed by the most widely used Kurtz and Perry technique8. The sample was tested using Q switched Nd:YAG
laser beam of wavelength 1064 nm, Quanta ray series supplied by spectra Physics and Coherent molectron power meter, USA. An input power of 6.8mJ/pulse and pulse width of 8 ns with a repetition rate of 10Hz was used. The grown crystals were crushed into a fine powder and then packed in a micro capillary of uniform bore and exposed to laser radiations. The 532 nm radiation was collected by a monochromator after separating the 1064 nm pump beam with an Infra-red blocking filter. Second harmonic radiation generated by
.
Z
M
28 8
/
p
1 2
~
=
T
t
Y
.
E
p
E
1
0 2948
/ / p F p r 1 2 4 3
f
~
~
=
-=
Q
Q
V
V
.
S
E
S
cm
Where
M
S
E
E
E
E
3
0 396
10
1
4
1
3
4
p o p
p o o F p F P 2 2 2 24 3 2
#
#
#
~
~
t
a
=
+
= -
+
-Q
Q
V
V
#
#
&
#&
&
Na
M
4
3
2
1
r ra
r
f
f
=
Q
Q
+
-
V
V
ℏ
ℏ
ℏ
Table 1. Electronic properties of the MMTG Crystal
Plasma energy Penn gap Fermi energy Polarizability/cm2
/eV /eV /eV Penn analysis Clausious Mossotti
6.382 1.625 34.60 5.630 x 10⁻²³ 5.584 x 10⁻²³
and blue regions. The UV-visible absorbance spectrum was recorded for the grown compound in the wavelength range of 200-260 nm using a UV-Vis Spectrophotometer LS 25 Perkin Elmer. The optical absorbance spectrum of MMTG is shown in Figure 3. From the absorbance spectrum, it is observed that the grown crystal is completely transparent in the UV and visible spectral regions with the lower cut off wavelength at around 205 nm11 thereby confirming the
advantages of the crystal. The electrons responsible for electronic polarization in this crystal are involved in electron jump12. Complete transparency of the crystal between
the region 200-260 nm is an advantage of the crystal for optoelectronics and nonlinear applications13-15.
Figure 3. Optical absorption spectrum of MMTG crystal
3.4 Field Emission Scanning Electron
Microscope
The Field Emission Scanning Electron microscope study was carried out using supra 55, Carl Zeiss, Germany. In order to analyze the nature and surface morphology, FESEM analysis was employed and the grown crystal was cut into few mm for this purpose. The FESEM images of MMTG crystal taken in two different magnifications are shown in Figure 4. The images show step-like growth, which suggests the existence of grain boundaries and striations as shown in Figure 4a. The surface is smooth and free from any visible inclusions16. The micrograph in Figure 4b shows
presence of few cracks on the crystal surface. The changes on the surfaces and the patterns are due to optimization of pH and temperature oscillations during the growth of the crystal. Dendrite growth pattern and formation of minute
crystallites over the surface were seen in Figure 4b. At higher magnification, cubic micro crystals formation was also evident17.
Figure 4. FESEM images of MMTG crystal
Figure 5. EDAX spectrum of MMTG crystal
3.5 Energy dispersive X-ray analysis
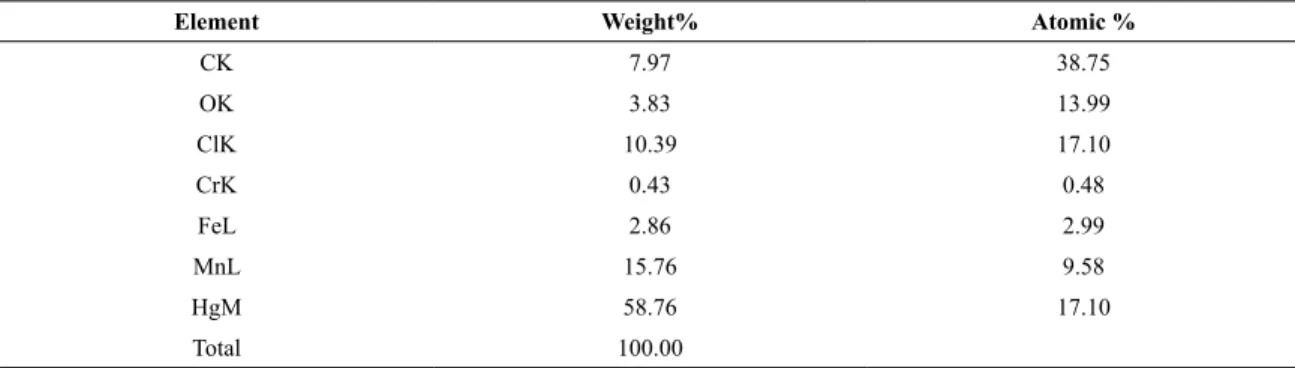
Energy dispersive X ray analysis is a micro-analytical technique used to obtain information of the chemical composition of the grown crystal using the instrument Supra 55 coupled with Carl Zeiss and bombarded with 20,000 volts and the obtained spectrum is shown in Figure 5. The spectrum confirms the exact chemical composition of MMTG. The various elements present in MMTG in weight % shown in Table 2 are C(K)=7.97, O(K)= 3.83, Cr(K)= 0.43, Cl(K)= 10.39, Mn(L)= 15.75, Hg(M)= 58.77 respectively.
3.6 AFM amplitude analysis
Table 2. Energy dispersive X-ray analysis
Element Weight% Atomic %
CK 7.97 38.75
OK 3.83 13.99
ClK 10.39 17.10
CrK 0.43 0.48
FeL 2.86 2.99
MnL 15.76 9.58
HgM 58.76 17.10
Total 100.00
Table 3. Roughness analysis of MMTG crystal
Peak-to-peak, Sy 51.97 nm
Ten point height, Sz 25.88 nm
Average Roughness, Sa 3.87 nm
Root Mean Square, Sq 5.176 nm
Surface skewness, Ssk 0.291
Coefficient of kurtosis, Ska 1.438
Spring constant of the cantilever is estimated to be 0.15 N/m. AFM images recorded on the crystal surface is shown in Figure 6. In view of three-dimensional image, hillocks and valleys are observed. The parameters like average roughness, the mean value, root-mean-square value, the valley depth, the peak height, and peak-valley height have been estimated. It is evident from the MMTG image that the sample possesses cleavage steps and imaged at the slopes with large growth hillocks19. Occasionally bumps were also observed on the
surface of crystals. Roughness of the surface increases at lower fluence and decreases for higher fluence. The decrease in the roughness of the crystal at a higher fluence is due to sputtering of molecules at the impact sites. The dimensions of the hillocks formed after irradiation is also shown in the AFM image. The numerical values for the amplitude parameters so obtained are the RMS roughness 3.87 nm, surface skewness 0.291, surface kurtosis 1.438, maximum peak to peak height 51.97 nm and ten point height 25.88 nm respectively.
3.7 Epifluorescence
Fluorescence is the emission of light by a substance that has absorbed light or other electromagnetic radiations. The most striking examples of fluorescence occur when the absorbed radiation is in the UV region of the spectrum, and thus invisible to the human eye and the emitted light is in the visible region20. The most important advancement in fluorescence
microscopy was the development of episcopic illumination for fluorescence microscopes. These first epifluorescence microscopes probably used half-silvered mirrors for the beam splitter, with a maximum overall efficiency of 25%. The important advantages of this method are 1) the ability to
Figure 6. 3 D image of MMTG crystal
use high numerical aperture objective as the condenser, thus achieving greater brightness; 2) the intensity of excitation light reflecting back into an oil-immersion objective is roughly 1% of the incident light; and 3) ease of alignment. The introduction of dichroic beam splitters by Brumberg in 1948, and their subsequent commercialization by Ploem in 1967, improved the efficiency of the beam splitter to nearly 100% and further improved the filtering effect of the microscope. Epifluorescence study reveals that MMTG emits green light21 and fluoresces is at about 545 nm confirming
its suitability for NLO applications. The fluorescent image thus obtained is shown in Figure 7.
3.8 Photoconductivity
the applied field. The applied voltage was increased from 1 to 20 V/cm and the corresponding photocurrent was recorded. Both photocurrent and dark current are plotted as a function of the applied voltage. Figure 8 shows the variation of both dark and photocurrent with applied field at different levels of illumination. It is seen from the plots that both dark and photocurrent of the sample increase linearly with the applied field and the dark current is less than photocurrent at any instant for the same applied field, testifying positive photoconductivity. This may be attributed to the generation of mobile charge carriers caused by absorption of photons. However, in the case of the dark current is less than photocurrent, thus revealing positive photoconductivity22.
bonding in the material. The study of the electrical and other properties of dielectrics in relation to their chemical composition and structure will lay the basis for obtaining new materials with new properties. However materials with high dielectric constant in the low frequency region decrease with the applied frequency23. Crystals with high dielectric
constant led to power dissipation24.
In the present work, HIOKI 3532-50 LCR HITESTER meter was used for the dielectric study. The dielectric constant and loss were measured in the frequency range from 50 Hz to 5 MHz for the grown MMTG crystal. Good quality crystal was selected for dielectric studies. The dielectric constant was measured as a function of frequency at different temperatures of 313 K, 323 K and 333 K as shown in Figure 9 while the corresponding dielectric losses are depicted in Figure 10. The dielectric constant was calculated using the relation,
(7)
Where, C is the capacitance, d is the thickness and A is the area of the sample. It is observed that the dielectric constant decreases with increase in frequency. The large values of dielectric constant at low frequency enumerate that there is a contribution from all four known sources of polarization, namely electronic, ionic, dipolar and space-charge polarizations. Space charge polarization is generally active at lower frequencies and high temperatures25. Further, the space charge polarization is
dependent on the purity and perfection of the material. From Figure 10 the decrease in the value of dielectric constant with log frequency is due to the fact that the frequency of electric charge carriers cannot follow the alternation of the ac electric field applied beyond a certain critical frequency. In accordance with the Miller rule, the characteristics of low dielectric constant at high frequency suggest that the sample possesses enhanced optical quality with fewer defects26. The
very low value of dielectric constant at higher frequencies is important for the fabrication of materials for ferroelectric, photonic and electro-optic devices.
Figure 7. Epifluorescence image of MMTG crystal
Figure 8. Field dependent conductivity of MMTG crystal
3.9 Dielectric Measurements
Dielectric measurement is one of the useful characterizations of electrical response of solids. A study of the dielectric properties of solids gives information about the electric field distribution within the solid. The frequency dependence of these properties gives a great insight into the materials applications. The different polarization mechanisms in solids can be understood from the study of dielectric constant as a function of frequency and temperature. The study of dielectric constant of a material gives an insight into the nature of
A
Cd
r 0
f
f
=
4. Conclusion
Single crystal of MMTG was grown by slow evaporation method in a period of 55 days. Identity of the crystal material was confirmed by single crystal XRD analysis. The second harmonic efficiency was confirmed by the emission of green light. The optical absorption study reveals that the sample possesses very low absorbance in the visible region and the cut-off wavelength of MMTG crystal was found to be 205 nm. The FESEM studies show that the surface is smooth and free from any visible inclusions. Energy dispersive X-ray study reveals elemental analysis of the grown crystal. The AFM study gives the amplitude analysis, an important parameter to evaluate surface roughness. Finally the Epifluorescence studies show that the crystal fluoresces and the compound was excited at 545 nm. The frequency dependence of dielectric constant decreased with the increasing frequency at different temperatures. Photoconductivity study revealed that the photocurrent was greater than the dark current at varying fields.
5. References
1. Moitra S, Seth SK, Kar T. Synthesis, crystal structure, characterization
and DFT studies of L-valine L-valinium hydrochloride. Journal
of Crystal Growth. 2010;312(12-13):1977-1982.
2. Gonsago CA, Albert HM, Malliga P, Pragasam AJA. Crystallization,
spectral, and thermal characterization of l-histidine methyl ester
dihydrochloride (LHMED). Journal of Thermal Analysis and Calorimetry. 2012;107(3):1231-1235.
3. Babu GA, Ramasamy P. Growth and characterization of an organic NLO material ammonium malate. Current Applied
Physics. 2010;10(1):214-220.
4. Rajasekaran M, Anbusrinivasan P, Mojumdar SC. Growth,
spectral and thermal characterization of 8-hydroxyquinoline.
Journal of Thermal Analysis and Calorimetry. 2010;100(3):827-830.
5. Gonsago CA, Albert HM, Malliga P, Pragasam AJA. Growth and Characterization of Pure and Thiourea Doped L-Histidine
Single Crystals. Materials and Manufacturing Processes. 2012;27(3):355-359.
6. Marcy HO, Rosker MJ, Warren LF, Cunningham PH, Thomas CA, DeLoach LA, et al. L-Histidine tetrafluoroborate: a
solution-grown semiorganic crystal for nonlinear frequency conversion.
Optics Letters. 1995;20(3):252-254.
7. Bredas JL, Adant C, Tackx P, Persoons A, Pierce BM.
Third-Order Nonlinear Optical Response in Organic Materials: Theoretical and Experimental Aspects. Chemical Reviews. 1994;94(1):243-278.
8. Kurtz SK, Perry TT. A Powder Technique for the Evaluation
of Nonlinear Optical Materials. Journal of Applied Physics. 1968;39:3978.
9. Prasad PN, Williams DJ. Introduction to Nonlinear Optical
Effects in Molecules and Polymers. New York: John Wiley &
Sons; 1991. 320 p.
10. Nakamoto K. Infrared and Raman spectra of inorganic and coordination compounds. 3rd ed. Beijing: Wiley/Chemical
Industry Press; 1986.
11. Pearson RG. Hard and Soft Acids and Bases. Journal of the American Chemical Society. 1963;85(22):3533-3539. 12. Balarew C, Duhlew R. Application of the hard and soft acids
and bases concept to explain ligand coordination in double salt structures. Journal of Solid State Chemistry. 1984;55(1):1-6.
13. Zernike F, Midwinter JE. Applied Nonlinear Optics. New York:
Wiley; 1973.
14. Sagadevan S. Growth, optical, mechanical, dielectric and theoretical properties of picolinium maleate NLO single crystal.
Optik - International Journal for Light and Electron Optics. 2014;125(12):2826-2829.
15. Sagadevan S, Arivuoli D. Growth, Optical, Mechanical and Dielectric Properties of Glycine Zinc Chloride NLO Single Crystals. Journal of Minerals and Materials Characterization
and Engineering. 2011;10(12):1131-1139.
16. Paramasivam P, Arivazhagan M, Ramachandra Raja C. Synthesis, growth and characterization of zinc manganese thiocyanate crystal. Indian Journal of Pure and Applied Physics. 2011;49(6):394-397.
17. Ravi Kumar SM, Selvakumar S, Kiruba S, Tholkappian
M, Sagayaraj P. Nucleation, growth and characterization of Bis(thiourea) cadmium formate NLO single crystals. International
Journal of Science and Technology. 2011;1(2):51-55.
18. Saif AA, Ramli N, Poopalan P. AFM Study of Multilayer Sol-gel BaxSr1-xTiO3 Thin Films. Jordan Journal of Physics. 2010;3(2):61-68.
19. Vetha Potheher I, Rajarajan K, Vimalan M, Rajesh Kumar T, Jeyasekaran R, Sagayaraj P. Investigation on the Growth and
Characterization of Nonlinear Optical Single Crystals of Tris-Allyl Thiourea Mercury Bromide (ATMB). Archives of Applied
Science Research. 2010;2(3):171-182.
20. Ishwar Bhat S, Govinda Nayak N, Rao V, Ganesan V, Nagaraj HS, Avasthi DK. AFM studies of swift heavy ion and electron
irradiated mixed barium strontium borate nonlinear optical crystal. Radiation Measurements. 2003;36(1-6):695-698.
21. Uma Devi T, Lawrence N, Rameshbabu R, Selvanayagam S,
Helen Stoeckli-Evans, Bhagavannarayana G, Ramamurthi K.
Structural, Electrical and Optical Characterization Studies on Glycine Picrate Single Crystal: A Third Order Nonlinear Optical Material. Journal of Minerals & Materials Characterization
& Engineerin . 2010:9(5):495-507.
22. Cynthia S, Sagadevan S, Mariappan L. Investigations on the linear,
non-linear and optical studies of an efficient organobimetallic
zinc cadmium thiocyanate non-linear optical complex crystal.
Journal of Materials Science: Materials in Electronics. 2017;28(19):14787-1479. DOI: 10.1007/s10854-017-7348-x
23. Sagadevan S. Growth, Optical, Dielectric and Ferroelectric Properties of Non-Linear Optical Single Crystal: Glycine-Phthalic Acid. Journal of Electronic Materials. 2016;45(11):5904-5909.
24. Sagadevan S. Optical and electrical studies of non-linear optical crystal: Potassium boro-oxalate. Optik - International Journal
for Light and Electron Optics. 2016;127(14):5613-5621.
25. Suresh S, Ramanand A, Jayaraman D. Growth, optical, dielectric and fundamental properties of L-arginine acetate NLO single crystal. Recent Res. Sci. Technol. 2011;3(1):25-28.
26. Mohammed AV, Arulappan JAP, Ganesan ST, Sagadevan S. Analysis on the Growth and Characterization of a Non-linear Optical Single Crystal: L-Cystine Dihydrobromid. Materials