Morphometry and histomorphometry of the testis in crossbred pigs fed
diets with different protein levels
[
Morfometria e histomorfometria do testículo em suínos híbridos recebendo dietas com diferentes níveis de proteína]R.M.B. Valença, V.A. Silva Junior*, L.P.C. Araújo, J.C. Reis, M.M.P. Guerra, P.C. Soares, A.N. Costa2
Universidade Federal Rural de Pernambuco – Recife, PE
ABSTRACT
Aiming to evaluate the effect of the diet protein content on testicular parameters in pigs, 21 non-gelded male Dalland pigs were used and randomly divided into three groups. Males belonging to groups G2 and G3 received a diet with crude protein levels of 15% below and above, respectively, in relation to G1 (control). At 210 days of age, animals were castrated, and testis and epididymis were collected for morphometric and histomorphometry analyses. No difference was observed in relation to the total length of seminiferous tubules (G1=3239.9333,3m; G2=2989.4171,7m and G3=3059.5254.9m), population of Sertoli cell (G1=4.70.5x109; G2=4.30.3x109 and G3=4.70.5x109), population (G1=31.65.58x109; G2=27.34.0x109 and G3=26.43.9x109) and volume of Leydig cells (G1=1289.3182.6m3; G2=1179.185.4m3 and G3=1133.337.8m3) and sperm production (G1=5.90.9x109; G2=5.60.6x109 and G3=5.10.3x109). Protein levels were sufficient to maintain spermatogenesis in different experimental groups. It can be concluded that the magnitude of variation in levels of protein used in different stages of development was not sufficient to promote significant changes in testicular development and spermatogenesis process in adult animals.
Keywords: pigs, sperm production, Sertoli cells, protein, testosterone
RESUMO
Avaliou-se o efeito do teor de proteína da dieta sobre características testiculares em suínos, utilizando-se 21 suínos da raça Dalland, distribuídos aleatoriamente em três grupos. Os animais do G2 e G3 receberam dieta com porcentagens de proteína bruta de 15% para mais e para menos, respectivamente, em relação ao G1 (controle). Aos 210 dias de idade, os animais foram orquiectomizados e os testículos e epidídimos foram coletados para análises morfométricas e histomorfométricas. Observou-se efeito significativo da porcentagem de proteína sobre o comprimento e a largura dos testículos, e nenhuma diferença foi identificada em relação ao comprimento total dos túbulos seminíferos (G1=3239,9333,3m; G2=2989,4171,7m e G3=3059,5254,9m), à população de células de Sertoli (G1=4,70,5x109;
G2=4,30,3 x109 e G3=4,70,5x109), à população (G1=31,65,58x109; G2=27,34,0x109 e
G3=26,43,9x109) e ao volume das células de Leydig (G1=1289,3182,6m3; G2=1179,185,4m3
e G3=1133,337,8m3) e à produção espermática (G1=5,90,9 x109; G2=5,60,6x109 e
G3=5,10,3x109
). Os percentuais de proteína foram suficientes para a manutenção da espermatogênese nos diferentes grupos. Pode-se concluir que a magnitude da variação dos níveis de proteína usada em diferentes fases do desenvolvimento não foi suficiente para promover alterações significativas no desenvolvimento testicular e no processo espermatogênico em animais adultos.
Palavras-chave: porcos, produção de esperma, células de Sertoli, proteína, testosterona
Recebido em 12 de outubro de 2012 Aceito em 6 de março de 2013
INTRODUCTION
The relationship between nutritional levels and reproductive efficiency in boars has already been evaluated based on testicular biometry parameters, sexual behavior and sperm production and quality (Kemp and Verstegen, 1991). It is known that the spermatogenesis quantification, which consists of the numerical observation of different types of cells and constituents of the seminiferous epithelium and ratios of different cell populations, is an important method of sperm production analysis (Berndtson and Picket, 1987). However, quantitative data such as intrinsic spermatogenesis production, measurements of the tubular diameter, seminiferous epithelium thickness, and levels of different reproductive hormones considering distinct nutritional levels are still insufficient.
In pigs intended for breeding it is recommended to use 3 to 4kg/day of feed with 14% protein and 70% energy, and this supply could be incremented from 10 to 25% according to climatic conditions and animal conditioning. These animals which are actively used for breeding and submitted to high temperatures and a diet containing less than 12% of protein may present reduction of libido and sperm production (Kunavongkrit et al., 2005). The development of the normal spermatogenesis and pig's puberty is associated to distinct causes: genetic differences between breeds and strains; effects of different nutrition levels; testis weight and hormonal levels (Allrich et al., 1983).
The Sertoli cells are responsible for the structural, nutritional and hormonal supply of germ cells and indirectly regulate the spermatogenic process. The efficiency of the spermatogenesis process is evaluated through several quantitative parameters based on the counting of cells at stage I of the seminiferous epithelium cycle, such as: meiotic index (round spermatids/primary spermatocytes), efficiency coefficient (primary spermatocytes/ spermatogonium A), overall spermatogenesis yield (round spermatid/spermatogonium A) and Sertoli cells index (round spermatids/Sertoli cells) (França and Russell, 1998). Therefore, any kind of alterations which occur on the Sertoli cell
population may provoke a change in quantitative parameters associated with the number of germ cells (Marin-Guzman et al., 2000).
The importance of the protein levels in diet on the development of all structures responsible for the maintenance of the spermatogenesis process is not completely understood. Therefore, this work aimed to investigate the effects of the protein content on some testicular biometry parameters of boars.
MATERIAL AND METHODS
Twenty-one hybrid Dalland genetic (Pietran x Landrace x Large White) 38 day old boars were used in experiment. Males were randomly allocated into three groups (G) in a free-stall with an area of 24.0m2. From 60 to 210 days of age, males were kept individually in identical stalls.
Diets containing different protein levels according to the experimental group and with the development phase are described on Table 1. Animals from G1 (n=6) received a control diet containing protein levels based upon Rostagno et al. (2011). Animals from experimental groups G2 (n=8) and G3 (n=7) respectively, received diets containing protein levels 15% below and above the one prescribed to the control group.
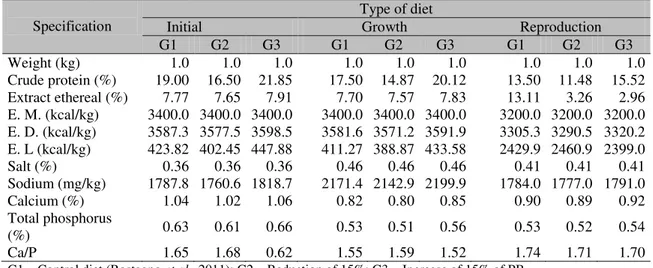
Table 1. Composition of diets formulated with variation in protein levels for hybrid male pigs, from 38 to 210 days of age, ion different phases of development
Specification Initial Type of diet Growth Reproduction G1 G2 G3 G1 G2 G3 G1 G2 G3 Weight (kg) 1.0 1.0 1.0 1.0 1.0 1.0 1.0 1.0 1.0 Crude protein (%) 19.00 16.50 21.85 17.50 14.87 20.12 13.50 11.48 15.52 Extract ethereal (%) 7.77 7.65 7.91 7.70 7.57 7.83 13.11 3.26 2.96 E. M. (kcal/kg) 3400.0 3400.0 3400.0 3400.0 3400.0 3400.0 3200.0 3200.0 3200.0 E. D. (kcal/kg) 3587.3 3577.5 3598.5 3581.6 3571.2 3591.9 3305.3 3290.5 3320.2 E. L (kcal/kg) 423.82 402.45 447.88 411.27 388.87 433.58 2429.9 2460.9 2399.0 Salt (%) 0.36 0.36 0.36 0.46 0.46 0.46 0.41 0.41 0.41 Sodium (mg/kg) 1787.8 1760.6 1818.7 2171.4 2142.9 2199.9 1784.0 1777.0 1791.0 Calcium (%) 1.04 1.02 1.06 0.82 0.80 0.85 0.90 0.89 0.92 Total phosphorus
(%) 0.63 0.61 0.66 0.53 0.51 0.56 0.53 0.52 0.54 Ca/P 1.65 1.68 0.62 1.55 1.59 1.52 1.74 1.71 1.70 G1 – Control diet (Rostagno et al., 2011); G2 – Reduction of 15%; G3 – Increase of 15% of PB.
The testis fragments assigned to the light microscopy study were routinely processed and inserted into a glycol methacrylate solution, being later sliced into 4m thick samples, which were then stained using toluidine blue–1% aqueous sodium borate (Silva Júnior, 2003).
The average tubular diameter determination per sample (animal) was performed by randomly measuring 15 cross sections of seminiferous tubules presenting the contour as round as possible, employing a linear graticule micrometer (U-OCMSQ10/10, Olympus) coupled to an ocular with x10 magnification and a x10 microscope objective yielding an overall magnification of x100. The same 15 cross sections samples used to measure the seminiferous tubules were employed for the seminiferous epithelium height gauging. The procedure was carried out by measuring diametrically from the basal membrane up to the tubular lumen. The height of the epithelium was obtained averaging the data. The volume density of the components of the testicular parenchyma were estimated based upon 11025 points per animal using a micrometric graticule square with 441 points (Olympus) coupled to a X10 ocular and a X40 objective, rendering a X400 overall magnification. The counts were performed using a BX51 Olympus optical microscope and a digital hemocytometric cell counter (Leucotron T-P) (França, 1991; França et al., 2000).
The volume of each testicular parenchyma component (seminiferous tubule and interstitial
space) expressed in mL, was estimated using information on the volumetric percentage occupied by each of these components and by the net weight of the testicle. The value of the latter was acquired by subtracting the weight of the tunica albuginea and testicular mediastinum from the gross weight of the testicle (França, 1991; França et al., 2000). For subsequent morphometric calculations, the specific gravity of the testicular tissue was considered as 1.0 and the albuginea and testicular mediastinum weights obtained from the same animals were excluded from the total testicular weight.
The total length of the seminiferous tubules (LST) per testis expressed in meters was estimated according to Dorst and Sajonski (1974), with data from the volume occupied by the seminiferous tubules in the testis (TSV) and on the average tubular diameter obtained for each animal using the following formula:
LST=TSV/πR2.
With the exception of Sertoli cells, the counts obtained had their values corrected taking into account the average nuclear diameter (ND) and the thickness of the histological fragments according to the formula proposed by Amann (1962): Corrected number =
2 2
CO x TS/ TS + (ND/2) - (ND/4) where CO = counting obtained and TS = thickness of section.
The determination of the Sertoli cell number per testis was carried out based on the corrected number of the Sertoli cell nucleolus per cross-section of seminiferous tubule at stage I and on the total length of seminiferous tubules per testis, and following the formula proposed by Hochereau-de Reviers and Lincoln (1978): Number of Sertoli or germ cells per testis = seminiferous tubules total length (μm) X corrected number of Sertoli cell per cross section/section width (μm). Based on this calculation, the Sertoli cells number per testis and per gram of testis was estimated.
The calculation of the daily sperm production (DSP) per testis, and per gram of testis (DSP/g/tesis) was performed according to França et al. (2000) using the following formula: PED = total number of Sertoli cells per testis x Sertoli cells’s index (SCI) x frequency of stage 1 (%)/duration of stage I (days), where, SCI stands for the number of round spermatids per Sertoli cell in stage I. The duration of stage I used was that obtained by França and Cardoso (1998). In order to compute the daily sperm production per gram of testis, the production was divided by the testis net weight. The results were expressed as number of spermatids/g of parenchyma/day and number of spermatids/testis/day x109.
The individual volume of the Leydig cells was investigated using a micrometric reticule square with 441 points (Olympus) coupled to an ocular with 10X magnification and a objective with 40X magnification (400X final magnification). The counts were performed using a BX51 Olympus optical microscope and a digital hemocytometric cell counter (Leucotron T-P). Three thousand points on the cytoplasm and nucleus of Leydig cells were verified per animal in order to determine the percent ratio between nucleus and cytoplasm. In another step, the average nuclear diameter (ND) of these cells was obtained with a linear reticule micrometer
(U-OCMSQ10/10, Olympus) coupled to an ocular with 10X magnification and a objective with 100X magnification (1000X final magnification). Thirty Leydig cells nucleuses from each animal were measured. The nucleuses measured were those presenting the profile as circular as possible and with evident perinuclear chromatin and nucleolus. Based upon the acquired data, the nuclear volume was calculated using the formula 4/3R³, where R is the nuclear radius, the cytoplasm volume (% cytoplasm x nuclear volume/% nucleus) and hence, the volume of each Leydig cell (nuclear volume + cytoplasmic volume) per animal. These values were expressed cubic micrometers (µm3) (França et al., 2000). With the volume of the Leydig cells, the volumetric proportion (%) of these cells in the testis and the total volume (mL) occupied by these cells in the testis, the number of Leydig cells per testis and per gram of testis was calculated for each animal.
A variance analysis scheme of a fully random experimental design was performed. Significant differences between averages were compared using the Tukey test (Sampaio, 1998).
RESULTS
The results assigned to the left testis length (LTL), right testis length (RTL), left testis width (LTW) and right testis width (RTW) from 38 to 210 days of age are depicted in Table 2. Among the experimental groups, values with statistically significant differences were found when the averages of length and width of testis at the different ages were compared. However, the testicular length was the biometric parameter that was mostly affected by the reduction of the protein levels in the diet.
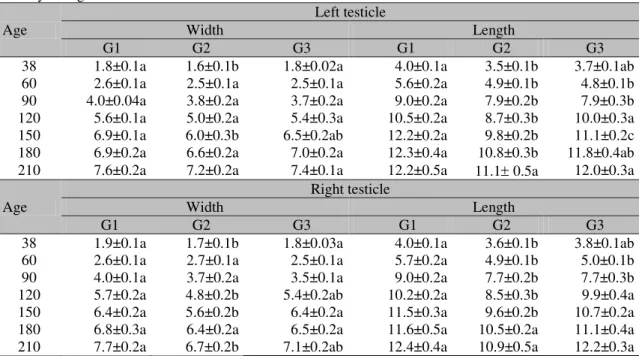
Table 2. Length and width (cm) (mean±SEM) of the right and left testicles of hybrid male pigs from 38 to 210 days of age
Age
Left testicle
Width Length
G1 G2 G3 G1 G2 G3 38 1.8±0.1a 1.6±0.1b 1.8±0.02a 4.0±0.1a 3.5±0.1b 3.7±0.1ab 60 2.6±0.1a 2.5±0.1a 2.5±0.1a 5.6±0.2a 4.9±0.1b 4.8±0.1b 90 4.0±0.04a 3.8±0.2a 3.7±0.2a 9.0±0.2a 7.9±0.2b 7.9±0.3b 120 5.6±0.1a 5.0±0.2a 5.4±0.3a 10.5±0.2a 8.7±0.3b 10.0±0.3a 150 6.9±0.1a 6.0±0.3b 6.5±0.2ab 12.2±0.2a 9.8±0.2b 11.1±0.2c 180 6.9±0.2a 6.6±0.2a 7.0±0.2a 12.3±0.4a 10.8±0.3b 11.8±0.4ab 210 7.6±0.2a 7.2±0.2a 7.4±0.1a 12.2±0.5a 11.1 0.5a 12.0±0.3a
Age
Right testicle
Width Length
G1 G2 G3 G1 G2 G3 38 1.9±0.1a 1.7±0.1b 1.8±0.03a 4.0±0.1a 3.6±0.1b 3.8±0.1ab 60 2.6±0.1a 2.7±0.1a 2.5±0.1a 5.7±0.2a 4.9±0.1b 5.0±0.1b 90 4.0±0.1a 3.7±0.2a 3.5±0.1a 9.0±0.2a 7.7±0.2b 7.7±0.3b 120 5.7±0.2a 4.8±0.2b 5.4±0.2ab 10.2±0.2a 8.5±0.3b 9.9±0.4a 150 6.4±0.2a 5.6±0.2b 6.4±0.2a 11.5±0.3a 9.6±0.2b 10.7±0.2a 180 6.8±0.3a 6.4±0.2a 6.5±0.2a 11.6±0.5a 10.5±0.2a 11.1±0.4a 210 7.7±0.2a 6.7±0.2b 7.1±0.2ab 12.4±0.4a 10.9±0.5a 12.2±0.3a G1 – Control diet (Rostagno et al., 2011); G2 – Reduction of 15%; G3 – Increase of 15% of PB. For the same age and variable (width and length), values followed by different lower case letters differ (P<0,005).
Data corresponding to values obtained for the tubular diameter, average volume of the testicular components and total length of the seminiferous tubules are presented in Table 3. In general, results corresponding to the testicular morphometry and histometry have not affected histomorphometric parameters of the testicular parenchyma of non-stag crossbreed male pigs at 210 days of age owing to different protein levels of diets. The tubular diameter dimensions showed uniformity in the average values found, ranging from 283.6m in G2 to 287.8m in G1. After qualitative histological evaluation of the testis, we did not observe structural changes that influenced the spermatogenesis in boars at 210 days of age.
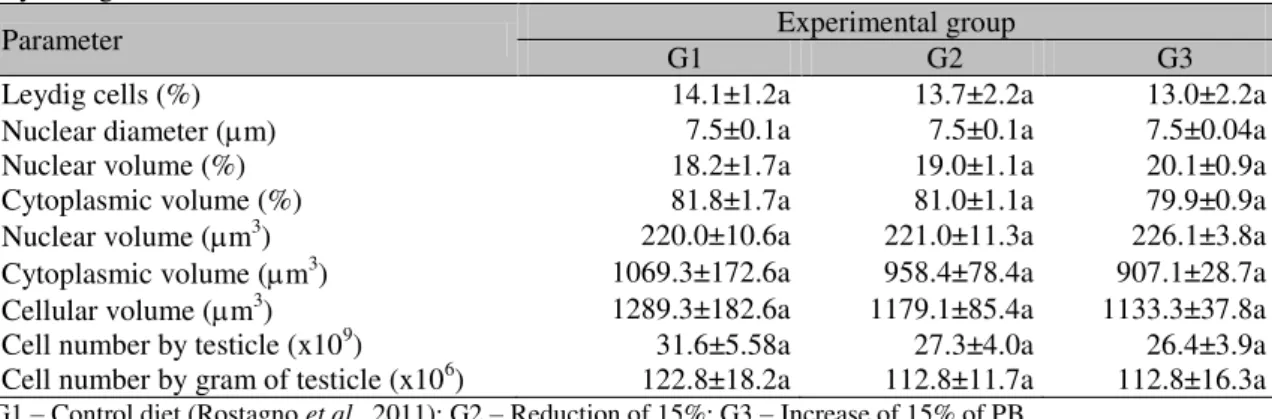
As for values found in the volumetric proportion of Leydig cells, different levels of the crude protein percentile in diets did not present significant influence on the number, volume and morphology of these cells in boars at 210 days of age in the different experimental groups (Table 4).
The maintenance of the spermatogenic process among the different experimental groups may be confirmed further through the results of the corrected number of cells per cross-section of seminiferous tubule as listed in Table 5, where no statistical variation between the different cell types was detected.
Table 3. Tubular diameter (m), seminiferous epithelium height (m), volume (mL) of testicle components and total length of seminiferous tubules in hybrid male pigs (mean±SEM) at 210 days of age
Parameter G1 Experimental group G2 G3
Tubular diameter (m) 287.8±10.4a 283.6±8.9a 285.9±14.1a Seminiferous epithelium height (µm) 97.8±3.0a 97.9±2.8a 94.4±4.1a Tubule seminiferous 205.1±9.9a 186.8±8.6a 190.3±7.2a
Lume 13.4±2.6a 12.5±2.0a 17.0±2.7a
Tunica propria 5.6±1.0a 5.5±0.5a 6.3±0.7a Leydig cells 37.7±4.5a 33.5±6.7a 30.5±5.0a Connective tissue 11.1±1.8a 10.7±3.4a 7.7±2.4a Blood vessels 2.0±1.0a 1.3±0.7a 1.1±0.5a Lymphatic space 1.3±0.4a 1.1±0.4a 1.4±0.4a Total lenght of seminiferous tubule (m) 3239.9±333.3a 2989.4±171.7a 3059.5±254.9a
Lume 13.4±2.6a 12.5±2.0a 17.0±2.7a
Tunica propria 5.6±1.0a 5.5±0.5a 6.3±0.7a Leydig cells 37.7±4.5a 33.5±6.7a 30.5±5.0a Connective tissue 11.1±1.8a 10.7±3.4a 7.7±2.4a G1 – Control diet (Rostagno et al., 2011); G2 – Reduction of 15%; G3 – Increase of 15% of PB.
Table 4. Morphometric parameters and Leydig cell population (mean±SEM) in hybrid male pigs at 210 days of age
Parameter G1 Experimental group G2 G3 Leydig cells (%) 14.1±1.2a 13.7±2.2a 13.0±2.2a Nuclear diameter (m) 7.5±0.1a 7.5±0.1a 7.5±0.04a Nuclear volume (%) 18.2±1.7a 19.0±1.1a 20.1±0.9a Cytoplasmic volume (%) 81.8±1.7a 81.0±1.1a 79.9±0.9a Nuclear volume (m3) 220.0±10.6a 221.0±11.3a 226.1±3.8a Cytoplasmic volume (m3) 1069.3±172.6a 958.4±78.4a 907.1±28.7a Cellular volume (m3) 1289.3±182.6a 1179.1±85.4a 1133.3±37.8a Cell number by testicle (x109) 31.6±5.58a 27.3±4.0a 26.4±3.9a Cell number by gram of testicle (x106) 122.8±18.2a 112.8±11.7a 112.8±16.3a G1 – Control diet (Rostagno et al., 2011); G2 – Reduction of 15%; G3 – Increase of 15% of PB.
Table 5. Corrected number of cells by cross section of seminiferous tubule (mean±SEM) in stage I of the epithelium seminiferous cycle in hybrid male pigs at 210 days
Table 6. Ratio between corrected numbers of spermatogenic cells and between spermatogenic and Sertoli cells by cross section of seminiferous tubule (mean±SEM) in stage I of the epithelium seminiferous cycle in hybrid male pigs at 210 days of age
Cellular reason G1 Experimental group G2 G3
A : Pl/L 50.97±2.8a 26.82±4.6a 24.4±3.8a
A : Ar 103.10±8.2a 91.02±12.7a 85.8±6.9a
P : Ar 2.90±0.2a 3.05±2.9a 3.0±0.1a
CS : Ar 12.20±1.2a 11.06±1.0a 10.2±0.9a
CS : CG 21.00±1.9a 18.39±1.5a 17.3±1.6a
A = Spermatogonia; Pl/L = Spermatocytes I in pre-leptotene/leptotene; P = Spermatocyte I in pachytene; Ar = Round spermatids; C.S. = Sertoli cells; C.G. = Total of germinative cells. Differences among treatment were not significant. G1 – Control diet (Rostagno et al., 2011); G2 – Reduction of 15%; G3 – Increase of 15% of PB.
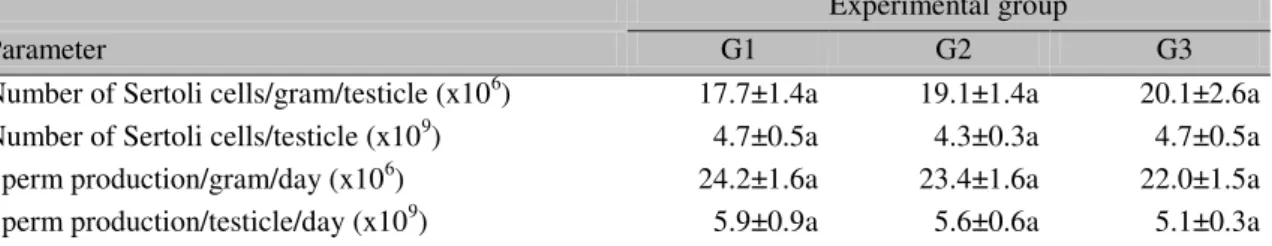
Table 7. Sertoli cell population and daily sperm production per testicle and per gram of testicle (mean±SEM) in hybrid male pigs at 210 days of age
Experimental group
Parameter G1 G2 G3
Number of Sertoli cells/gram/testicle (x106) 17.7±1.4a 19.1±1.4a 20.1±2.6a Number of Sertoli cells/testicle (x109) 4.7±0.5a 4.3±0.3a 4.7±0.5a Sperm production/gram/day (x106) 24.2±1.6a 23.4±1.6a 22.0±1.5a Sperm production/testicle/day (x109) 5.9±0.9a 5.6±0.6a 5.1±0.3a G1 – Control diet (Rostagno et al., 2011); G2 – Reduction of 15%; G3 – Increase of 15% of PB.
DISCUSSION
According to Amann (1962), there is a strong correlation between testicular weight and daily sperm production in male pigs, which can be determined both through the hemocytometric and histometric methods. Therefore, according to results, it was possible to observe that the different protein levels in the diet did not influence the determination of the net testicular weight. Thus, protein levels in the diet did not influence data corresponding to daily sperm production per testis in the present experiment.
The average diameter of the seminiferous tubules and the average height of the seminiferous epithelium in boars are directly related to the testis spermatogenic activity (França and Russell, 1998). In male pigs, the tubular diameter may range from 133 to 287µm (Okwun et al., 1996). In Piau adult pigs, França and Cardoso (1998) found average values for the tubular diameter of approximately 215.5m, while Allrich et al. (1983) found values between 240 and 270m in Landrace adult pigs. The differences found in these measurements may arise from the linear retraction as a result of the type of histological processing (França and Russell, 1998) as well as
from differences related to age, genetic characteristics, and management and nutrition conditions of these males.
The total length of seminiferous tubules is an important testicular histometric parameter directly related to testicular weight, tubular diameter and volumetric density of the seminiferous tubules (França and Russell, 1998). In pigs, these values may range from 2674 to 3130 meters (Okwun et al., 1996). The total lengths of seminiferous tubules in the present experiment are within standard values for the species indicating that the reduction of 15% on the protein levels in diet from the 28th postbirth day on did not harm this testicular parameter.
The Leydig cells are present in the testis interstitial tissue close to seminiferous tubules or vessels, giving rise to a volumetric percentage from 10 to 15% of the testicular parenchyma in adult pigs (Silva Junior, 2003). At the 210th postnatal day, Piau pigs present 11.9% of the testicular parenchyma constituted by Leydig cells (França et al., 2000). In the present experiment, the volumetric proportion of Leydig cells ranged from 13 to 14% between experimental groups, which is in agreement with standard values for the species at the respective age. Furthermore, in the present experiment no differences were noticed related to volume, population per gram of testis and per testis of Leydig cells between groups. These cells have their testosterone secretory capacity related to volume and number per testis (Silva Junior, 2000).
Considering that the number of round spermatids is inversely related to the degree of failures occurring during spermatogenesis and that the Sertoli cell index is directly related to sperm production capacity (Berndtson and Picket, 1987), one may infer that for the experimental groups investigated, the different protein levels in diets between the 28th and 210th days of age did not influence the cell population in stage I of the seminiferous epithelium cycle and the spermatogenic process efficiency. Moreover, parameters related to the efficiency of these processes are in agreement with data associated to the species (Godinho and Cardoso, 1979; França, 1991). Therefore, it is possible to conclude that the protein levels employed in diets have supplied the minimum needs required by males for normal testicular development and performance of the reproductive characteristics evaluated.
Donzele et al. (1998) used 12 to 18% protein levels in diets with body development ranging from 60 to 100kg in Landrace pigs and observed a quadratic behavior on the number of Sertoli cells per transversal section of seminiferous tubule, which reached values as high as 14.4% crude protein in the diet. Round spermatids and Sertoli cell indexes increased linearly with the protein levels in ration. Dickerson et al. (1964) conducted experiments in non-gelded male pigs from 3 weeks to 1 year of age, maintained in undernourishment conditions and found that this provokes severe damage to the germinative epithelium cellular proliferation. According to those authors, the negative effects on the germinative cells may have occurred as a result of the reduction on the cytoplasm of the interstitial cells in pigs from 1 month of age and their complete disappearance at 3 months of age.
In the present experiment, the protein content variation between the 38th and 210th postnatal day did not substantially affect the testicular parameters such as daily sperm production and Sertoli cell population (Table 7). In adult individuals, the daily sperm production has a close relation to the Sertoli cell support capacity and population of this cell type (Silva Junior et al., 2006).
In pigs, the Sertoli cell population settles in within the first four postnatal months. Two proliferation phases of these cells occur during this period. The first occurs between birth and the 1st month of life, when the number of Sertoli cells increases approximately 6 times. The second occurs within the 3rd and 4th months of age, and in which the population of these cells almost doubles in the testis (França et al., 2000).
During the initial Sertoli cell proliferation period, males were fed diets containing protein levels within standards regularly used for piglets after weaning. This fact probably did not cause any effect on the evaluation of the number of Sertoli cells per testis and hence on the spermatogenic potential of males used in the present study.
CONCLUSIONS
Although the protein levels below or above the recommended levels has reduced the width of testis in most ages studied, this reduction did not influence the reproductive characteristics of the animals. The magnitude of the variation in protein levels used in the different development phases was not sufficient to promote significant alterations on testicular development and spermatogenic process in adult animals.
ACKNOWLEDGEMENTS
CNPq for providing scholarships.
REFERENCES
ALLRICH, R.D.; CHRISTENSON, R.K.; FORD, J.J. et al. Pubertal development of the boar: age-related changes in testicular morphology and in vitro production of testosterone and estradiol-17β1,2.
Biol. Reprod., v.28, p.902-909, 1983.
ALTHEN, T.G.; GERRITS, R.J.; YOUNG, E.P. Pituitary gonadotropins in boars as affected by dietary protein and age. J. Anim. Sci., v.39, p.601-605, 1974.
AMANN, R.P. Reproductive capacity of dairy bulls. III. The effect of ejaculation frequency, unilateral vasectomy and age on spermatogenesis. Am.J. Anat., v.110, p.49-67, 1962.
BERNDTSON, W.E.; PICKET, B.W. Relationship of absolute numbers of Sertoli cells to testicular size and spermotogenesis in young beef bulls. J. Anim. Sci., v.64, p.241-246, 1987.
DICKERSON, J.W.T.; GRESHAM, G.A.; McCANCE, R.A. The effect of undernutrition and rehabilitation on the development of the reproductive organs: pigs. J. Endocrinol., v.29, p.111-118, 1964.
DONZELE, L.J.; OLIVEIRA, R.F.M.; FONTES, D.O. et al. Níveis de lisina para suínos machos inteiros dos 60 aos 100 kg. Rev. Bras. Zootec., v.27, p.117-122, 1998.
DORST, J.; SAJONSKY, H. Zur quantitat der gewebskomponenten des Schweinehodens wahrend der postnatalen Entwicklung. Monatsh. Vet. Med., v.29, p. 904-906, 1974.
FRANÇA, L.R. Análise morfofuncional da espermatogênese de suínos adultos da raça Piau. 1991. 65f. Tese (Doutorado) Escola de Veterinária, Universidade Federal de Minas Gerais, Belo Horizonte, 1991.
FRANÇA, L.R.; CARDOSO, F.M. Duration of spermatogenesis and sperm transit time trough the epididymis in the Piau boars. Tissue Cell., v.30, p.573-582, 1998.
FRANÇA, L.R.; RUSSELL, L.D. The testis of domestic mammals. In: REGADERA, J.; MARTINEZ-GARCIA, F. (Ed). Male reproduction. Madrid: Churchill Livingstone, 1998. p.197-219.
FRANÇA, L.R.; SILVA Jr., V.A.S.; CHIARINE-GARCIA, H. et al. Cell proliferation and hormonal changes during postnatal development. Biol. Reprod., v.63, p.1629-1636, 2000.
GODINHO, H.P.; CARDOSO, F.M. Desenvolvimento sexual de porcos Yorkshire. I. Estabelecimento e evolução da espermatogênese. Arq. Esc. Med. Vet. Zootec., v.31, p.351-361, 1979.
HOCHEREAU-DE REVIERS, M.T.; LINCOLN, G.A. Seasonal variation in the histology of the testis of the red deer, Cervus elaphus. J. Reprod. Fertil., v.54, p.209-213, 1978.
KEMP, B.; VERSTEGEN, M.W.A. Nutrition and sperm production. Reprod. Dom. Anim., v.1, p.287-296, 1991.
KUNAVONGKRIT, A.; SURIYASOMBOON, A.; LUNDEHEIM, N. et al. Management and sperm production of boars under differing environmental conditions. Theriogenology, v.63, p.657-667, 2005. MARIN-GUZMAN, J.; MAHAN, D.C.; PATE, J.L. Effect of dietary selenium and vitamin E on spermatogenic development in boars. J. Anim. Sci., v.78, p.1537-1543, 2000.
ROSTAGNO, H.S.; ALBINO, L.F.T.; DONZELE, J.L. et al. Tabelas brasileiras para aves e suínos: composição de alimentos e exigências nutricionais. 3.ed. Viçosa, MG: Imprensa Universitária, 2011. 252p.
SAMPAIO, I.B.M. Estatística aplicada à experimentação animal. Belo Horizonte: Fundação de Ensino e Pesquisa em Medicina Veterinária e Zootecnia, 1998. 221p.
SILVA JÚNIOR, V.A. Efeitos de indução do hipotireoidismo e hipertireoidismo pós-natal na proliferação das células de Sertoli e na função testicular em suínos. 2000. 191f. Tese (Doutorado) Escola de Veterinária, Universidade Federal de Minas Gerais, Belo Horizonte, 2003.