This is an Open Access article distributed under the terms of the Creative Commons Attribution Non-Commercial License Received: 12 Nov., 2017
Accepted: 22 May, 2018
E-mail: [email protected] (FRC)
Abstract: Automotive industries are trying to use new light materials for structural parts of vehicles. However, the steels are being the best manufacturing material option in the automotive industry. One of the advanced steels commonly used due to the high mechanical properties is the Dual Phase Steel (Ferritic-Martensitic). Therefore, the welding process is still very important and a matter of improvement. The present work shows the design of an experimental matrix using the Taguchi method with the optimal parameters to apply in the spot welding process (RSW) of a DP-290 steel; the metallographic characterization, the microhardness and the Peel tests were also carried out in each specimen. The results determined that the lower intensity of current and a medium pressure for a longer time the better resistance to tearing, due to the microstructural changes in the specimens.
Key-words: Dual phase steel; RSW; Ferritic-martensitic microstructure; Mechanical resistance improvement.
Optimización de los Parámetros: Fuerza (F), Tiempo (t) e Intensidad de
Corriente (I), en el Proceso de Soldadura RSW de Chapas de Acero DP-290
Empleando el Método de Taguchi
Resumen: Las industrias automotrices están tratando de emplear nuevos materiales ligeros para elementos estructurales de los vehículos. Sin embargo, los aceros continúan siendo la mejor opción para la manufactura en la industria automotriz. Uno de los aceros avanzados comúnmente usado por sus buenas propiedades mecánicas es el acero Doble Fase (Ferrita-Martensita). Por tal motivo, el proceso de soldadura empleado es muy importante y sigue siendo motivo de mejora continua. El presente trabajo muestra el diseño de una matriz experimental empleando el método de Taguchi con los parámetros óptimos para ser aplicados en el proceso de soldadura de puntos por Resistencia (RSW) de un acero DP-290; en cada probeta se realizó la caracterización metalográfica, la microdureza y los ensayos de desgarre. Los resultados obtenidos determinaron que una menor intensidad de corriente y una presión moderada junto con mayores tiempos de soldeo producen una mejor resistencia al desgarre, debido a los cambios microestructurales de las probetas.
Palabras clave: Acero doble fase; RSW; Microestructura ferrítica-martensítica; Mejora de la resistencia mecánica.
1. Introduction
The assembling of metallic pieces to the manufacturing of automotive vehicles requires the resistance spot welding process (RSW) to join them. These assembles are part of the chassis and some other important structural elements of the vehicle. The advanced high strength steels (AHSS) are used as part of the vehicle, which combine strength and ductility through the phase transformation induced by deformation and solid solution hardening, resulting in a good strength-weight relationship. The Dual Phase (DP) steel is one of the most common AHSS used in the industry due to its good formability with Tecnológico Nacional de México, Instituto Tecnológico de Morelia, Maestría en Ciencias en Metalurgia, Morelia, Michoacán,
México.
3 Tecnológico Nacional de México, Instituto Tecnológico de Morelia, Departamento de Metalmecánica, Morelia, Michoacán,
During the joining in RSW process, metal coalescence occurs on the contact surface due to the heat generated at the joint produced by the resistance to the flow of an electric current (I). The contact between the surfaces occurs when a force (F) is applied during and after the flow of the current, which in turn produces the forging of the weld metal. The process is completed within a specific time cycle (t) [2]. These parameters involved in the RSW process affect the final quality of the welded joint, as demonstrated in the work carried out by Zhang et al. [3] where spot welding of AHSS steels is greatly influenced by the strength of the electrode; therefore, the optimization of the welding process by resistance points for a DP-290 steel was carried out by predicting the welding parameters as accurately as possible, without consuming long periods of time, materials and effort in an excessive way through the implementation of the Taguchi’s methodology.
The Taguchi’s method has been widely used in recent decades to optimize the quality and reliability of the manufacture of materials or finished products through the optimization of input parameters to the process [4]. The technique uses a design of orthogonal matrices to identify the optimal configuration of the parameters, which is insensitive to the variation and the effects caused by noise in the process [4]. The method reduces significantly the number of experiments required with parameters involved and identifying with certainty the statistical importance of those parameters on the quality of the resulting weld [5]. In the analysis, the Signal/Noise ratio (S/N) is used to judge quality in three different ways: lower is better, higher is better and nominal is better depending on the need for response to be seek. In the research work of Esme Ugur [6] optimization of the parameters of the RSW process for SAE 1010 steel was studied using the Taguchi method. The results showed that the increase in the welding current and the applied force are fundamental factors controlling the mechanical resistance in the joint, concluding that the Taguchi method is effective in the optimization of the welding parameters.
Eisazadeh et al. [7] determined that the quality of welding is controlled by the nugget of welding, and similarly, Thakur et al [2] states that the best way to judge the RSW quality is by the size of the nugget, the Heat Affected Zone and the strength of the joint; additionally, the destructive Peel test was used with a variant that is not commonly implemented in this test.
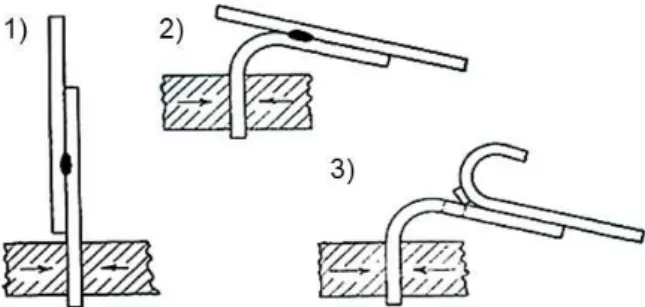
In the common Peel test (Figure 1) the objective is to destroy the specimen in such way that the quality of the joint could be verified qualitatively. The criteria are to identify where the tear occurs and to deduce whether the base metal was affected by the welding process, or if it occurs in the nugget (joint of low quality). As a variant of the Peel test, a universal machine was used to apply and quantify the tensile force (F) required to tear the nugget. The quantified force (F) was used as a response to the Taguchi method and measure the quality of the welded joint.
Figure 1. Steps to carry out the Peel test: (1) Hold of the specimen; (2) Bend of the specimen; and (3) Tear of the specimen.
2. Materials and Methods
2.1. The RSW welding equipment
time for further analysis. The used caps were dome-shaped tip, offering a closer approach to the flat work surface. The nominal chemical composition is Cr-0.8%wt. and Cu, with excellent mechanical properties, used to weld low carbon steels, even cold and hot rolled.
2.2. Base material as supplied-condition
The steel plates used in the study were of DP-290 steel and three clusters of 10 mm x 10 mm x 1.3 mm were enabled. These samples were prepared to be characterized by Optical Microscopy (MO) and Electronic Scanning Microscopy (SEM) in as supplied condition. An optical microscope OPTIKA model M-789 was used and the specimens were etched with Nital-4 by immersion for ten seconds based on the ASTM E407 standard [8]. To complement the DP-290 steel analysis as supplied conditions, a JEOL model JSM-6400 scanning electron microscope was also used. The SEM uses an electron beam instead of light as a conventional microscope does. The technique involves the projection of electrons accelerated through the vacuum and condensed by an electric field, the beam is deflected on a point by electromagnetic coils, so they perform a sweep in the area to be studied, when the beam hits the sample, secondary electrons, X-rays and elastic electrons are generated.
The hardness values were obtained by using the Rockwell A scale with a load of 60 kg in a Wolpert equipment model D-6700 Ludwigshafen/Rhein. Then, 15 indentations were made in the sample to obtain an average value of the Rockwell-A hardness.
2.3. The Taguchi’s methodology
To optimize the number of possible combinations between the variation of the current intensity (I), force (F) and time (t) parameters in the RSW process, an orthogonal L25 design was used following the steps of the Taguchi method, which allows to use a synthesized quantity of experiments taken from the original matrix (number of possible combinations). Taguchi method ensures that the results obtained by the tests or experiments are concise without rejecting their variability [9]. Therefore, the method provides a robust design by analyzing the set of conditions and their interactions of the parameters of the known process.
In addition, the method establishes the design factors that can be controlled, looking the best level to operate the parameters in the experimentation with the samples for the RSW through the analysis of the S/N ratio. The optimal factors are shown in Table 1 with their respective levels. Most of the research works normally use a maximum of four factors and choose five levels. It is possible to use a greater number of factors and levels for better accuracy, but it increases and complex the data analysis.
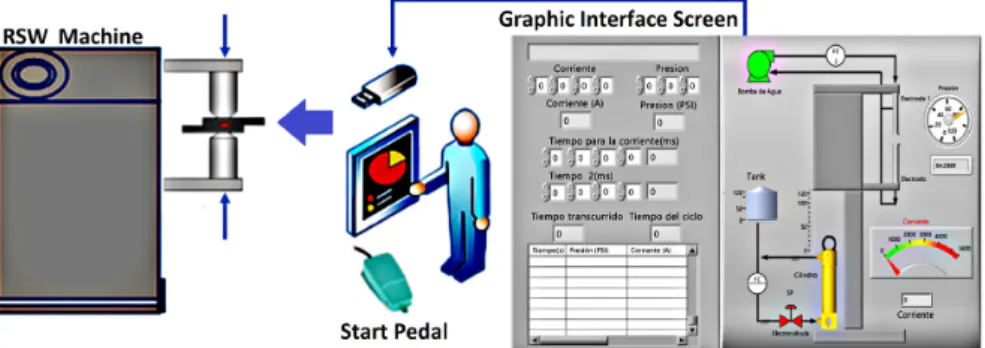
Figure 2. General diagram of the experimental set up and graphical interface.
Table 1. Factors and variations in the generation of the experimental matrix performed.
Level Pressure
(MPa) Current Intensity (A) Time (ms)
1 0.69 3,500 1,600
2 0.72 4,000 1,650
3 0.76 4,500 1,700
4 0.79 5,000 1,750
The orthogonal array or design matrix L25 was defined (as shown in Table 2) for the RSW process performed. The quantitative factors of the orthogonal arrangement are treated as qualitative by coding the levels.
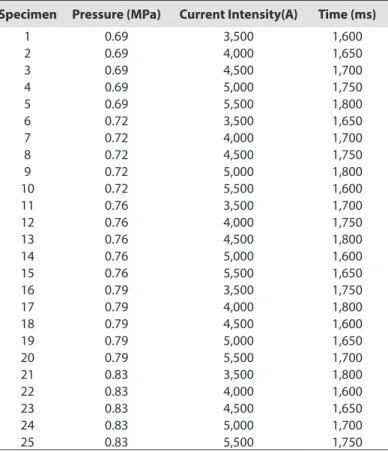
Table 2. Orthogonal design L25 used in the experiment.
Specimen Pressure (MPa) Current Intensity(A) Time (ms)
1 0.69 3,500 1,600
2 0.69 4,000 1,650
3 0.69 4,500 1,700
4 0.69 5,000 1,750
5 0.69 5,500 1,800
6 0.72 3,500 1,650
7 0.72 4,000 1,700
8 0.72 4,500 1,750
9 0.72 5,000 1,800
10 0.72 5,500 1,600
11 0.76 3,500 1,700
12 0.76 4,000 1,750
13 0.76 4,500 1,800
14 0.76 5,000 1,600
15 0.76 5,500 1,650
16 0.79 3,500 1,750
17 0.79 4,000 1,800
18 0.79 4,500 1,600
19 0.79 5,000 1,650
20 0.79 5,500 1,700
21 0.83 3,500 1,800
22 0.83 4,000 1,600
23 0.83 4,500 1,650
24 0.83 5,000 1,700
25 0.83 5,500 1,750
The results of the maximum resistance to tearing of each specimen are used as a response variable for the optimization of the process parameters, using the case larger is better of the Taguchi method. For the larger is better, Equation 1 [10] is used:
log 2 n i y 1 1 10 1 N
η= − ∑ = (1)
The use of the logarithm makes the response as linear as possible, while the negative sign is to maximize the S/N ratio. It is multiplied by 10 to get the product in decibels. This will result in the combination of the welding parameters (F, I, t), and the highest strength in the welded joint will be achieved. To complement the Taguchi’s methodology it is necessary to use the Analysis of Variance (ANOVA) technique, which allows to identify the parameters with significant effect on the quality of the weld nugget.
2.4. RSW welding process and the Peel test of the welded nugget
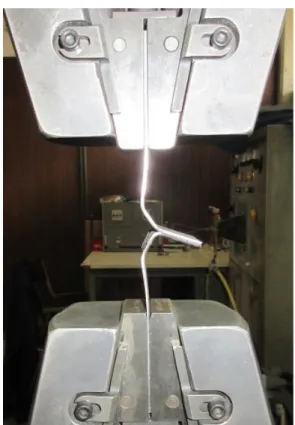
For the morphological analysis of the microstructure present in different areas of the nugget, the analysis via optical microscopy was used to take the corresponding images. On the other hand, the Peel test and its required tear force (F) was measured by an INSTRON universal model 1195R machine. Figure 3 shows the preparation of the specimens for the Peel test, so that the force (F) can be quantified before the nugget is separated by tearing. The ASTM D1876 [11] standard was implemented at a speed of 15 mm/min by using a 10 t load cell.
3. Results and Discussion
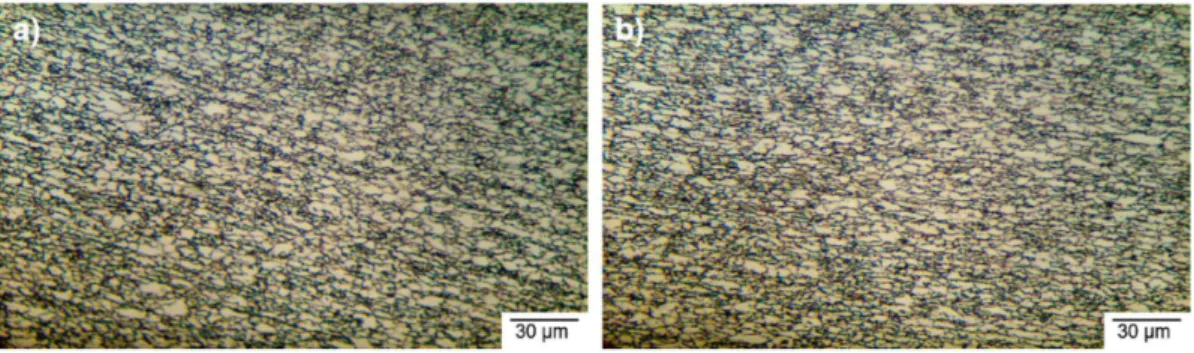
Figure 5 shows that the base material has fine and elongated grains due to the remnant heat rolling effect, characteristic on DP steels. The clear areas are composed by the ferritic matrix and islands of martensite are distinguished (dark areas) in the grain boundaries. To have a better certainty about the morphology of the present phases in DP steels, some micrographs were obtained with the SEM at 4000x.
In the micrograph of Figure 6, the ferritic phase can be identified as the gray color zone with flat and continuous morphology; and the martensite can be seen in the ferritic grain boundaries with a different morphology. The image also shows small and bright particles, which can be some kind of carbide.
The hardness scan of the DP-290 steels as supplied condition was carried out on the HRA scale. The results are shown in Figure 7, where a homogenous hardness distribution with an average value of 54 HRA is observed.
The RWS process was carried out using the variation of the parameters established in the orthogonal arrangement considered adequate by the Taguchi’s methodology. Subsequently, the Peel test was performed on
Figure 3. Placement of the specimens to perform the Peel test.
Figure 5. DP-290 steel micrograph of the: (a) transversal area; and (b) longitudinal area.
Figure 6. Grain morphology of DP-290 steel obtained by SEM at 4000x.
Figure 7. Average results of the hardness test in DP-290 steel in as supplied condition.
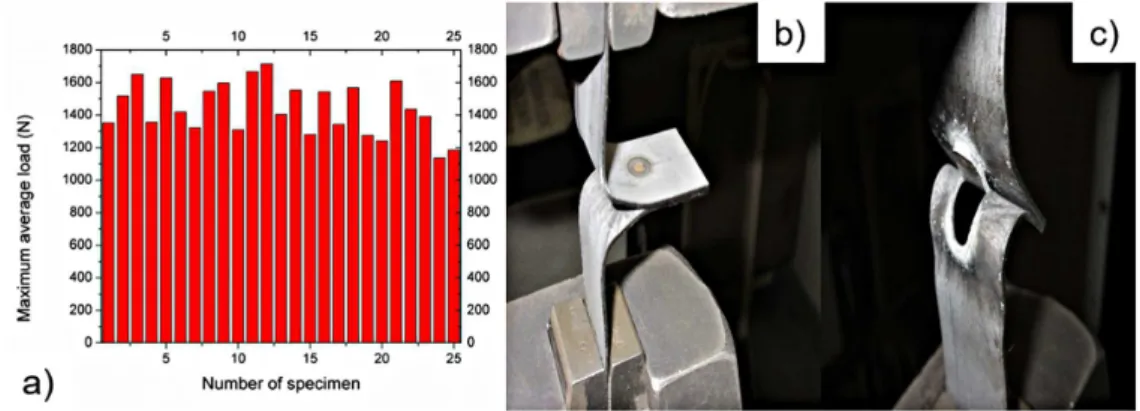
The results of samples 3 and 11 showed the highest load values of tear resistance. The results of sample 12 was discarded despite to have high resistance due to some visible defects in the weld nugget. Figure 9a shows the tear that occurred in specimen 3, which supported a maximum load (F) of 1,647 N. For this specimen, the joint was carried out with a current intensity (I) of 4.5 kA, a pressure of 0.69 MPa and a time (t) of 1,700 ms. The tear was located in the grain coarsened area of the heat affected zone (HAZ), which represents a normal behavior due to lower hardness due to the decrease of percentage of martensite. In Figure 10, the area between the sections (c) and (e) it is distinguished a tight heat affected zone (HAZ), but it showed impoverished mechanical properties compared to the fusion zone.
Figure 8. Results of the Peel test: (a) Maximum load measured; (b) Start of the Peel test; and (c) Tear of the weld joint.
Figure 9. Experimental results of the specimen 3: (a) Tested sample by peel method with tear in the welded nugget; and (b) Graph Load(N) vs. Elongation (mm), of the test specimen.
The specimen 11 stand a maximum load of 1,665 N, this is the maximum resistance to tearing effect obtained in the present research project, as shown in Figure 11b. The specimen was welded with a current intensity (I) of 3.5 kA, a pressure of 0.76 MPa and a time (t) of 1,700 ms. The fracture shown in Figure 11a, is located in the HAZ, even when it has a smaller HAZ length than the HAZ length of specimen 3.
Figure 11. Experimental results of the specimen 11: (a) Tested sample by peel method with tear in the welded nugget; and (b) Graph Load(N) vs. Elongation (mm), of the test specimen.
The specimen 3 hold out a lower load than the specimen 11. This was due to the the specimen 3 had a larger HAZ length (2.79 mm) than the HAZ of the specimen 11 (2.55 mm). The difference in the HAZ length can be seen in Figures 13 and 10, particularly between the zones (c) and (e). The difference was produced by the intensity of current (I) applied to the specimens, with the greater one implemented in specimen 3 causing a greater contribution of heat input (HI) to the process. Figure 12 shows the region affected by the contribution of heat around the nugget, highlighting more HAZ in the nugget of the specimen 3. On the other hand, when graphs of Figures 9b and 11b are compared, it is distinguished that the HAZ elongation occurred in the specimen 11 related to having a lower HAZ length and apparent uniform HAZ temperature distribution of welded nugget.
Figure 12. Weld nuggets and their Heat Affected Zones of specimen 3 and specimen 11.
Figures 10 and 13 show the microstructural changes occurred in the nuggets of specimens 3 and 11, divided into several areas of importance. Each literal marks a weld zone based on the following classification: a) Fusion zone (FZ); b) Coarsed-grain zone (CG-HAZ); c) Fine-grain zone (FG-HAZ); d) Intercritical zone (IZ-HAZ); e) Subcritical zone (SZ-HAZ); and e) Base metal (BM). Columnar grains oriented to the extraction of heat produced by the cooled copper electrodes are presented in both specimens 3 and 11, Figures 10a and 13a. The cap-plate surface contact produces a fast cooling which results in the formation of martensite, acicular ferrite and Widmanstatten ferrite.
this area has a lower hardness to the of the ZF. Passing from zone (c) to zone (d) it is noted that the martensite is finest because less heat was generated in that part during the welding process.
Analyzing the area (b) of both Figures 10 and 13 can be observed a grain growth due to the high temperature level reached in the FZ. However, the Figure 13 shows a better defined metallographic structure of weld nugget, while Figure 10c shows a little disproportionate weld nugget area, because it was applied a higher current intensity (I).
In Figure 13d a microstructure with ferritic and martensitic phases is shown with the difference that the grains are finer than of those of Figure 10d.
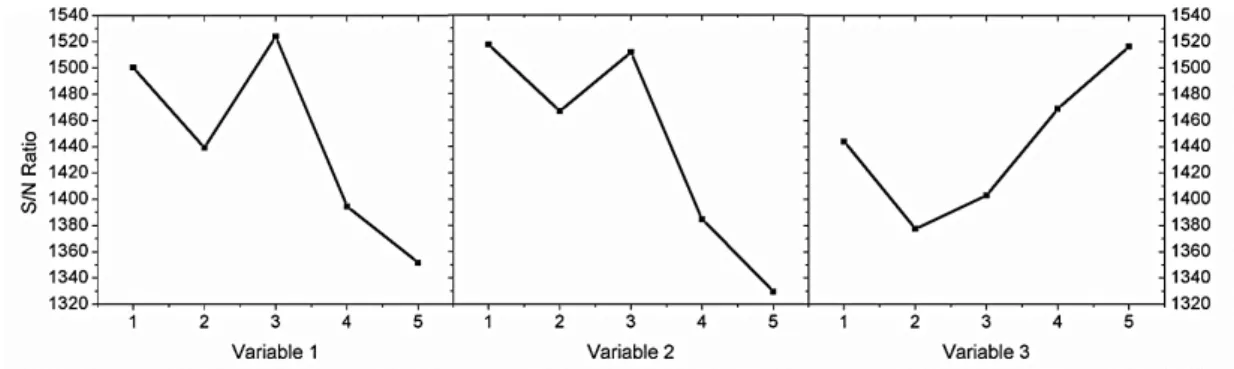
The stack of data of the maximum load (F) resisted for each specimen were recorded, the optimization of the parameters of the process was carried out using the Taguchi method by computational software that indicated an optimal configuration according to the Equation 1 for S/N ratio. It is shown in Figure 14 that the optimal conditions are given by level 3 of variable 1, level 1 of variable 2 and level 5 of variable 3, these are the parameters of the welding process that are statistically significant. Analyzing the orthogonal arrangement is observed that the optimal conditions are: 0.75 MPa of pressure, 3.5 kA of current and 1,800 ms of welding time, these values are close to the parameters used for the specimen 11, which effectively gave the highest value of resistance to tearing without showing some defect.
Figure 13. Macrostructure at 20X and microstructures at 500x of diverse zones of the weld nugget corresponding to the specimen 11: (a) FZ; (b) CG-HAZ; (c) FG-HAZ; (d) IZ-HAZ; (e) SCZ-HAZ; and (f) BM.
Figure 14. Graphical estimation to select the optimal RSW welding parameters (for a maximum peel resistance).
The microhardness profiles (Vickers) performed to the specimens 3 and 11 in as-welded conditions are presented in Figure 15, following the scheme presented in Figure 4 which shows a measure diagonally through the weld nugget.
Table 3. Analysis of variance (ANOVA) applied to the welding parameters.
Factor Degrees of
freedom Level
Sum of
squares Square medium F Contribution (%)
Force (F) 4 5 SSA 3.90 SCA 398523.63 0.0003531 33.82
Intensity (I) 4 5 SSB 5.39 SCB 398528.09 0.0004872 46.67
Time (t) 4 5 SSC 2.25 SCC 398518.66 0.0002036 19.50
SST 11.55
Figure 15. Vickers microhardness profiles of specimen 3 (dashed line) and to the specimen 11 (solid line).
The highest hardness value is found into the FZ of the specimens analyzed, obtaining an average value of 395 HV for the specimen 11. This is due to the high content of alloying elements present in DP steel, and the high cooling speed provided by the cooled caps. The FZ presents a hardness with an approximate value of twice the hardness presented in the BM, the hardness value is achieved by the concentration of martensite. The HAZ presents a decrease in hardness because the percentage of ferrite increases with a grain refinement in that area, suggesting that the hardness would be higher; however, the segregation of the alloying elements towards the center of the nugget leaves the HAZ impoverished, therefore its hardness is lower. Near the base metal is the subcritical zone, which is a tempering zone where the original martensite presented in the DP steels undergoes a partial decomposition due to the effect of temperature, producing a decrease of hardness value, recovering to the base metal without tempering. The graph of Figure 15 shows asymmetry in the microhardness record of the HAZ for both samples analyzed; in Figures 10 and 13 can be found that the HAZ does not have the same extension or the same structural changes in the left zone of the nuggets compared with the right zone. A finer grain is found on the left side of both specimens and on the right side of the image there is no evident transition marked as in the microstructure on the left side. Other reason why the anomaly may occur is due to the type of electrode used in the experimentation or the clamping of the specimens.
4. Conclusions
1. The proper control of the RSW parameters result in different microstructures, which are related to mechanical properties presented in the RSW nugget;
Authors want to thanks to the Tecnológico Nacional de Mexico for the financial support provided for the project 5590.15-P, included in the “Convocatoria de apoyo a la Investigación Científica y Tecnológica 2015”. A special thanks to the Tecnológico Nacional de México/Instituto Tecnológico de Morelia and the PhD program (Doctorado en Ciencias en Ingeniería) for the support and facilities to use their infrastructure, laboratories and equipment. And no less important, to the Division de Estudios Profesionales y de Investigación del TNM/ITM department.
References
[1] Zhang H, Qiu X, Bai Y, Xing F, Yu H, Shi Y. Resistance spot welding macro characteristics of the dissimilar thickness dual phase steels. Materials & Design. 2014;63:151-158. http://dx.doi. org/10.1016/j.matdes.2014.05.060.
[2] Thakur AG, Rao T, Mukhedkar MS, Nandedkar VM. Application of
Taguchi method for resistance spot welding of galvanized steel. Journal of Engineering and Applied Sciences. 2010;5(11):22-26.
[3] Zhang X, Chen G, Zhang Y, Lai X. Improvement of resistance
spot weldability for dual-phase (DP600) steels using servo gun. Journal of Materials Processing Technology. 2009;209(5):2671-2675. http://dx.doi.org/10.1016/j.jmatprotec.2008.06.008.
[4] Campanelli LC, Suhuddin UFH, Santos JF, Alcântara NG. Parameters
optimization for friction spot welding of AZ31 magnesium alloy by Taguchi method. Soldagem e Inspeção. 2012;17(1):26-31. http://dx.doi.org/10.1590/S0104-92242012000100005.
[5] Montgomery DC. Design and analysis of experiments. New
Jersey: John Wiley & Sons; 2017.
[6] Eşme U. Application of Taguchi method for the optimization of
resistance spot welding process. Arabian Journal for Science and Engineering. 2009;34(2):519.
[7] Eisazadeh H, Hamedi M, Halvaee A. New parametric study
of nugget size in resistance spot welding process using finite
element method. Materials & Design. 2010;31(1):149-157. http://dx.doi.org/10.1016/j.matdes.2009.06.042.
[8] American Society for Testing and Materials. ASTM E407: standard practice for microetching metals and alloys. West Conshohocken: ASTM; 2007.
[9] American Society for Testing and Materials. ASTM E384-11: standard test method for knoop and vickers hardness of materials. West Conshohocken: ASTM; 2011.
[10] Pandey AK, Khan MI, Moeed KM. Optimization of resistance spot welding parameters using Taguchi method. International Journal of Engineering Science and Technology. 2013;5(2):234-241.
[11] American Society for Testing and Materials. ASTM D1876: standard test method for peel resistance of adhesives (T-peel test). West Conshohocken: ASTM; 2015. p. 105-107.
[12] Lienert TJ, Babu SS, Siewert TA, Acoff VL. Welding fundamentals and processes. Materials Park: ASM International; 2011. (ASM Handbook; 6A).