Inês Tadeu dos Anjos Simões
1º Ciclo de Bioquímica
Functional and therapeutical implications
of ligand recognition by the scavenger-like
lymphocyte receptors CD5 and CD6
Dissertação para obtenção do Grau de Mestre em Genética Molecular e Biomedicina
Orientador: Francisco Lozano, Prof.Doutor, CEK
Co-orientador: Vanesa Martinez, Doutora, CEK
Co-orientador: Ana Madalena Ludovice, Prof.Doutora, FCT/UNL
Júri:
Presidente: Prof. Doutor José Paulo Sampaio Arguente: Prof. Doutora Paula Alexandra Videira
Functional and therapeutical implications of ligand recognition by the scavenger-like lymphocyte
receptors CD5 and CD6
Copyright Inês Tadeu dos Anjos Simões, FCT/UNL, UNL
A Faculdade de Ciências e Tecnologia e a Universidade Nova de Lisboa têm o direito, perpétuo e sem limites
geográficos, de arquivar e publicar esta dissertação através de exemplares impressos reproduzidos em papel ou
de forma digital, ou por qualquer outro meio conhecido ou que venha a ser inventado, e de a divulgar através de
repositórios científicos e de admitir a sua cópia e distribuição com objectivos educacionais ou de investigação,
Acknowledgments
My utmost gratitude goes to my thesis advisor, Dr. Francisco Lozano Soto, for allowing me to join his team despite the paperwork that was necessary. Thank you for the opportunity to learn from you and trust in me!
It is a pleasure to thank the Immunoreceptors of the Innate and Adaptive System group, or as we say Paco’s, for their hospitality. I am indebted to you, who made my stay in Barcelona a very pleasant one, scientifically and personally. Working in the lab was always a joy! Thank you to teach me how to be a scavenger!
I wouldn't be performing this work without two special persons who I had the privilege to work with. Rafael Fenutría, thank you for the hours spent in the biotherium and cytometer and all you have teach me. Vanesa Martinez, thank you for your continual encouragement and support. This thesis would not have been possible without your guidance, patience and kindness. Thank you very much!
To all my friends, thank you for all the support, particularly on those days when work did not go as expected. Hey, one more stage reached!
Above all, I thank my family, who stood beside me, encouraged me constantly, and were able to provide me this experience.
Thank you, Gracias, Obrigada!
Não tenhamos pressa, mas não percamos tempo.
José Saramago
Getup,stand up, don't giveupthefight!
Abstract
The CD5 and CD6 lymphocyte surface receptors are highly homologous members of the Scavenger Receptor Cystein Rich (SRCR) superfamily mainly expressed by all T lymphocytes and the B1a subpopulation of B cells. Although the ultimate function/s are far from being completely understood, CD5 and CD6 are known to play a relevant role in both lymphocyte development and differentiation by negatively modulating the survival/death-inducing intracellular signals generated during the antigen recognition. Recently, this group has developed a transgenic mouse line which expresses a soluble form of human CD5, likely blocking the ligand-receptor interactions mediated by CD5 and interfering with normal lymphocyte response.
This study was aimed at furthering the study of the recombinant soluble human CD5 Transgenic (rshCD5Tg) mouse phenotypical analysis, its response to antigen stimuli and tumor implantation; the function of rshCD6 was also tested.
It was observed that rshCD5Tg mice display an exacerbated immune response, likely due to a reduction in the number of T and B cells with regulatory/suppressive function (Treg, B1a, B10 cells) and the increase in effector cells (NKT, MZ B cells). In agreement with these phenotypical characteristics, the functional analysis of rshCD5Tg mice showed enhanced immune responses to T-dependent and –inT-dependent antigens, as well as enhanced anti-tumoral responses, with or without concomitant chemotherapy treatment. Importantly, both the phenotypical and functional findings could be reproduced in wild-type mice following prolonged infusion of purified exogenous rshCD5 protein.
Overall, these results argue in favor of a relevant role of CD5-mediated molecular interactions in the homeostasis of functionally relevant lymphocyte subpopulations and open the possibility for CD5-based therapeutical interventions in different disease settings such as cancer, infection and immunodeficiency.
Resumo
Os receptores linfocitários de superfície, CD5 e CD6, são membros altamente homólogos da superfamília de receptores Scavenger ricos em cisteína (SRCR), que se expressam em todos os linfócitos T e na subpopulação B1a das células B. Apesar das funções de CD5 e CD6 ainda não estarem completamente determinadas sabe-se que têm um papel relevante no desenvolvimento linfocitário assim como na sua diferenciação modulando negativamente os sinais intracelulares de indução de sobrevivência/morte gerados durante o reconhecimento antigénico. Recentemente, o grupo desenvolveu uma linha de ratos transgénicos que expressam a forma solúvel humana de CD5, levando ao bloqueio das interacções receptor-ligando mediadas por CD5 e interferindo com a resposta linfocitária normal.
Este estudo teve como objectivo aprofundar a caracterização fenotípica do rato transgénico (rshCD5Tg) e a sua resposta a estímulos antigénicos e tumorais; a função de rshCD6 também foi testada.
Observou-se que o rato rshCD5Tg possui uma resposta imune exacerbada, provavelmente devido a uma redução do número de células B e T com função reguladora/supressora (células Treg, B1a, B10) e o aumento do número de células efectoras (células NKT e B da MZ). De acordo com estas características fenotípicas, a análise funcional do rato rshCD5Tg demonstrou uma resposta imune a antigénios T dependente e independente exacerbada, assim como uma resposta anti-tumoral aumentada, com ou sem tratamento quimioterapêutico concomitante. É ainda de referir que as descobertas tanto a nível fenotípico como a nível funcional podem ser reproduzidas em ratos WT após administração prolongada da proteína rshCD5 exógena purificada.
Em suma, estes resultados comprovam a importância das interacções moleculares mediadas por CD5 na homeostasia de subpopulações linfocitárias funcionalmente relevantes e torna possível a futura utilização de CD5 em intervenções terapêuticas em diferentes quadros clínicos, como por exemplo, cancro, infecção e imunodeficiências.
List of Abbreviations and terms
aa –amino acid
Ab – Antibody
Ag – Antigen
ALCAM - Activated leukocyte cell adhesion molecule
AOM - Azoxymethane
APC – Antigen presenting cells
BCR –B cell receptor
bp – base pairs
BSA – Bovine Serum Albumin
CD – Cluster of Differentiation
CD5L – CD5 ligand
CFA - complete Freund's adjuvant
DMSO - Dimethyl sulfoxide
DNA - Deoxyribonucleic acid
DSS – Dextran Sulfate Sodium
ELISA - Enzyme-Linked ImmunoSorbent Assay
FBS - Fetal Bovine Serum
h – hour
hCD5 – human CD5
HSA – Human Serum Albumin
i.p. – intraperitoneal
i.v. - intravenous
Ig - Immunoglobulin
IL – Interleukin
kb - Kilobases
kDa – Kilodaltons
KLH - Keyhole Limpet Hemocyanin
LPS – Lipopolysaccharide
MHC – Major Histocompatibility Complex
min - minutes
MZ – Marginal zone
NK – Natural killer
OD – Optic Density
PAMP - Pathogen-associated molecular patterns
PBS - Phosphate Buffered Saline
PCR – Polymerase Chain Reaction
PFA – Paraformaldehyde
RNA - Ribonucleic acid
Rpm – rotations per minute
rshCD5 – recombinant soluble human CD5
rshCD5tg – recombinant soluble human CD5 transgenic mice
rshCD6 – recombinant soluble human CD6
RT – room temperature
s.c. – subcutaneous
SD – Standard deviation
SR – Scavenger Receptor
SRCR - Scavenger Receptor Cysteine Rich
SRCR-SF – Scavenger Receptor Cysteine Rich- Superfamily
TCR – T cell receptor
TD – T dependent
TI – T independent
TIL – Tumor Infiltrating Lymphocytes
TLR – Toll-like receptor
TNP - Trinitrophenyl
Treg – regulatory T cells
WT – Wild-type
Zym – Zymosan
Contents Page:
Acknowledgements I
Abstract III
Resumo V
List of Abbreviations and terms VII
Table of Contents IX
Index of Figures XI
Index of Tables XIII
1. Introduction 1
1.1. The Immune System 1
1.2. Specificity of the adaptive immune response 1
1.3. Antitumor Immunity 3
1.4. Scavenger receptors and SRCR Super-Family 4
1.5. Group B SRCR-SF members 5
1.5.1. CD6 molecule 5
1.5.2. CD5 molecule 7
1.5.2.1. CD5 expression in T cells 8
1.5.2.2. CD5 expression in B cells 8
1.5.2.3. Role of CD5 in the regulation of the TCR response 8
1.6. CD5 ligands 9
1.7. Recombinant soluble human CD5 transgenic mice 9
1.8. Objectives 12
2. Materials and Methods 13
2.1. Maintenance of the mice colony 13
2.2. Genotyping of mice 14
2.3. Validation of the results with transgenic mice injecting rshCD5 in wild-type mice 15
2.3.1. Confirmation of biological functionality of commercial lots of rshCD5 by ELISA 15
2.3.2. Confirmation of new lot functionality by a sepsis model 16
2.3.3 Detection of rshCD5 serum levels by ELISA after injection 17
2.4. Characterization of lymphocyte populations in mice 18
2.4.1. rshCD5 transgenic mouse 18
2.4.2. Effect of rshCD5 and rshCD6 injection in mice 19
2.5. Immunization with T-independent type 1 and 2 and T-dependent antigens 19
2.6. Experimental Tumor Models 20
2.6.2. RMA-S lymphoma cell line 21 2.6.3. MCA 205 sarcoma cell line 21 2.6.4 Measurement of cytokines levels in tumor extracts by ELISA 22 2.6.5. AOM/DSS colon carcinogenesis murine model 22
2.7. Data Analysis 22
3. Results 23
3.1. Genotyping of mice 23
3.2. Validation of the results with transgenic mice injecting rshCD5 in wild-type mice 24 3.2.1. Confirmation of biological functionality of commercial lots of rshCD5 by
ELISA 24
3.2.2. Confirmation of new lot functionality by a sepsis model 25 3.2.3 Detection of serum levels by ELISA after rshCD5 injection 27 3.3. Characterization of lymphocyte populations in mice 27 3.3.1. rshCD5 transgenic mouse 27 3.3.2. Effect of rshCD5 and rshCD6 injection in mice 30 3.4. Immunization with T-dependent and T-independent type 1 and 2 antigens 34 3.5. Experimental Tumor Models 38 3.5.1. Role of rshCD5 in tumor development 38 3.5.1.1. B16 melanoma cell line 38 3.5.1.2. RMA-S lymphoma cell line 40 3.5.1.3. MCA 205 sarcoma cell line 40 3.5.1.4. Measurement of protein cytokines in tumor extracts by ELISA 41 3.5.1.5. AOM/DSS colon carcinogenesis murine model 41 3.5.2. Role of rshCD6 in tumor development 42
4. Discussion 43
4.1. Functional study of rshCD5 in the homeostasis of regulatory and effector lymphocyte
subpopulations 43
4.2. Study of the rshCD5Tg mice immune response to TD and TI antigens 46 4.3.Tumor models in rshCD5Tg mice 47 4.4. Conclusions and future perspectives to further this study 49
Index of Figures Page:
1. Introduction
Fig. 1.1. – Ag presentation by an APC to a T cell in the adaptive immune response and
subsequent activation of the T cell. 1
Fig. 1.2. – T lymphocytes receptors and accessory molecules. 1
Fig. 1.3. – B-cell receptor complex. 3
Fig. 1.4. – Schematic representation of group B SRCR-SF members. 5
Fig. 1.5. – Schematic representation of the interaction between the membrane-bound and soluble forms of CD6 and its ligand, ALCAM. 6
Fig. 1.6. – Schematic representation of the interaction between the membrane-bound and soluble forms of CD5 and its ligand. 7
Fig. 1.7. – Summary of the observed and predicted changes in lymphocyte populations of rshCD5Tg mice. 11
2. Materials and Methods Fig. 2.1 – Breeding schemes for different mouse genotypes. 13
3. Results Fig. 3.1. – Illustration of agarose electrophoresis gels obtained from the DNA screening of rshCD5 transgenic and non-transgenic mice by PCR. 23
Fig. 3.2. – Western Blot confirming the biotinylation of a new batch of rshCD5 and BSA. 24
Fig. 3.3. – rshCD5 binding to different yeast wall components. 25
Fig. 3.4. – CD1 mice sensitivity to septic shock induced by zymosan. 25
Fig. 3.5. – Inflammatory response 18h after induction of septic shock by zymosan. 26
Fig. 3.6. – C57BL/6 WT mice sensitivity to septic shock induced by zymosan. 26
Fig. 3.7.– Inflammatory response 18h after induction of zymosan septic shock by zymosan. 26 Fig. 3.8. – Detection of exogenously administrated rshCD5 in C57BL/6 WT mice. 27
Fig. 3.9. – Flow cytometry analysis of T cells in rshCD5Tg and non-transgenic mice. 28
Fig. 3.10. – Percentage of T cells in lymphocytes. 28
Fig. 3.11. – Flow cytometry analysis of MZ cells in rshCD5Tg and non-transgenic mice. 29
Fig. 3.12. – Percentage of MZ cells in spleen lymphocytes (n=5) in 7/10 week old rshCD5Tg and non-transgenic mice. 29
Fig. 3.13. – Flow cytometry analysis of NKT spleen cells in rshCD5Tg mice. 30
Fig. 3.14. – Percentage of NKT spleen cells in 7/10 week old rshCD5Tg and non-transgenic mice (n=5). 30
Fig. 3.15. – Flow cytometry analysis of peritoneal Treg cells. 31
Fig. 3.17. – Flow cytometry analysis of peritoneal B-1 cells. 33 Fig. 3.18. – Percentages of cell subpopulations in treated and control mice. 33 Fig. 3.19. – Hapten-specific antibody responses in rshCD5Tg and non-transgenic mice. 35 Fig. 3.20. – Percentage of spleen B-1 cells at day 21 post-immunization. 35 Fig. 3.21. – Hapten-specific antibody responses in rshCD5Tg and non-transgenic mice. 36 Fig. 3.22. – Hapten-specific antibody responses in rshCD5Tg and non-transgenic mice. 37 Fig. 3.23. – Percentage of spleen and peritoneal B-1 cells at day 14 post-immunization. 38 Fig. 3.24. – B16 tumor growth in vivo. 39 Fig. 3.25. – Effect of rshCD5 as a chemotherapy adjuvant. 39 Fig. 3.26. – RMA-S tumor growth in vivo. 40 Fig. 3.27. – MCA 205 tumor growth in vivo. 40 Fig. 3.28. – Murine IL-1β, IL-6, IL-10 and TNF-α levels in tumor extracts by ELISA. 41 Fig. 3.29.– Number of colon tumors in mice treated with AOM/DSS. 41 Fig. 3.30. – Effect of rshCD6 as a chemotherapy adjuvant. 42 4. Discussion
Fig. 4.1. – NKT cells express the surface marker of NK1.1 and a semiinvariant T cell receptor
Index of Tables Page:
2. Material and Methods
Table 2.1. – Sequence of the specific pair of primers amplifying the extracellular region of
human CD5. 14
Table 2.2. – Sequence of the specific pair of primers to the LIEX gene. 14 Table 2.3. – Recipe for SDS-PAGE gels. 15 Table 2.4. – Flow cytometry antibodies used in the study with the respective conjugate, work
dilution and distributor. 18 Table 2.5. – Table of anti-Immunoglobulin antibodies used and their working dilutions for
1. Introduction
1.1. The Immune System
The immune system is responsible for defending the organism against foreign or self threats. This defense can be divided for its study into two types of immune response: innate and adaptive. The innate, natural or nonspecific immunity (phylogenetically the oldest defense system) is the first line of host defense for multicellular organisms and is a very fast response (almost in seconds through the first phases, 0 to 5 days). Innate immunity always responds similarly to the infection and the mechanisms of response are intrinsic (natural), not needing a prior exposure to the potentially harmful stimuli. This response consists on the one hand of soluble components such as complement molecules and cytokines, and on the other hand of cellular components such as macrophages, neutrophils, monocytes and NK lymphocytes. Actually, the innate response does not recognize specific pathogens but common structures of these pathogens which are essential to their survival and distinct from host molecules, and which are termed pathogen-associated molecular patterns (PAMPs).
When the defensive capacity of the organism grows with the increasing number of successive exposures to a particular pathogen, it is said that the response adapts to the threat – involving the adaptive, acquired or specific immunity. This response is only present in vertebrates and consists on the one hand of soluble components (humoral immunity) such as antibodies and cytokines, and on the other hand of cellular components such as B and T (cellular immunity) lymphocytes. Unlike the innate response, adaptive response is specific to the pathogen and may develop memory, so that in future contacts the response is improved. In order for B and T lymphocytes to be activated, it is necessary that they recognize and bind to the antigen (Ag). In some cases the Ag alone can activate the B cell, but mostly simultaneous activation by T cells (termed T helper cells) is necessary. When B lymphocytes are activated, they generate immunoglobulins, specific antibodies to the Ag recognized by the B cell receptor. Regarding T cells, there are many subpopulations with different functions and characteristics, but these cells are generally divided for their study in T helper (which promote cell response and Ab production) and T cytotoxic cells (which recognize the cells that express the Ag and lyse them).
This simplified breakdown of the immune system helps with the understanding of this complex organization, but in reality it is very difficult to establish defined boundaries between responses.
1.2. Specificity of the adaptive immune response
The specificity of the adaptive immune response lies in the antigen receptor on T and B cells, named TCR and BCR respectively.
in order to be recognized by TCR. These cells must establish a stable contact to initiate the signal transduction in the T cell through the recognition of the Ag within the polymorphic structure of the Major Histocompatibility Complex molecule (MHC).
Fig. 1.1. – Ag presentation by an APC to a T cell in the adaptive immune response and subsequent activation of the T cell. APC: antigen-presenting cell; MHC: major histocompatibility complex; TCR: T-cell receptor. Adapted from Kallinich et al., 2007.
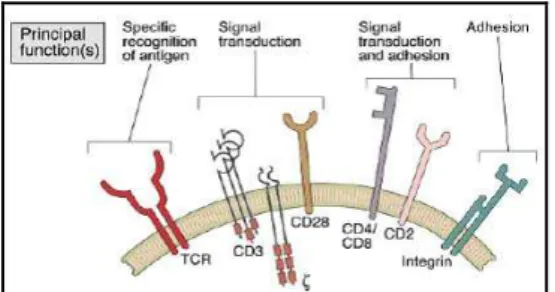
Signaling triggered by Ag recognition is not effected through the TCR itself, but through accessory proteins such as CD3. These molecules are non-covalently linked to the TCR to form the TCR complex. There are more accessory molecules involved in the signal transduction processes, facilitating and improving, as well as downregulating, signaling to modulate the activation of the T lymphocyte and also to stabilize TCR-MHC binding (immunological synapse).
Fig. 1.2. –T lymphocyte receptors and accessory molecules. Adapted from Abbas et al., 6th edition, 2008.
The TCR consists of a TCRα and TCRβ dimer covalently bound with disulphide bridges. These are non-covalently bound to the transmembrane CD3 signalling complex, consisting of CD3γ, CD3δ, CD3ε and CD3ζ, which activate the T cell after Ag contact (Smith-Garvin et al., 2009). The accessory molecule signals modulate the activation of the lymphocyte and may influence the type of response. Among these molecules, the most important are CD4, CD8, CD2, CD28 (signal amplification), CD11a, CD18, CD29 (pro-adhesive integrins), scavenger-like receptors (CD5 and CD6) and mucins (which have both an adhesive and signalling role).
disulfide bridges, are responsible for signal transduction, since the cytoplasmic tail of IgD and IgM is very short and lacks intrinsic catalytic properties. It can be said that these two molecules have a similar function to that of CD3 and ζ in T cells.
Fig 1.3. – B-cell receptor complex. Surface immuno-globulin associated to the invariant proteins Igα and Igβ. The immunoglobulin recognizes and binds antigen and the Igα and Igβ, which are antigen-nonspecific, are the signaling molecules. The latter possess a single immunoreceptor tyrosine-based activation motif (ITAM) each, shown as a yellow segment, in their cytosolic tails. Igα and Igβ are disulfide-linked and associated with the heavy chains. Adapted from Janeway, C. A. Jr. et al., 5th edition, 2001.
After their activation, B lymphocytes can follow two paths, interact with T lymphocytes (T-dependent response) or differentiate and proliferate regardless of T cells (T-in(T-dependent response).
1.3. Antitumor Immunity
Cancer is the disease with the highest rate of mortality and morbidity among children and adults. It is defined by uncontrolled cell proliferation and possible spread of the transformed cells, involving invasion of adjacent/distant tissue (metastasis).
The immune system is able to recognize and destroy these malignant cells and to halt the development of tumors; however, a frequent characteristic of malignant tumors is their ability to escape or overcome the host's defense mechanisms.
Tumor Ags may have different origins: they could be mutated host proteins (i.e., in tumors induced by radiation or carcinogens, for example) or expressed in an aberrant form/excess (as occurs in melanoma, for example).
The antitumor response may be carried out by innate and/or adaptive immunity. This type of response involves innate specialized cells such as NK cells and macrophages, as well as adaptive specialized cells such as CD8+ cytotoxic lymphocytes, CD4+ helper T lymphocytes and the Ab-producing B lymphocytes that generate tumor antigen-specific antibodies.
1.4. Scavenger receptors and SRCR Super-Family
The term scavenger receptor (SR) was initially applied to those receptors expressed by macrophages and able to uptake modified lipoproteins as well as pathogens. Nowadays, the term includes a vast number of cell surface and soluble glycoproteins involved in the recognition/endocytosis of polyanionic molecules, proteins, lipids, etc., from the host or from pathogenic structures. It should be noted that the proteins with SR functions have widely different structures, containing domains that include among others collagen, C-type lectin or scavenger receptor cysteine-rich (SRCR) domains, involved in pattern recognition (Sarrias et al., 2004).
The SRCR domain is rich in cysteine residues and is the molecular signature of the SRCR superfamily (SRCR-SF), with more than 30 different proteins sharing a high degree of structural and phylogenetic conservation; however, the only single common characteristic shared by all proteins of the SRCR-SF reported so far is that they are all extracellular. The SRCR domain has approximately 100-110 amino acids and can be found in extracellular membrane receptors and also in soluble proteins. These proteins can be expressed in hematopoietic and non-hematopoietic cells (Sarrias et al., 2004); among the first are proteins expressed in cells of the immune system, which generally play a role in the development of the immune system and in the regulation of the innate and adaptive immune response, while the second group includes proteins expressed in non-immune cells such as epithelial cells from gastrointestinal, genitourinary and bronchopulmonary tract, and even in hepatocytes (Aruffo et al., 1997).
1.5 Group B SRCR-SF members
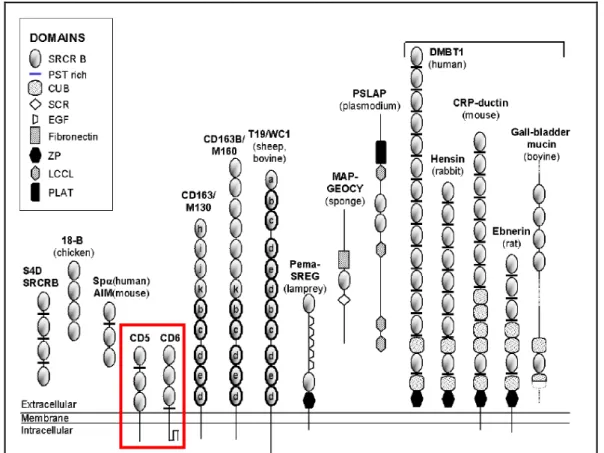
To date, 12 protein members of the group B of the SRCR-SF have been described; among these proteins are CD5 and CD6. The extracellular region of these proteins is composed exclusively of three group B SRCR domains. CD5 and CD6 are expressed as both membrane and soluble forms in thymocytes, T and B1a lymphocytes (Sarrias et al., 2007), where they modulate signaling through the TCR (both CD5 and CD6) and BCR (CD5 only), thus influencing host defense and homeostasis of the immune system. The human CD5 gene is localized in 11q12.2 chromosome, 82kb downstream from the human CD6 gene; these genes are also located in a similar position in mice chromosome 19 (Aruffo et al., 1997; Arman, 2004). The conserved loci of those genes, both in human and mouse, supports the theory that these two genes may have evolved from duplication of a primordial gene.
Fig. 1.4. – Schematic representation of group B SRCR-SF members. Proteins described in mammals, unless indicated. In the red rectangle are the members of this family studied in this work. Adapted from Sarrias et al.,2004.
1.5.1 CD6 molecule
transmembrane region consists of 26 aa and the extracellular region is composed of 3 SRCR domains (homologous to the corresponding domains of CD5) followed by a spacer region of 33 aa, resulting in a highly glycosylated molecule with a length of 374 aa (Bowen et al., 2000).
As described above, this molecule is expressed in thymocytes, mature T cells, and B1-a cells, similar to CD5, but also in brain: cerebral cortex and basal ganglia, and also in chronic B-cell lymphocytic leukemias (Arman, 2004). CD6 is associated and co-localizes with CD5 in the membrane of resting T lymphocytes and in the immunologic synapse during the cellular activation. Following this activation, CD6 levels are up-regulated.
CD6 is a co-stimulatory molecule that enhances the development and differentiation of mature T cells, modulating the TCR signaling by synergizing with other co-stimulatory molecules and proliferative signals of the TCR (Arman, 2004). Furthermore, it has also been described that membrane and soluble forms of CD6 can bind to Gram-positive and Gram-negative bacteria through the recognition of PAMPs such as LPS and LTA, a function shared with other members of the ancient and highly conserved SRCR-SF (Soldevila et al., 2011). The soluble form is thought to be originated by a proteolytic cleavage process but it is still uncertain. Also, there is virtually no information regarding its physiological function/s, save from the fact that they are able to bind CD166/ALCAM as well as pathogens through PAMPs.
Different CD6 ligands have been reported, but the main ligand for this receptor is ALCAM (activated leukocyte-cell adhesion molecule). This type 1 membrane glycoprotein of the Ig superfamily is expressed in activated leukocytes (T and B), monocytes, neurons and thymic epithelium (Arman, 2004). The specific CD6/ALCAM binding takes place through the SRCR-D3 and the N-terminal V-like Ig domain with a 1:1 stoichiometry (Arman, 2004; Sarrias, 2004). The CD6 binding site on human and murine ALCAM is conserved, allowing for cross-species binding activity.
1.5.2 CD5 molecule
CD5, also known as T1, Leu-1, Tp67 (human) or Ly-1 (mouse), is a 67KDa type 1 membrane glycoprotein (Sarrias et al., 2004). The extracellular region is composed of 3 SRCR domains, where domains 1 and 2 are separated by a proline-threonine-rich region and domain 2 and 3 are directly linked in tandem (Bowen et al., 2000), for a total of 350 aa; the transmembrane region is composed of 31 aa and the cytoplasmatic region, highly conserved and with 90% homology between human and mouse, 92 aa (Fenutría, 2011). Domain 1 (SRCR1), the furthest from the cellular membrane, is the less conserved as compared to other mammalian SRCR domains and the most immunogenic (Arman, 2004). SRCR1 and SRCR2 are the domains involved in the interaction with the putative CD5 ligand, while SRCR3 is important in stabilizing this interaction (Calvo et al., 1999).
The first protein of the SRCR-SF described to have a soluble form was CD5. This form has a molecular weight of 52KDa and can be found circulating in serum at low levels, and probably results from proteolytic cleavage after lymphocyte activation (Arman, 2004; Fenutría, 2011), but their functional relevance has not yet benn fully investigated. Elevated levels of this protein have been found in certain autoimmune diseases suggesting that shCD5 may be an indicator of chronic or exacerbated T cell activation, or alternatively, that it may play a role in the modulation of the immune response by interacting with CD5 ligand/s.
As mentioned above, CD5 is expressed in thymocytes, T and B1a lymphocytes and also in macrophages and dendritic cells (Fenutría, 2011). It is an accessory molecule capable of modulating activation and differentiation signaling through the TCR and BCR by physical association with the TCR/CD3 complex (also associated with the surface receptors CD4, CD8, CD2, CD6, CD9) and the BCR (Lozano et al., 2000). In this way, it is possible to affirm that CD5 is an important regulatory molecule in the responses mediated by B and T lymphocytes, which is supported by the fact that the expression of CD5 is up-regulated following TCR-CD3 crosslink and murine B-IgM crosslink. However, this molecule has been described as a positive but also negative modulator of the activation and differentiation signals received from the Ag-specific receptor on diverse cell types and development stages, as will be described later.
1.5.2.1. CD5 expression in T cells
CD5 membrane expression is highly regulated throughout T development/maturation in the thymus, which makes CD5 a highly specific marker of T lymphocytes (Arman, 2004; Fenutría, 2011). The immature double negative thymocytes have the lowest levels of CD5, which increase with the activation of the pre-TCR. This increase continues with the transition to double positive thymocytes and positive selection and conversion to single positive T lymphocytes; CD5 levels are higher in CD4+ single positive than in CD8+ single positive T lymphocytes. However, the levels of CD5 may vary in mature peripheral T cells, depending on the TCR avidity for the antigen developed during thymic selection (the higher the TCR avidity, the higher the CD5 expression) (Sellick et al., 2008). As a result, CD5 levels are highest in one particular type of regulatory T cells with a CD4+CD25+FoxP3+ phenotype, which possess very high affinity TCRs and maintain immune tolerance. As for CD8+ cells, it has been reported that the levels of CD5 are elevated when they are chronically exposed to an Ag, but return to basal levels outside that environment (Stamou et al., 2003).
1.5.2.2. CD5 expression in B cells
CD5 expression in B CD5+ cells is much lower than in T CD5+cells. In human peripheral blood, B CD5+ cells represent 1% of all lymphocytes and 10-15% of total B cells. In mice, CD5 expression can only be detected in a particular subtype, the B1a cells, characterized by a CD5+CD23 -IgMhighIgDlow phenotype and hosted mostly in the peritoneal cavity, where they represent 30 to 60% of total peritoneal cavity cells (Baumgarth, 2011). This subtype was originally thought to be of fetal origin because of the expression of a T cell marker, but is now known to differ from the B2 or conventional B cells in both phenotype (conventional B cells are IgMlowIgDhighCD23+CD5-) and function. When comparing these two subpopulations, the B1a cells are more longevous and appear to be important for T cell-independent type 2 cell responses (Martin et al., 2001), as well as generating natural IgM (natural polyreactive Abs with low affinity) that eliminate bacterial toxins and allow effective resistance to pathogens as part of the innate immune response (Baumgarth, 2011). This subpopulation also shows lower BCR affinity and diversity than B2 cells.
1.5.2.3. Role of CD5 in the regulation of the TCR response
The first functional assays performed to study the function of CD5 in peripheral T cells in vitro
indicated that this molecule acted as a co-stimulator, enhancing the proliferative response resulting from the activation of the TCR/CD3 complex (Alberola-lla et al., 1992; Verwilghen et al., 1993).
However, later studies with CD5 knockout mice showed that CD5-deficient mature T lymphocytes presented an exacerbated response to the TCR signalization/stimulation, suggesting that this molecule acted as a negative regulator of the TCR (Bikah et al., 1996; Pena-Rossi et al., 1999). Furthermore, the knock-down of CD5 levels was sufficient to reestablish the proliferation of a subpopulation of B lymphocytes, B1a cells; this indicates that the signals mediated by the BCR might be negatively regulated by the CD5 present in these cells.
1.6. CD5 ligands
A lot of controversy exists around the issue of the CD5 ligand/s. At present, CD5 ligand/s are still unknown, but a lot of candidates have been described: CD72, gp3440, gp40-80, gp150 and even CD5 itself (Brown and Lacey, 2010; Soldevilla et al., 2011), among others. The reason the ligand of CD5 is still unknown may be due to the fact that it is an unstable molecule with high conformational flexibility. However, more work is currently underway for the identification of the ligand of CD5, as its discovery would help to further the existing knowledge on the CD5 function.
The first reported ligand was CD72, a type C lectin expressed in B lymphocytes; however, no other research group was able to reproduce these results (Velde et al., 1991; Calvo et al., 1999). An interaction between CD5 and other proteins expressed on the surface of B cells such as gp200, gp40-80, etc., was later described, which might indicate a role for CD5 in the cooperation between T-B and B-B lymphocytes (Arman, 2004). Another described ligand was gp150, expressed in monocytes, lymphocytes, thymic epithelium, etc.; this interaction could explain the participation of CD5 in the APC-T cell interaction, the activation of T cells and the development and maturation of the thymocytes (Calvo et al., 1999).
Further studies are necessary to define which is the true ligand of CD5 and what is the functional importance of the CD5-CD5L interaction.
1.7. Recombinant soluble human CD5 transgenic mice
of the CD5-CD5L interaction. In this way, it would help to clarify the functions and role of CD5 in the immune system.
A practical advantage of this mouse model was the continuous endogenous production of rshCD5 with the aim of saving on production and purification of protein for administration; this would also eliminate the stress mice experiment at repeated injections. More importantly, the circulating rshCD5 could interact with endogenous murine ligand/s, blocking the interaction of these ligands with membrane CD5 and thus inhibiting the processes dependent on this union. In this way, these mice are effectively deficient in those functions of CD5 dependent on the interaction of this receptor with his ligand. Inactivation or knock-down of CD5 function observed in these mice would not be due to gene inactivation or deletion, but would be just a functional effect mediated by the inhibition of the CD5-CD5L interaction. Another great advantage of this model is that potential beneficial results observed in it can be easily transferred to a possible treatment in humans by administration of recombinant protein, rather than gene inactivation or increase of gene expression, which in a patient is technically much more difficult than to administer purified exogenous rshCD5 (Fenutría, 2011).
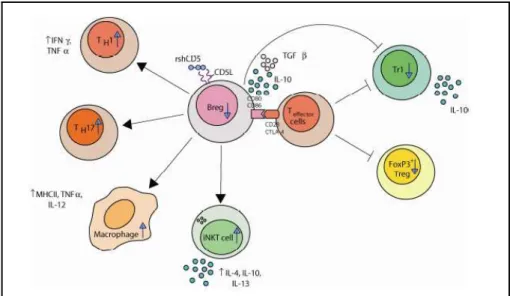
Fig. 1.7. – Summary of the observed and predicted changes in lymphocyte subpopulations in rshCD5Tg mice. The diagram shows how a decrease in the Breg subpopulation, associated with a decline in T regulatory population (FoxP3+Treg and Tr1), would affect the activity of T effector (Th1, Th17, NKT) subpopulations and macrophages. Adapted from Fenutría, 2011.
The decrease in subpopulations with regulatory/suppressive function, coupled with the increase in subpopulations with effector function, observed in rshCD5Tg mice suggested that the immune response might be enhanced in these mice as compared to non-transgenic mice. However, none of the differences observed were dramatic, which could lead to think that they would not be sufficient to have functional relevance. In order to confirm this, the response of the transgenic mice was analyzed in cases of autoimmune diseases and inflammation.
With regard to autoimmune diseases, the behavior of the transgenic mice was studied following induction of Experimental Autoimmune Encephalomyelitis (EAE) and Collagen-induced arthritis (CIA). It was found that the rshCD5Tg mice had a more exacerbated immune response than the C57Bl/6 WT mice (Fenutría, 2011).
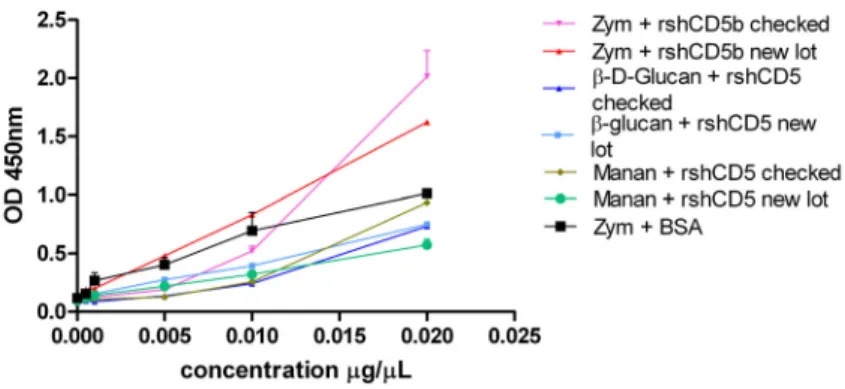
aggregate pathogens and their components, including β-glucan, a component of the fungal wall and consequently of Zym.
Due to its ability to modulate signaling through the Ag receptor of T and B lymphocytes, as well as its capacity to bind pathogens and their components, it can be said that CD5 is at the interface between innate and adaptive immunity. The modulation of inflammatory phenomena by CD5 suggests that there exist potential therapeutic uses for soluble forms of CD5 in different clinical situations requiring an enhancement of the immune response, such as tumors, vaccine therapy and immunodeficiency caused by disease or immunosuppressive therapy.
1.8. Objectives
The global aim of this project was to analyze and to improve the understanding of the immunomodulating role of the CD5 and CD6 lymphocyte receptors – and their interactions with their ligands - on the immune response.
In this context, the following specific objectives were defined:
to further the knowledge of the potential consequences of the presence of circulating
rshCD5 in mice serum in the dynamics of regulatory and effector lymphocyte subpopulations in normal conditions or in situations of immune stimulation;
to carry out studies on different experimental models of disorders where the immune
system is involved, such as tumors or infection, in rshCD5Tg mice or in non-transgenic mice following administration of an exogenous soluble recombinant form of human CD5 or CD6 (rshCD5 and rshCD6);
to set the basis for future immune-mediated therapies aimed towards the blocking or
2. Materials and Methods
2.1. Maintenance of the mice colony
All protocols performed were approved by the Ethics Committee of the University of Barcelona and were performed in accordance with institutional guidelines for the Care of Animals that are included in the Spanish Legislation (RD 1201/2005), European (86/609) and American (National Institutes of Health’s Guide for the Care and Use of Laboratory Animals).
For the experiments carried out, groups of mice where used with the highest possible N and similarities in age, sex and weight. For this purpose the following breeding strategy was established:
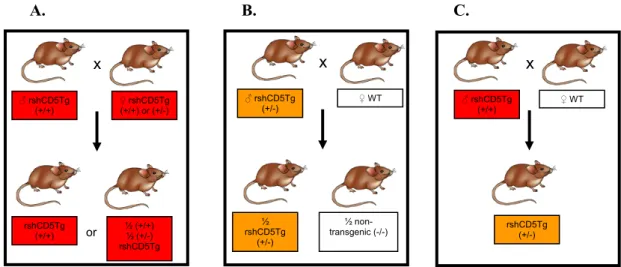
A. B. C.
Figure 2.1 – Breeding schemes for different mouse genotypes. A. Breeding between a rshCD5 homozygote male and a transgenic female (homozygote or heterozygote) and the correspondent offspring. B. Breeding between a
rshCD5 heterozygote male and a C57BL/6 WT female and the correspondent offspring. C. Breeding between a
rshCD5 homozygote male and a C57BL/6 WT female and the correspondent.
For the experiments, both transgenic and non-transgenic (control) littermate mice were needed, so 3 cages were set up according to breeding scheme B., with one male and two females to obtain the maximum number of mice for these groups. Likewise, two cages were set up following breeding scheme C. (one male and two females each cage) to guarantee the existence of transgenic mice in the colony, while one cage (one male and two females) was set up according to breeding scheme A. to obtain homozygote males. To verify that males were homozygote, they were crossed with C57BL/6 WT females and their offspring was genotyped; the mouse was deemed homozygote if all the offspring was positive for the transgenic gene. These males were then used to substitute the homozygote males in the crosses after a certain period of time.
Once a week the colony was reviewed in order to organize the crosses, check the health of the mice and the number of new born mice, and to follow their development up to 4 weeks, when they are weaned and genotyped.
x
♂ rshCD5Tg (+/+)
♀ rshCD5Tg (+/+) or (+/-)
rshCD5Tg (+/+) ½ (+/+) ½ (+/-) rshCD5Tg or x
♂ rshCD5Tg (+/-)
♀ WT
½ rshCD5Tg (+/-) ½ non-transgenic (-/-) x
♂ rshCD5Tg (+/+)
♀ WT
2.2. Genotyping of mice
To identify which mice were transgenic for rshCD5 a PCR was performed. Genomic DNA was extracted from an ear punch sample with 50μL of lysis buffer (1M Tris pH=8, 0,5M EDTA, 5M NaCl and 10% SDS)plus 1μL ofproteinase K (Roche, Germany). Two pairs of Primers were used for each PCR (all provided by Sigma-Aldrich, USA), one specific for the transgene (the extracellular region of human CD5):
Table 2.1 – Sequence of the specific pair of primers amplifying the extracellular region of human CD5.
Forward Primer: CD5 ExtraFort 5’-GCTGTCCCAGTGCCACGAACTT-3’
Reverse Primer: PingSV40 poly A-R 5’-GAAGCTCCTCTGTGTCCTCAT-3’
originating one fragment of 450bp; and one for an internal PCR amplification control amplifying the LIEX gene (region of the invariant chain Li of MHC class I), present in all C57BL/6 mice, originating a fragment of 150bp:
Table 2.2 – Sequence of the specific pair of primers to the LIEX gene.
Forward Primer: 5’-TCACTCAAGGCAACCTTCCTGC-3’
Reverse Primer: 5’-CGACCTCATCTCTAACCATGAACAG-3’
PCR reactions were carried out in a final volume of 50μL, using 200uM of each dNTP, 300nM of each primer, 1x of Expand High Fidelity buffer (1,5mM MgCl2), 2,6U of Expand High Fidelity
enzyme mix and 1μL of DNA solution. Amplification was performed in a GeneAmp PCR System 2700 termocycler (Applied Biosystems) using 30 cycles of 5min. at 94ºC, 1min. at 92ºC, 1min. at 53ºC, and 8min. at 72ºC.
2.3. Validation of the results with transgenic mice by injection of rshCD5 in wild-type
mice
2.3.1. Confirmation of biological functionality of commercial lots of rshCD5 by
ELISA
The rshCD5 used in these experiments was purchased from PX’Therapeutics (France) and whenever a new batch was started, tests were performed to ensure biological functionality. Below are described the tests carried out upon the arrival of a new batch.
Firstly, an aliquot of the new batch of rshCD5 and BSA (Sigma-Aldrich, USA) were biotinylated. For these experiments, EZ-Link® Sulfa-NHS.LC-LC-Biotin with a MW = 669,75 and spacer arm of 30,5Ǻ (Pierce, Thermo Fisher Scientific, USA) was used. For labeling with biotin, the protocol provided by the manufacturer was followed, dissolving biotin in PBS at a concentration of 10mM and a ratio of 1:20 (protein: biotin). Once the protein was biotinylated, it was purified by desalting (HiTrap, GE Healthcare Biosciences, USA), removing the excess of biotin unbound to protein. Finally the proteins were quantified by spectrophotometry at 280nm (Gen5 1.09, Epoch, BioTek).
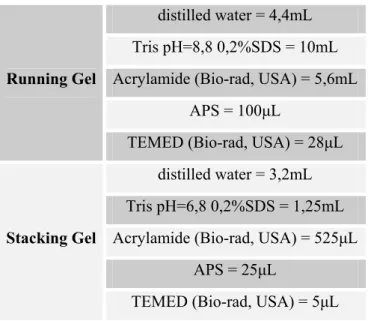
After purifying these biotinylated proteins, biotinylation was checked by Western Blot. First, the samples were separated by a SDS-PAGE gel electrophoresis (see table 2.3) in running buffer pH=8,3 (Tris HCl 25mM, Glycine 192mM and 0,1% SDS) at 100V until the dye front reached the bottom of the gel.
Table 2.3 – Recipe for SDS-PAGE gels.
Running Gel
distilled water = 4,4mL
Tris pH=8,8 0,2%SDS = 10mL
Acrylamide (Bio-rad, USA) = 5,6mL
APS = 100μL
TEMED (Bio-rad, USA) = 28μL
Stacking Gel
distilled water = 3,2mL
Tris pH=6,8 0,2%SDS = 1,25mL
Acrylamide (Bio-rad, USA) = 525μL
APS = 25μL
TEMED (Bio-rad, USA) = 5μL
of Streptavidin-POD Conjugate in blocking solution for 20min. After 3 washes with PBS-0,01%Tween 20, biotinylated proteins on the membrane were detected with SuperSignal® West Dura Extended Duration Substrate for a minute in the dark. Images were analyzed and recorded with the Luminescent Image Analyzer – ImageQuant LAS 4000.
Once the biotinylated proteins were checked, a Sandwich ELISA was performed to evaluate whether the new batch of rshCD5 bound to the yeast wall components in vitro.
A 96-well flat-bottom plate was coated with 2μg/mL of Zymosan (Sigma-Aldrich, USA), Mannan (Sigma-Aldrich, USA) or B-D-Glucan (Sigma-Aldrich, USA) (in a final volume of 100μL) in carbonate/bicarbonate buffer pH 9,5 overnight at 4oC. The coating solution was removed and the plate washed three times with PBS-0,05% Tween 20, then blocked for 1 hour at RT with 100μL of PBS-3% BSA (Sigma-Aldrich, USA). The supernatant was discarded and the plate washed three times. After these washes, each yeast wall component was incubated for 2h at RT with three different proteins/conditions: increasing concentrations {0; 0,05; 0,1; 0,5; 1; 2}μg/well of rshCD5-biotin from an already checked lot as positive control, BSA-biotin as negative control and rshCD5-biotin from the new lot, all in duplicate. The plate was washed again three times and after that incubated 30min at RT with a 1/1000 dilution of Streptavidin-POD Conjugate (Roche Diagnostics) in blocking solution. The plate was washed again three times and 100μL of TMB Substrate Reagent Set (BDOptEIA, BD Bioscience) were added to each well and incubated 10min in the dark. At this point, 100μL 0,5M Sulfuric Acid were added to each well to stop the reaction and the OD was measured in an ELISA reader (Gen5 1.09, Epoch, BioTek) at a wavelength of 450nm. It should be noted that another negative control was done using 1μg/well of rshCD6-biotin. A positive and negative control of the technique were also carried out by sensitizing the plate with already checked rshCD5-biotin or with buffer alone, respectively.
Two independent experiments were carried out for each new protein lot.
2.3.2. Confirmation of new lot functionality by a sepsis model
Besides the in vitro assays, an in vivo assay was also performed in the form of a sepsis model, Zymosan-Induced Septic Shock-Like Syndrome, already described by the group (Vera et al., 2008).
values for each of the four parameters of each mouse were summed up to give an assessment of the severity or final score per mouse of septic shock. The levels of cytokines were also analyzed at 18 hours post Zymosan-Induced Septic Shock. For cytokine detection in serum, the mice were euthanized by an overdose of Isoflurane and the blood extracted by cardiac puncture.
For detection and quantification of cytokines (murine IL-6 and IL-1β) in the mouse serum, the ELISA BD OptEIA Kit (BD Biosciences) was used according to the manufacturer's instructions. Firstly, 96-well flat-bottom plates were sensitized overnight at 4oC with capture Abs for both cytokines diluted in 100μL of carbonate buffer at a dilution specified by the manufacturer. The next day the plates were washed three times with washing buffer (PBS 0.05% Tween-20) and blocked with blocking buffer (PBS-10% inactivated FBS) for 1h at RT. Once the plates were washed, 100μL of sample (diluted 1:30 in blocking buffer for IL-6, undiluted for IL-1β) and the standards were added to each well in duplicate and incubated 2h at RT. After incubation, the plates were washed five times with washing buffer and 100μL of a solution containing the detection Ab plus the Streptavidin-POD Conjugate (Roche Diagnostics) in blocking solution were added at the indicated dilution for each cytokine Ab and incubated 1h at RT. After this incubation, the plate was washed 5 times with washing buffer and 100μL of TMB were added, incubating the plate 15/30 min at RT in the dark. To stop the reaction, 100μL of 2N sulfuric acid were added to each well and absorbance was measured at a wavelength of 450nm in the Gen5 1.09, Epoch, BioTek. The concentration of cytokines in the samples was calculated with a standard curve generated from the standards of known concentrations provided with the kit.
2.3.3 Detection of rshCD5serum levels by ELISA after injection
These experiments were also carried out with a Sandwich ELISA to detect the serum rshCD5 level injected through time. Each 8 week female C57BL/6 WT mice were injected with 25μg of rshCD5 and blood samples were extracted at 0h, 1h, 3h and 6h. The blood was immediately placed on ice until centrifugation at 5000rpm at 4oC for 15min. The serum was collected and kept at -80oC until the trial.
biotinylated LEU-1 at 2μg/mL for 1 hour at RT. Again, it was washed three times and incubated for 30min at RT with 100μL of 1/1000 dilution of Streptavidin-POD Conjugate (Roche Diagnostics) in blocking solution. After another 3 washes, 100μL of TMB Substrate Reagent Set (BDOptEIA, BD Bioscience) were added to each well and incubated 15min at RT in the dark. At this point, 100μL 2N sulfuric acid were added to each well to stop the reaction and the OD measured in an ELISA reader (Gen5 1.09, Epoch, BioTek) at a wavelength of 450nm. It should be noted that a control of the secondary Ab was also carried out by sensitizing the plate with 2μg/mL of biotinylated LEU-1 and treating it as the other samples.
2.4. Characterization of lymphocyte populations in mice
2.4.1. rshCD5 transgenic mouse
For the studies of lymphocyte populations by flow cytometry, the mice were euthanized with Isoflurane and the extracted tissues (spleen, thymus) or peritoneal lavage from rshCD5Tg and non-transgenic mice preserved on ice until the samples were processed. Flow cytometry was performed with a FACS Canto I flow cytometer (BD Biosciences, USA).
Firstly, cell suspensions were obtained (by mechanical tissue dissociation, if necessary) in PBS. Erythrocytes were then lysed by 5 min incubation at 4oC with NH4Cl 0,16M and 1x10⁶ cells per mouse
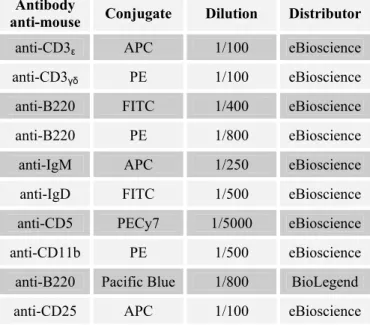
collected and blocked with PBS-10% inactivated FBS for 10min at 4oC. Then the samples were stained with the appropriate antibodies for each study (see table 2.4) for 30min. at 4oC. Treg lymphocyte populations require intracellular staining, which was performed following the instructions of the kit (PE anti-mouse/rat Foxp3 Staining Set, eBioscience, USA).
Table 2.4 – Flow cytometry antibodies used in the study with the respective conjugate, work dilution and distributor.
Antibody
anti-mouse Conjugate Dilution Distributor
anti-CD3ε APC 1/100 eBioscience
anti-CD3γδ PE 1/100 eBioscience
anti-B220 FITC 1/400 eBioscience
anti-B220 PE 1/800 eBioscience
anti-IgM APC 1/250 eBioscience
anti-IgD FITC 1/500 eBioscience
anti-CD5 PECy7 1/5000 eBioscience
anti-CD11b PE 1/500 eBioscience
anti-B220 Pacific Blue 1/800 BioLegend
anti-CD4 FITC 1/400 eBioscience
anti-CD4 APC 1/400 eBioscience
anti-Foxp3 PE 1/100 eBioscience
anti-NK1.1 PE 1/100 eBioscience
anti-CD21 FITC 1/200 eBioscience
anti-CD23 PE 1/400 eBioscience
2.4.2. Effect of rshCD5 and rshCD6 injection in mice
To confirm that the results obtained in the characterization of lymphocyte populations were not due to artifacts of random transgenesis of the rshCD5 gene in transgenic mice, 25μg of exogenous rshCD5 were administered by i.p. injection to C57BL/6 WTmice for 15 days, on alternate days.
On the other hand, it was also conducted assays where 25μg of rshCD6 was injected to C57BL/6 WT mice for 15 days, on alternate days. Thus, it was possible to assess whether these two homologous molecules induce the same changes in the lymphocyte populations.
For this analysis the samples preparation protocol was the same as described above.
2.5. Immunization with T-independent type 1 and 2 and T-dependent antigens
To study the antibody response to TD and TI antigens, rshCD5tg mice and non-transgenic mice were immunized i.p. with 50μg TNP5-KLH (as an example of TD), TNP0,3-LPS antigen (TI-1) and
TNP65-Ficoll antigen (TI-2) in 200μL of PBS. TNP haptens conjugated with different antigens were
supplied by Biosearch Technologies, Inc. USA. Serum from immunized mice were collected at days 0, 7, 14 (to TI response) and 21 (to TD response) after the primary immunization and stored at -20 ° C until analysis. Levels of TNP-specific antibodies were determined by ELISA. Briefly, plates were sensitized overnight with 3μg/mL TNP18-BSA (Biosearch Technologies, Inc. USA) diluted in PBS,
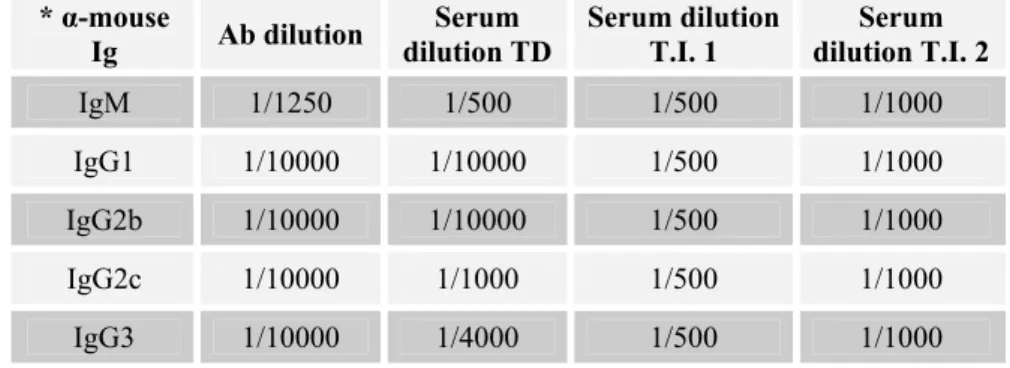
washed with PBS 0,05% Tween 20 and blocked with PBS 2% BSA for 1 h at 37°C. After doing a titration curve of serum for each antibody to select the best dilution, 100μL of antibody at the optimized dilution were added to the plate and incubated for one hour at RT (see table 2.5). To determine the levels of different isotypes of TNP-specific antibodies in the serum of immunized mice, biotinylated sheep anti-IgM, IgG1, IgG2a, IgG2b, IgG2c and IgG3 mouse (Jackson ImmunoResearch Laboratories, USA) were incubated for one hour at RT (see table 2.5). After three washes, Streptavidin-POD Conjugate (Roche Diagnostics) was added for 30min at RT. The assay was developed with 100μL of TMB (Tetramethylbenzidine, BD Biosciences, USA) for 30 min at RT in the dark. The reaction was stopped by adding 100μL of 2N sulfuric acid to each well. Subsequently the absorbance was measured in an ELISA reader (Gen5 1.09, Epoch, BioTek) at a wavelength of 450nm.
Table 2.5 – Table of anti-Immunoglobulin antibodies used and their working dilutions for each experiment type.
* α-mouse
Ig Ab dilution
Serum dilution TD
Serum dilution T.I. 1
Serum dilution T.I. 2
IgM 1/1250 1/500 1/500 1/1000
IgG1 1/10000 1/10000 1/500 1/1000
IgG2b 1/10000 1/10000 1/500 1/1000
IgG2c 1/10000 1/1000 1/500 1/1000
IgG3 1/10000 1/4000 1/500 1/1000
2.6. Experimental Tumor Models
The cell lines used in the experiments mentioned below were provided by the laboratory and all the cell lines used derived from murine cell lines. A stock of them was made for the assays performed. Those stocks were kept at -80ºC in FCS inactivated – 10% DMSO. In the process of defrost was rapidly added culture medium to the cells in the cryotube in order to dilute the DMSO in contact with them. Then it was centrifuge 5min. at 1000rpm and resuspended in the appropriate culture medium and conditions (described below).
After the cells reached confluence, they were trypsinized with a 1x trypsin solution in PBS for 2min at 37ºC. To finish take off them medium was added and then centrifuged and counted.
2.6.1. B16 melanoma cell line
For the study of melanoma tumors, the B16 melanoma tumor line was used. It is a non-lymphoid solid tumor that arises spontaneously in C57BL/6 mice. Cells were grown in DMEM media (Invitrogen, USA) supplemented with 10% FCS and 100IU/ml penicillin/streptomycin in a 5% CO2 atmosphere. Different experimental tests have been conducted with this cell line and will be described below.
Subcutaneous injection:
Intravenous injection:
For experimental metastasis assays (n=16), 1x10⁵ B16 cells were injected i.v. in the tail vein of mice anesthetized with Isoflurane. After 15 days, mice were euthanized with Isoflurane, their lungs were removed and the number of metastasis that appeared on the surface of the lung counted by two independent observers.
Effect of rshCD5 and rshCD6 as an adjuvant to chemotherapy:
To study the effect of rshCD5 in the treatment of tumors with chemotherapy, two groups (n=5) of C57Bl/6 WT mice were analyzed. Group 1 mice were injected s.c. at day 0 with 1x10⁵ B16 cells and, starting this day until the end of the experiment, injected i.p. with 25µg of rshCD5 (PX’Therapeutics, France) per mice every 48h. On the third day they also received a single dose of chemotherapy (Vincristine 1mg/kg (Pfizer, USA), Doxorubicin 3.3mg/kg (Pfizer, USA)). Group 2 was treated equally but instead of the rshCD5 treatment they received the same volume of PBS. The tumor growth was measured in both groups up to day 20, when all the mice were euthanized.
The same protocol was followed to study the effect of rshCD6 as a chemotherapy adjuvant, injecting 25µg of rshCD6 instead of rshCD5. In this case the tumor growth was monitored until day 18, when all the mice were euthanized.
2.6.2. RMA-S lymphoma cell line
To verify that the response observed was not specific of the melanoma cell line B16, other tumor models were evaluated, such as the lymphoma cell line RMA-S. These cells were grown in RPMI 1640 (Lonza, Switzerland) supplemented with 10mM HEPES, 2mM Glutamine, 10% FCS, 1mM sodium pyruvate and 100 IU/ml penicillin/streptomycin. To optimize the number of cells to be injected, two concentrations were tested. One group (n=5) of anesthetized C57BL/6 mice was injected s.c. on the dorso with 2x10⁵ RMA-S cells, and the other (n=4) with 5x10⁵ RMA-S cells using a 23G needle. Every two days the tumor growth in vivo was checked and its diameter measured with a Vernier calliper. Upon reaching a certain size the mouse was euthanized with Isoflurane.
2.6.3. MCA 205 sarcoma cell line
two days the tumor growth in vivo was checked and its diameter measured with a Vernier calliper. Upon reaching a certain size the mouse was euthanized with Isoflurane and the tumors extracted and conserved at -80oC for further studies (Cytokines Analysis) or placed in a fixative solution (PBS-4% PFA) for further histological histology studies.
2.6.4 Measurement of cytokines levels in tumor extracts by ELISA
As described before, some tumor samples were preserved at -80 oC in order to analyze their cytokine profile. The protocol used was based on Matalka et al., 2005. Murine IL-1β, IL-6, IL-10 and TNFα were analyzed for each sample. The tumors were homogenized with a tissue disrupter (1mL Dounce Tissue Grinder, Wheaton, USA) in a solution of PBS-0.1% NP40 plus 1x protease inhibitors (Complete, Roche), then centrifuged at 5000 rpm for 15min at 4 oC. 100μL of undiluted sample were analyzed according to the manufacturer’s instructions (Mouse ELISA Set, BDOptEIA, BD Bioscience).
2.6.5. AOM/DSS colon carcinogenesis murine model
A model of cancer of inflammatory origin was also studied, the AOM/DSS model (adapted from Suzuki et al., 2006). Both rshCD5Tg and non-transgenic mice were injected with 20mg/Kg or 10mg/Kg of Azoxymethane (Sigma-Aldrich, USA) in PBS. A week later, the mice’s drinking water was changed to a solution of 3% DSS (MP Biomedicals, LLC, France) in tapwater for four days. Two weeks later, the water was again changed to 3% DSS in water for another 4 days. Ten weeks later the mice were euthanized with Isoflurane and their colons excised, flushed with PBS, cut longitudinally and fixed in PBS-4% PFA to further histological studies.
2.7. Data Analysis
For this study the graphs and statistical analysis were performed in GraphPad Prism 5.03. To compare the different groups studied the unpaired t-student test was used.
The standard curves in Microsoft® Office Excel®.
3. Results
3.1. Genotyping of mice
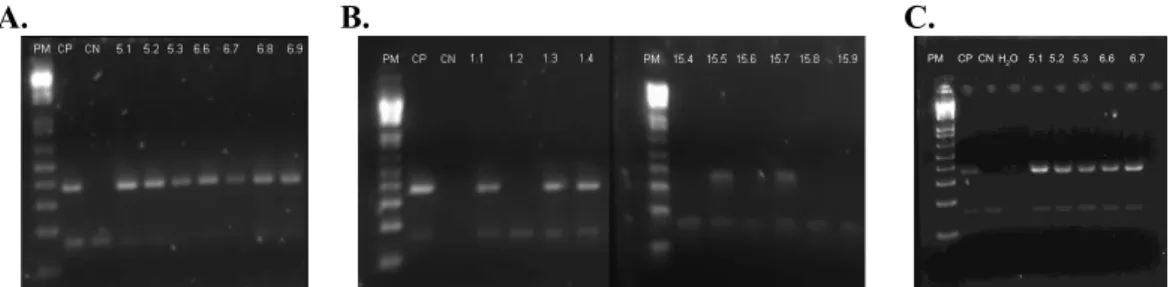
The aim of this study was to further the knowledge of the immunomodulating properties of CD5 and CD6. For these studies, a colony of rshCD5 transgenic mice was generated and maintained. This colony was reviewed once a week and three different breeding crosses made. Once new born mice reached the age of 4 weeks, they were weaned and genotyped by taking a DNA sample from an ear punch. PCR reactions were then carried out, which made possible to determine which mice were transgenic for the rshCD5 gene or non-transgenic by the presence or absence of a 450Kb fragment, respectively (Fig. 3.1). This fragment corresponds to the transgene, as it is amplified by primers specific for the extracellular region of human CD5, inserted into the mice genome. The 150Kb fragment also present in the image corresponds to the internal PCR control, the amplification of the LIEX gene (region of the invariant chain Li of MHC class I), present in all C57BL/6 mice. In Fig. 3.1
A., besides the negative control, all samples are positive, so all mice are rshCD5 trangenic. This was expected because they originate from the crossing of a rshCD5 homozygote male and a transgenic female (homozygote or heterozygote). In Fig. 3.1 B., some samples are positive (1.1, 1.3, 1.4, 15.5, 15.7) and others are negative (1.2, 15.4, 15.6, 15.8, 15.9), as the offspring analyzed comes from the breeding of a rshCD5 heterozygote male and a C57BL/6 WT female. In Fig. 3.1 C., all the samples are positive again, as it can be seen, because the offspring analyzed comes from the crossing of a rshCD5 homozygote male and a C57BL/6 WT female.
A. B. C.
PM CP CN H2O5.1 5.2 5.3 6.6 6.7
PM CP CN H2O5.1 5.2 5.3 6.6 6.7
Fig. 3.1 – Illustration of agarose electrophoresis gels obtained from the DNA screening of rshCD5 transgenic and non-transgenic mice by PCR. The presence of the gene originates a fragment of 450bp and the internal control (Li gene) generates a band of 150bp. The PCR products were separated on a 2% agarose gel containing a
10,000x dilution of SYBR Safe and visualized in a G:Box appliance. A. Offspring of a cross between a
3.2. Validation of the results with transgenic mice injecting rshCD5 in wild-type mice
To confirm that the results obtained in the characterization of the transgenic mice were not due to artifacts of random insertion of the rshCD5 gene, exogenous rshCD5 was administered by i.p. injection to C57BL/6 WT mice. Before use, the biological functionality of the commercial rshCD5 was checked with some experiments.
3.2.1. Confirmation of biological functionality of commercial lots of rshCD5 by ELISA
It has already been shown that rshCD5 binds to conserved components of the fungal cell wall (Vera et al., 2008), so this interaction was verified by ELISA. Before the assay was started, rshCD5 and BSA (negative control to the ELISA) were biotinylated. A Western Blot analysis confirming the biotinylation can be seen in Fig. 3.2, where HSAb is the positive control. The observed molecular weights are the expected for all the samples: rshCD5 – 57KDa, BSA and HSA – approximately 66KDa. CD5b new batch 180 115 82 64 49 37 26 19
BSAb HSAb PM CD5b new batch 180 115 82 64 49 37 26 19
BSAb HSAb PM
Fig. 3.2 – Western Blot confirming the biotinylation of a new batch of rshCD5 and BSA. The biotinylated proteins were separated by SDS-PAGE electrophoresis and analyzed by Western blotting. The Western blot was developed with streptavidin-HRP. From the left, samples include new rshCD5 batch (CD5b new batch), bovine serum albumin (BSAb) and human serum albumin (HSA).Molecular weight markers (PM) are shown in the first lane on the right.
Fig. 3.3 – rshCD5 binding to different yeast wall components. ELISA plates coated with zymosan (ZYM), β -D-glucan and mannan were incubated with increasing amounts (0,05–2 μg) of biotinylated rshCD5. Bound protein was detected with HRP-streptavidin (SAv).
3.2.2. Confirmation of new lot functionality by a sepsis model
Once the rshCD5 was checked in vitro, an in vivo assay was also performed. This experiment is based on the protective role of rshCD5 in Zym-induced septic shock. rshCD5 can interact with Zym and could therefore block its interaction with cell receptors, reducing Zym-induced cell signaling. After a single i.p. dose of rshCD5 (or BSA), a dose of Zym was injected into CD1 or C57BL/6 WT mice. Fig. 3.4 shows that 18h after the Zym challenge, the CD1 mice pretreated with rshCD5 show a better clinical score than the BSA-pretreated mice.
Fig. 3.4 – CD1 mice sensitivity to septic shock induced by zymosan. Septic shock was induced in CD1 mice of 7-9 weeks of age by i.p. administration of ZYM (500mg/kg) after pretreatment with BSA or rshCD5 (25 μg, i.p.) 1 h before infusion of zymosan. 18 hours after injection the individual clinical scores were determined (0 - no symptom, 1 - weak symptoms, 2 - moderate symptom, 3 - severe symptoms; septic shock parameters: lethargy, diarrhea, conjunctivitis and hackles). The bar represents the average of the values from each group (n = 5).
Fig. 3.5 – Inflammatory response 18h after induction of septic shock by zymosan. Septic shock was induced in CD1 mice of 7-9 weeks of age by i.p. administration of ZYM (500mg/kg) to mice pretreated with BSA or rshCD5 (25 μg, i.p.) 1 h before infusion of zymosan. 18 hours after induction of the septic shock the levels of inflammatory cytokines (IL-6) in the serum of mice were analyzed by ELISA. Data are presented as mean ± SD (n = 5).
When the C57BL/6 mice were studied, both groups (rshCD5 and BSA pretreatment) revealed a worse clinical score compared to CD1 mice. However, the rshCD5 group still showed a lower clinical score than the BSA group (Fig. 3.6).
Fig. 3.6 – C57BL/6 WT mice sensitivity to septic shock induced by zymosan. Septic shock was induced in C57BL/6 WT mice of 7-9 weeks of age by i.p. administration of ZYM (500mg/kg) to mice pretreated with BSA or rshCD5 (25 μg, i.p.) 1 h before infusion of zymosan. 18 hours after injection the individual clinical scores were determined (0 - no symptom, 1 - weak symptoms, 2 - moderate symptom, 3 - severe symptoms; septic shock parameters: lethargy, diarrhea, conjunctivitis and hackles). The bar represents the average of the values of each group (n = 5).
The analysis of inflammatory cytokine levels (Fig. 3.7) showed that the rshCD5 group has lower levels of IL-6 and IL-1β than the BSA group.
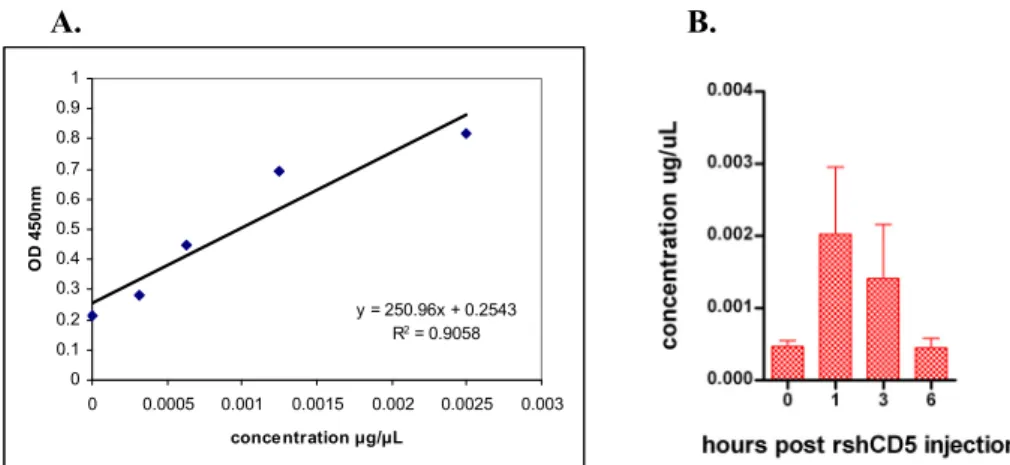
3.2.3 Detection of serum levels by ELISA after rshCD5 injection
To better understand the effect of rshCD5 on clinical scores and cytokine levels, the levels of this protein after infusion were measured in mouse serum. A single rshCD5 dose was administered and serum samples collected at different times. The serum levels of rshCD5 were then detected with a sandwich ELISA. In Fig. 3.8 A. the standard curve performed with known concentrations of commercial rshCD5 is represented, while Fig. 3.8 B. shows the concentrations of rshCD5 detected in serum samples. There appears to be a peak at 1h post administration, which decreases over time until reaching the basal levels at 6h post injection.
A. B.
y = 250.96x + 0.2543
R2 = 0.9058
0 0.1 0.2 0.3 0.4 0.5 0.6 0.7 0.8 0.9 1
0 0.0005 0.001 0.0015 0.002 0.0025 0.003
concentration μg/μL
O
D
45
0n
m
Fig. 3.8 – Detection of exogenously administrated rshCD5 in C57BL/6 WT mice. A. Standard curve performed
with commercial rshCD5. B. Concentration of rshCD5 in C56BL/6 WT mice serum samples at different times
post injection. Data are presented as mean ± SD (n = 3).
3.3. Characterization of lymphocyte populations in mice
3.3.1. rshCD5 transgenic mouse
To further the characterization of the transgenic mice generated in the laboratory, more cellular populations were analyzed.
A. B. C.
Fig. 3.9 – Flow cytometry analysis of T cells in rshCD5Tg and non-transgenic mice. A. Dot plot showing
lymphocyte gating. B. Histogram showing the FITC channel and the FITCB220 negative cells selected. C.
Gating of T cells. Thymus and spleen cells were stained with Abs anti-CD3 and anti-CD3 to identify cells with a double negative (CD3- CD3-), double positive (CD3+ CD3+), and single positive (CD3+ CD3- or CD3- CD3+) phenotype.
The samples were collected from rshCD5Tg and non-transgenic mice thymus and spleen. It is possible to see a tendency for the transgenic mice to possess higher levels of this population than the non-transgenic mice (Fig. 3.10).
A. B.
Fig. 3.10 – Percentage of T cells in lymphocytes. A. Percentage of T cells in thymus lymphocytes (n=3) in rshCD5Tg and non-transgenic mice. B. Percentage of T cells in spleen lymphocytes (n=8) in 7/10 week old rshCD5Tg and non-transgenic mice. The bars represent the average value for each group.
A. B.
C.
Fig. 3.11 – Flow cytometry analysis of MZ cells in rshCD5Tg and non-transgenic mice. A. Dot plot showing
lymphocyte gating. B. Histogram showing the Pacific Blue channel and the Pacific Blue B220 positive cells selected. C. Gating of MZ cells. To identify MZ cells, the samples were stained with Abs CD21 and anti-CD23. MZ cells are CD21high CD23low.
Fig. 3.12 shows that rshCD5Tg mice display a higher percentage of MZ cells than non-transgenic mice littermates.
Fig. 3.12 – Percentage of MZ cells in spleen lymphocytes (n=5) in 7/10 week old rshCD5Tg and non-transgenic mice. The bars represent the average value for each group. The unpaired t-test was performed to compare the differences, * p<0,02.
A. B.
Fig. 3.13 – Flow cytometry analysis of NKT spleen cells in rshCD5Tg mice. A. Dot plot showing the gating of spleen lymphocytes. B. Dot plot showing the double negative, double positive and single positive populations. The samples were stained with Abs anti-NK1.1 and anti-CD3.
There are no apparent differences between rshCD5Tg and non-transgenic mice regarding NK cells, but transgenic mice display a higher percentage of NKT cells (Fig. 3.14).
Fig. 3.14 – Percentage of NKT spleen cells in 7/10 week old rshCD5Tg and non-transgenic mice (n=5). The bars represent the average value for each group.
3.3.2. Effect of rshCD5 and rshCD6 injection in mice
To demonstrate that the presence of rshCD5 was responsible for the phenotype observed in the transgenic mice, exogenous rshCD5 was administered to C57BL/6 WT mice and the percentages of relevant cell populations analyzed.