Jorge André Almeida Barreto
Licenciado em Ciências de Engenharia FísicaGas Gap Heat Switch for CryoFree Project
Dissertação para obtenção do Grau de Mestre em Engenharia Física
Orientadora:
Maria Isabel Simões Catarino, Prof.Auxiliar,
Universidade Nova de Lisboa
Júri:
Presidente: Doutor José Paulo Moreira Santos Arguente: Mestre Soumen Kar
Gas Gap Heat Switch for CryoFree Project
Copyright cJorge André Almeida Barreto, Faculdade de Ciências e Tecnologia, Universi-dade Nova de Lisboa
A
CKNOWLEDGEMENTS
Aproveito nesta página para expressar todos os meus agradecimentos a algumas pessoas que me apoiaram ao longo desta luta.
Começo por agradecer à minha orientadora, ProfaIsabel Catarino, pela oportunidade
de realizar este projeto, todo o tempo disponibilizado e apoio dado ao longo desta disser-tação.
Também quero agradecer ao ProfoGrégoire Bonfait, sempre que possível
disponibili-zou o seu tempo para troca de ideias.
Agradeço também aos meus colegas de laboratório: Patrícia e Gonçalo pela paciência e disponibilidade na resolução de qualquer assunto durante o semestre.
Agradeço à metalomecânicaA. M. Tita, Lda.pela disponibilidade na construção das peças.
Agradeço às oficinas do Departamento de Física, especialmente ao Faustino, pela sua assistência ao longo do projeto.
Agradeço à Sara, do Departamento de Conservação e Restauro, pelo seu tempo dedi-cado na obtenção de imagens de raios X.
Agradeço ainda à Fundação para Ciência e Tecnologia pela bolsa de iniciação científica atribuída, ao abrigo do projeto “Gestão térmica de fonte fria sem fluidos criogénicos“, com a referência PTDC/EMS-PRO/1065/2012.
Por último, mas com maior importância, agradeço à minha família por me ter conce-dido a oportunidade de realizar este curso e todo o apoio incondicional que me deram ao longo destes 5 anos e também aos meus amigos e colegas que me acompanharam nesta caminhada, sem vós teria sido bastante difícil chegar ao fim.
A
BSTRACT
Cryogen-free superconducting magnet systems have become popular during the last two decades for the simple reason that with the use of liquid helium is rather cumbersome and is a scarce resource.
Some available CFMS uses a mechanical cryocooler as cold source of the supercon-ductor magnet. However, the cooling of the sample holder is still made through an open circuit of helium.
A thermal management of a completely cryogen-free system is possible to be imple-mented by using a controlled gas gap heat switch (GGHS) between the cryocooler and the variable temperature insert (VTI). This way it would eliminate the helium open circuit.
Heat switches are devices that allow to toggle between two distinct thermal states (ON and OFF state). Several cryogenic applications need good thermal contact and a good thermal insulation at different stages of operation.
A versatile GGHS was designed and built with a 100µm gap and tested with helium as exchange gas. An analytic thermal model was developed and a good agreement with the experimental data was obtained.
The device was tested on a crycooler at 4 to 80 K ranges. A 285 mW/K thermal conductance was measured at ON state and 0.09 mW/K at OFF. 3000 ON/OFF thermal conductance ratio was obtained at 4 K with helium.
R
ESUMO
Os sistemas de medição de propriedades magnéticas livres de líquidos criogénicos em circuito aberto têm sido populares nas últimas duas décadas devido à escassez de hélio liquido.
Alguns destes sistemas usam um criorrefrigerador como fonte fria do magneto su-percondutor. No entanto, o arrefecimento do porta amostras ainda é feito através de circulação de hélio.
Um controlo térmico de um sistema livre de líquidos em circuito aberto é possível atra-vés da inclusão de um interruptor térmico com hiato a gás de troca entre o criorrefrigerador e o porta amostras.
Estes interruptores são dispositivos que permitem comutar entre dois estados de condução térmica distintos (estados ON e OFF). Várias aplicações criogénicas necessitam de um bom contacto térmico e de uma boa insulação térmica em diferentes fases do processo.
Foi desenhado, construído e testado um interruptor térmico com um hiato de 100µm e testado com hélio como gás de troca. Foi desenvolvido um modelo analítico que mostrou ter boa concordância com os resultados obtidos.
O dispositivo foi testado num criorrefrigerador entre 4 e 80 K. Uma condutância de 285 mW/K foi obtida para estado ON e 0.09 mW/K no OFF. Uma razão de condutância térmica ON/OFF de 3000 foi obtida a 4 K para o gás de hélio.
C
ONTENTS
1 Introduction 1
2 Heat Switches 3
2.1 Gas gap heat switch . . . 4
2.2 Applications . . . 5
2.3 Target application . . . 6
3 Thermal model 9 3.1 Heat transfer . . . 9
3.2 Conduction in gases . . . 13
3.2.1 Viscous flow . . . 13
3.2.2 Molecular flow . . . 15
3.2.3 Combined (or intermediate) flow . . . 16
3.3 Thermal conductivity in solids . . . 17
3.3.1 Lattice Conductivity . . . 17
3.3.2 Electronic Thermal Conductivity . . . 18
4 GGHS prototype 21 4.1 Thermal requirements and adopted solution . . . 21
4.2 Mechanical requirements and adopted solution. . . 25
4.3 Thermal conductance - analytical approach . . . 26
4.3.1 OFF state. . . 26
4.3.2 ON state . . . 27
4.4 Cryo-pump adaptation . . . 29
5 Experimental setup 33 5.1 Mechanical assembly . . . 33
5.1.1 Leak Detection . . . 35
5.1.2 Gas feeding and manifold . . . 36
CONTENTS
5.3 Control and acquisition. . . 39
6 Results and discussion 43
6.1 ON state . . . 43
6.2 OFF state . . . 47
7 Conclusion 51
Bibliography 53
8 Annexes 57
8.1 Thermal conductivity integral of selected materials . . . 58
8.2 RDK-415D cold head capacity map . . . 59
8.3 Thermal conductivity of copper . . . 60
9 Appendices 61
9.1 Technical drawings . . . 61
L
IST OF
F
IGURES
2.1 General scheme of a gas-gap heat switch. . . 4
2.2 Cryocooler application [2]. . . 5
2.3 General scheme of the ESU thermally coupled to cryocooler cold finger by a heat switch [4]. . . 6
2.4 Scheme of the magnet cryostat at Inter University Accelerator Centre (IUAC) New Delhi. . . 7
3.1 Steady-state heat conduction. . . 10
3.2 Comparison between viscous and molecular flow. . . 13
3.3 Low temperature thermal conductivity of some selected gases [7]. . . 14
3.4 Thermal conductance between two parallel surfaces as function of pressure. . 16
3.5 Temperature dependence of the thermal conductivities of Al and Cu of varying purity (expressed as their residual resistivity ratio) [15]. . . 19
4.1 General scheme of a gas-gap heat switch. The arrows indicate the heat path directions used to calculate the thermal resistances. . . 22
4.2 Cutaway of a gas-gap heat switch. . . 22
4.3 Heat conduction elements considered in the thermal model between hot and cold blocks of a gas-gap heat switch [7]. . . 23
4.4 Power (in W) through SS304L betweenTc“4 K andTh“300 K as a function of outer shell diameterISS(in mm) for various lengths (in mm), tube thickness = 100µm.. . . 23
4.5 GapS{Lratio for SS304L as a function of outer shell diameterISS(in mm) for various lengths (in mm). . . 24
4.6 Gas-gap heat switch designed inSolidWorksTM. . . 25
4.7 Gas-gap heat switch designed inSolidWorksTM. From left to right: cold block, hot block and detailed view of alignment rods. . . 25
4.8 Gas-gap heat switch designed inSolidWorksTM. Detailed view of the stopper.. 26
4.9 Analytic curve of the power Q9 through the supporting shell of the switch versus∆T“Thot´Tcold,Tc“4K. . . . . 27
4.10 Analytic curve of the powerQ9 through the switch versus∆T“Thot´Tcoldin the ON state,Tc “4 K. . . 28
LIST OFFIGURES
4.12 Minimum pressuresPONMIN, for Helium-4, to obtain the ON state for various gas temperatures with a 100µm gap. . . 30
4.13 Calculated thermal conductance of the heat switch at 4 K as a function of the pressure. . . 31
4.14 Calculated mean thermal conductance variation of the heat switch forTM “ 4 K and 8 K versus pressure. . . 31
5.1 Photo of the two copper blocks and the stainless shell tube. At right, pieces mounted with alignment rods. . . 33
5.2 Copper blocks after polish.. . . 34
5.3 600 W home-made heating aluminium plate. . . 35
5.4 Heat switch covered with Stycast2850FT as an attempt to repair the leaks. . . 36
5.5 Gas feeding scheme. . . 36
5.6 Manifold. The conductance C1 separates the cold zone from the hot. . . 37
5.7 Gifford-McMahon cryocooler, model:RDK-408D2 [20].. . . 37
5.8 Heat switch coupled to the cold finger. The shell was covered with varnish as an attempt to repair the leaks. . . 38
5.9 Rack with the used apparatus: temperature controller, DC power source and multimeter. . . 39
5.10 Main tab of the virtual instrument panel of theLabVIEWTMprogram used in
this work. This tab includes the values of the temperature, pressure and LOOP 1 & 2. The remaining tabs allows to control the loops and hot block applied power. . . 40
5.11 AgilentTMtab allows to control the power applied to the hot block. The Yoko-gawaTMbox is disabled (not used at this work). . . 40
5.12 CryoConTMtab allows to control the temperature of the cold finger (LOOP 1) and the cryopump (LOOP 2). The PID values can be modified at this tab. The controlled temperature is inserted at the setpoint box. It is also possible to apply a temperature ramp with the desired rate as Kelvin per minute. . . 41
6.1 Temperature of the cold and hot blocks for different heat loads.Tcold “4 K,
sorption pump at 25 K. A stability better than 0.1 K/h was the criterion used. 43
6.2 Power Q9 through the switch versus ∆T “ Thot´Tcold in the ON state for
Helium-4 for different gap lengths and obtained experimental data.Tc “4 K,
sorption pump at 25 K. . . 44
6.3 PowerQ9 through the switch versus∆T “Thot´Tcoldin the ON state for N2
for different gap lengths and obtained experimental data.Tc “70 K sorption
pump at 140 K. . . 45
6.4 Power Q9 through the switch versus ∆T “ Thot´Tcold in the ON state for
Helium-4.Tc “4K, sorption pump at 25 K. . . . 45
6.5 X-ray image obtained of the gas-gap heat switch. . . 47
LIST OFFIGURES
6.6 Temperature of the cold and hot blocks with no heat load applied.Tcold“4 K,
sorption pump at Tsorb = 4.3 K. . . 48
6.7 PowerQ9 through the switch versus∆T“Thot´Tcoldin the OFF state.Tc“4K.
Comparison between dynamic (orange line) and static mode (black data points). 49
8.1 Integral thermal conductivity integral of selected materials (in W/m) [23]. . . 58
8.2 RDK-415D cold head capacity map for 50 and 60 Hz [20]. . . 59
C
H A P T E R1
I
NTRODUCTION
Strong magnetic fields are achieved by using electromagnets, coils circulated by electric current. A 10 Tesla magnetic field is common. Reaching such field implies currents about 100 Ampere. The Joule heating and power consumption on a metallic wire is huge so that the superconducting wire is usually preferred for the coil. This way there is no dissipation as long as the material is kept below a critical temperature to remain at its superconductor state. The production of such field requires maintenance and control of low temperatures. Typically the low temperature superconducting wires are made of niobium alloys and cooled down by a liquid helium bath (4 K). Liquid helium is not only expensive but is also a very limited resource. The recent developments of reliable cryocoolers with some cooling power at 4 K along with the environmental resources issues lead to a trend of substitution of liquid helium baths for cryocoolers as a cold source.
The superconducting coil can be cooled down by a cryocoler with the advantage of autonomy. The same cooler can also be used in parallel for cooling down a sample holder for measurements of magnetic properties, as long as the cooling power that is diverted from the coil doesn’t put in risk the superconducting coil returning to its normal state (resistive). Some “cryogen-free” systems with a variable temperature insert (VTI) along with a cryocooler are now available, but they are not exactly cryogen-free, because these systems are still using a helium flow to the sample. A thermal management of such system is possible to be implemented by using a controlled heat switch between the cryocooler and the VTI. This way it would eliminate the open circuit helium. This was the main work of this dissertation.
CHAPTER 1. INTRODUCTION
state (i.e molecular regime), being the conduction through the gas at this state insignificant. The amount of gas in a GGHS can be managed by using an external pump and a gas reservoir. Or it can be managed by using the sorption properties of an activated charcoal and benefit from a compact and small closed system. This way the actuation of the heat switch is made upon the heating/cooling of a cryopump.
The prediction and planning of the thermal behaviour of the switch is made upon knowledge of the sorption’s properties of the activated charcoal. The main goal is to develop a thermal architecture for a versatile use of one cryocooler that cools down a superconductor coil and a variable temperature insert (VTI). For that, it will be used a gas gap heat switch to cool down the VTI in parallel with the superconducting coil. The inclusion of this heat switch allows the opening of the sample holder without warming up the coil (preventing the quench).
The case study relies on a concrete problem of a 4 K, 6 T cryostat with a VTI that is aimed to be implemented at Inter University Accelerator Centre (IUAC), at New Delhi India, for measurements of magnetic properties [1].
A prototype of a gas gap heat switch was designed, built and characterized in this work, this prototype requirements obey to the IUAC’s specifications.
In this dissertation the operation of heat switches is presented in Chapter 2, the thermal conduction in gases and solids is presented in Chapter3, the designed prototype is presented in Chapter4, the experimental setup is presented in Chapter5and the results with the respective discussion are presented in Chapter6.
C
H A P T E R2
H
EAT
S
WITCHES
Heat switches, known also as thermal switches, are devices that allow to toggle between two distinct thermal states: an ON state, good thermal conduction; and an OFF state, with poor thermal conduction. When a switch is installed in the heat conduction path, the change in thermal conductance can control the temperature of the coupled compo-nent. Heat switches can passively control the temperature of electronic components or instrumentation without the use of thermostats and heaters, thereby reducing power requirements.
Cryogenic applications use heat switches to minimize heat loads on cooling systems by disconnecting components when cooling is not required or disconnecting redundant refrigerators that are not providing cooling or because they have failed or been turned off.
The heat switches are developed according to their applications. Each type is based on different physical principles, ON/OFF thermal conductance ratio, working temperature, also their weight and size and moving parts.
The typical heat switches are:
Mechanical Heat conduction is assured by the physical contact between two plates. Usually the switching is achieved by mechanical action, thermal action or electro-magnetic.
Fluid-loop Thermal commutation is achieved by the variation of a fluid’s flux in a closed loop.
CHAPTER 2. HEAT SWITCHES
2.1
Gas gap heat switch
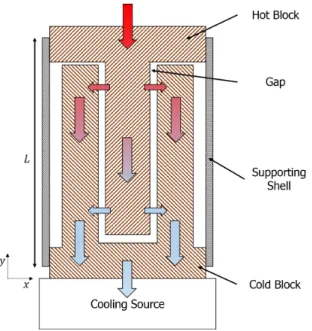
The simplest and most commonly used method of thermally connecting the various parts of a cryogenic apparatus is the gas gap heat switch. These switches are controlled by the gas pressure in the existent narrow gap between two blocks. Usually high thermal conductivity materials are used for the blocks (e.g copper, beryllium...). A supporting shell encloses the gas and supports mechanically these two blocks. This shell should minimize the thermal short-circuit between the blocks and should have a thin wall with a low thermal conductivity material (e.g titanium, stainless steel...), the selected material must also have a good rigidity (Fig.2.1).
Figure 2.1: General scheme of a gas-gap heat switch.
The presence of enough gas inside the heat switch allows a good conduction be-tween blocks, corresponding to the ON state. A low gas pressure results in a poor heat flux through the gap, in a first approximation the heat only passes through the shell, corresponding to the OFF state.
In the ON state, the thermal conductance is pressure independent, inversely to the length of the gap and proportional to the exchange surface between blocks (Sec.3.2). On the other hand, given the absence of gas inside the heat switch, the OFF thermal conductance depends only on the low thermal conductivity material that holds the blocks, since all heat goes through this material.
The management of the gas inside the switch could be assured by a feeding mechanism and an external pump (inducing vibrations) or it can be managed by using the sorption properties of an activated charcoal and benefit from a compact and small closed system. This way the actuation of the heat switch is made upon the heating/cooling of a cryopump. However, their operational temperature range is limited by the gas-sorbent pair ad-sorption characteristics. The gas gap heat switches are customizable, because the same device can work with different gases, corresponding to different settings for both ON and OFF onsets.
2.2. APPLICATIONS
2.2
Applications
The operation of space instruments (e.g infrared sensors) requires cryogenic temperatures. Maintenance of these temperatures depends on heavy cooling systems, many of which utilize mechanical cryocoolers that must be redundant for high reliability. Unfortunately, when a redundant cryocooler is connected to a system but not used, it introduces a large parasitic heat load. A heat switch can significantly improve this situation by thermally disconnecting the backup cryocooler from the system when it is not in use. This disconnect is accomplished by the insertion of a heat switch between each cryocooler and the cold load (see Fig.2.2).
Figure 2.2: Cryocooler application [2].
When the cryocooler is turned on, the heat switch should not limit the available cooling power. On the other hand when it is disconnected it is necessary to have a good thermal decoupling, otherwise an unnecessary parasitical heat load is inserted into the system.
Marland[3] developed a thermal switch which main application was to couple redun-dant cryocoolers to a cryogenic component with minimal parasitic heat load from the non-operating cryocooler. .
Low temperature quiet environments are often necessary in many space technologies, the cooling without vibrations and electromagnetic noise induced by the compressor. In some cases the cryocooler vibrations can be incompatible with very high precision measurements. A solution to this problem would be to stop the cryocooler during the measurements, however this would lead to a rapid temperature increase. To avoid this temperature drift, it is possible to use thermal energy storage unit (ESU) that allows maintaining low temperature after the cryocooler stooping. This acts as a temporary compact cold source in a completely vibration-free environment. An ESU consists in an “enthalpy reservoir” coupled by a heat switch to the cryocooler cold finger (see Fig.2.3).
CHAPTER 2. HEAT SWITCHES
Figure 2.3: General scheme of the ESU thermally coupled to cryocooler cold finger by a heat switch [4].
switch (highly conducting state). In the second phase, the heat switch is opened (OFF state) leading to a thermal decoupling between the cryocooler and the enthalpy reservoir. Due to its high heat capacity or due to its latent heat, the temperature of the reservoir rises really slowly and a vibration-free with no electromagnetic noise cold source is obtained.
An ESU capable of storing 36 Joules between 11 and 20 K is described at [4]. The tests showed that a platform can be stabilized at 19 K during more than 1 h using this ESU. In reference [5] is shown a 36 Joules ESU between 3 and 6 K. A stable 6 K temperature was maintained during more than 50 min in a completely silent environment.
2.3
Target application
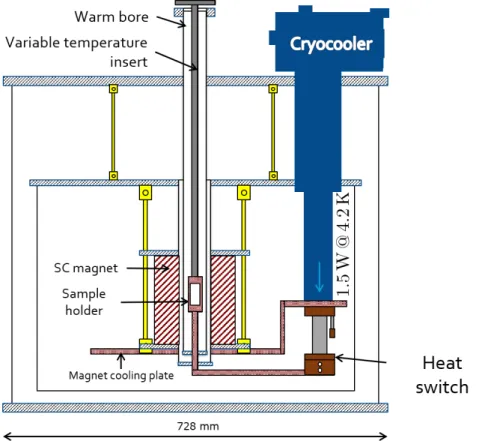
The problem under research concerns the cooling down and maintenance of a cryo-stat equipped with a superconducting coil and a variable temperature insert (VTI), as schematized in Fig.2.4. The VTI holds the sample and the measurement instrument. The superconductor is normally kept at about 4 K while the VTI shall swap from 4 K up to room temperature. Traditionally the cooling of such system is done by a liquid helium bath. Keeping a liquid bath is expensive and the lack of helium is turning on an environ-mental issue also [6]. The idea is to completely replace the circulating helium, by using a cryocooler that serves as a parallel cold source. Such cold source would serve primarily the superconducting coil which can never surpass the critical temperature (4 K in this case). If the temperature of the superconductor rises above this value, it risks losing its properties by getting resistive and the subsequent Joule heating may get disastrous, known asquench. Secondarily the same cold source can use the remnant cooling power for the VTI. The diverting of the cooling power is intended to be made via a gas gap heat switch which
2.3. TARGET APPLICATION
actuation is made with a cryopump. Such cryopump adsorbs gas when cooled down opening the switch and releases gas when warmed up, closing the switch.
The problem was put by the IUAC laboratory (New Delhi) and it is interesting for the implementation of a completely closed cycle cryogenic system for a general purpose superconducting magnetic facilities namely for the magnetic resonance scanning. A closed cycle cryogenic system provides autonomy of the system as long as the electric power exists. Some off-the-shelf “croyogen-free” systems are already available. Nevertheless, when those systems include a VTI they include a flow of helium in an open circuit. The construction and implementation of a heat switch at this system will vanish the helium bath, making this system completely “croyogen-free”.
C
H
A
P
T
E
R
3
T
HERMAL MODEL
This chapter describes the thermal conductivity of gases and solids and its importance in design of a GGHS.
3.1
Heat transfer
Heat transfer consists on the exchange of thermal energy between physical systems at different temperatures. The rate of energy transfer may depend both on temperature and pressure. The fundamental modes of heat transfer are conduction, convection, and radiation.
Convection is heat transfer by mass motion of a fluid such as gases or liquids when the heated fluid is caused to move away from the source of heat, carrying energy with it. Radiation is a method of heat transfer that does not rely upon any contact between the heat source and the heated object as is the case with conduction and convection. Heat can be transmitted though vacuum by thermal radiation. This is a electromagnetic radiation where no mass is exchanged and no medium is required in the process of radiation. All objects with a temperature greater than absolute zero emits thermal radiation.
Heat transfer by conduction is greatly described, due to its importance on the thermal conductance of heat switches.
Consider a cylindrical rod of a material (solid, liquid or gaseous) with its end faces maintained at different temperatures,T1ąT2. The temperature difference causes
CHAPTER 3. THERMAL MODEL
Figure 3.1: Steady-state heat conduction.
The differential form of Fourier’s Law of thermal conduction shows that the local heat flux density,ÝÑq, is equal to the product of thermal conductivity,k, and the negative temperature gradient,´ÝÑ∇T. The heat flux density is the amount of energy that flows through a unit area per unit time.
Ý
Ñq “ ´kÝÑ∇T (3.1)
where (considering the SI units), k is the material’s thermal conductivity, W.m´1.K´1
andÝÑ∇Tis the temperature gradient, K.m´1
. The minus sign is necessary because heat is always transferred in the direction of the decreasing temperature. For many simple applications, Fourier’s Law is used in its one-dimensional form. In thex-direction (e.g. Fig.3.1).
qx “ ´kdT
dx (3.2)
From kinetic theory of gases it is possible to obtain an approximation of the thermal conductivity. This coefficient express the ability of the material to conduct heat. In the example given above, Fig.3.1, consider a slice of this rod with sectionSand lengthλ1and a temperature difference∆Tbetween its ends. The number of particles betweenT`∆T andTis:
N“nλS (3.3)
wherenis the particle density (number of particles per volume unit),Sis the cross section. The number of particles in the positivexdirection with mean velocityvxis,
N`
“ 12nvxτS (3.4)
where τ is the mean free time (time between collisions). Thus, the rate of transfer of particles through a unit area in the positive x direction is,
Φ`
“ 12nvx (3.5)
1λis the mean free path: average of the distances that a particle travels between collisions
3.1. HEAT TRANSFER
Likewise, in the negative x direction the particle flux is,
Φ´
“ ´1
2nvx (3.6)
Consider the energy of each particle is his internal energyǫpTq. Therefore, the energy flux in the positive x direction is,
Φ`
E “
1
2nvxrǫpT`∆Tq ´ǫpTqs (3.7) Expanding the termǫpT`∆Tqfrom Eq.3.7in a first order Taylor series comes ǫpTq ` ∆TdǫpTq{dT, being the term dǫpTq{dT the specific heat of one particle. By definition,
specific heat capacitycis the amount of heat required to change one mole of a substance by one degree in temperature. Then, Eq.3.7can be expressed as,
Φ`
E “
1
2cnvx∆T“ 1
2vxC∆T (3.8)
whereCis the specific heat per unit volume at constant volume (C“c.n). As for the opposite direction, the energy flux is,
Φ´
E “ ´
1
2nvxrǫpTq ´ǫpT`∆Tqs “ 1
2vxC∆T (3.9)
The heat flux density is given by the sum of Eqs.3.7and3.9.
qx “Φ`E `Φ´E “vxC∆T (3.10)
The temperature difference∆Tcan be written as function ofλ“vxτ.
∆T“ dT dxλ“
dT
dxvxτ (3.11)
Since the mean square speed is,
v2“v2
x`v2y`v2z (3.12)
and if the particle flux is isotropic, the mean square speed is,
v2 x “
1 3v
2 (3.13)
Considering Eqs.3.11,3.10and3.13, the heat flux is,
qx “ 1
3C vλ dT
dx (3.14)
Comparing the previous equation with Eq.3.2comes,
k“ 13C vλ (3.15)
CHAPTER 3. THERMAL MODEL
(atoms, electrons). It is used as a first approximation of the thermal conductivity of different materials (solid, liquid or gaseous).
By integrating the differential form Eq.3.1over the material’s total surfaceA, we obtain the integral form of Fourier’s law,
9
Q“ BQ
Bt “ ´k
¿
A Ý
Ñ∇T¨ ÝdSÑ (3.16)
whereBQ{Bt or Q9 is the amount of heat transferred per unit time (in W). When inte-grated for a homogeneous material of one dimension geometry between two endpoints at constant temperature like the cylindrical rod, the heat flow rate is,
9
Q“ ´kS
L∆T (3.17)
whereLis the distance between the ends andSthe cross-sectional surface area. However, this last equation is valid ifkis approximately constant betweenT1andT2(∆T“T1´T2).
From Eq.3.17the following equation can be derived, as long askis constant. Thermal resistanceRis the reciprocal of thermal conductanceK.
K“kS L “
1
R (3.18)
Thus, Eq.3.17written as function of thermal resistanceRor thermal conductanceKis:
9
Q“ ´K∆T “ ´1
R∆T (3.19)
The heat flow can be modelled by analogy to an electronic circuit, where the flow rateQ9 is represented by current, temperature by voltage and thermal resistance by resistance (e.g Fig4.3).
Meanwhile, at most situationskis not constant, it has a strong dependence on temper-ature (vincreases with increasing temperature), thenkpTqmust be integrated fromT1to T2.
9
Q“ SL
żT1
T2
kpTqdT (3.20)
An analytic solution of the integral from Eq.3.20is not convenient to use. Its values for various materials between given temperatures are tabulated (see Annex8.1).
3.2. CONDUCTION IN GASES
3.2
Conduction in gases
The mean free pathλis the average distance traversed by a molecule between collisions. If the distance between collisions is small comparatively to the length of the system (λ!δ) the gas flow is said to be viscous, when this distance is higher it is molecular (λ " δ), or ballistic. At the viscous regime the gas particles collide with each other, making the heat transfer more effective (high conductance), since the hotter particles will transfer constantly energy to the colder ones, this is also called classical conduction.
At the molecular flow the particles basically collide with the walls, because they travel longer without colliding, this regime of conduction is unneffective (low conductance), Fig.3.2, depicts both modes of heat conduction in gases.
Figure 3.2: Comparison between viscous and molecular flow.
3.2.1 Viscous flow
From kinetic theory of gases, mean free path of a particle is:
λ“ 1
nσ (3.21)
wherenis the number of molecules per unit volume andσthe collisional cross section. For an ideal gas the free mean path is:
λ“ RT
NAP
1
σ (3.22)
The mean free path is proportional to temperature and inversely to pressure. Known the root-mean-square speed for an ideal gas:
vrms“
c
3RT
CHAPTER 3. THERMAL MODEL
WhereMis the molar mass. This expression shows that, at a given temperature, lighter molecules move faster than do heavier molecules. Considering expression3.15, the thermal conductivity for an ideal gas comes:
k“ 1
3NAσ
c
3RT
M Cmol (3.24)
WhereCmolis the molar heat capacity, which is constant for an ideal gas. At the viscous
flow the thermal conductivity for an ideal gas is pressure independent, which is important for estimating the thermal conductance of a GGHS. The relation from Eq.3.24also explains why the lighter molecules have higher thermal conductivity, for it decreases as the molar mass increases and it is also proportional to?T, Fig.3.3illustrates the thermal conductivity for several gases as a function of temperature.
Figure 3.3: Low temperature thermal conductivity of some selected gases [7].
Being the cross section not easily obtained, an alternative to estimate the free mean path is possible to obtain. With the same deduction used to obtain the thermal conductivitykit is possibly to obtain the viscosity, which happens to be proportional tok. These viscosity values are tabulated for the most type of gases. Expressing the free mean path in function of viscosity, comes [8]:
λ“3.62ηpTq
P
c
T
M pSIq (3.25)
Where,ηpTqis the viscosity. Known the free mean path, it is possibly to determine the type of gas flow. As explained before, when the free mean path is much smaller than the length (i.e the gas gap) of the system (λ!δ) the gas flow is viscous and at this regime the thermal conductance will be pressure independent, Eq.3.24. This regime also corresponds to the ON state of the GGHS, this is an important result because it allows to quantify the thermal conductivity of different gases, as shown in Fig.3.3.
3.2. CONDUCTION IN GASES
3.2.2 Molecular flow
The molecular flow is achieved when the free mean path is higher than the gap (λ"δ). At this regime the conduction is poor, which is desired in the OFF state, since the gas particles have a long free mean path and they will mainly collide with the walls, .
The heat flow rate, as seen before in Eq.3.17, is proportional to the geometry of the body and to thekobtained at Eq.3.15,
9
Q“ 13C vλS
L∆T (3.26)
The heat capacityCis proportional to the ideal gas constantR, to the number of molecule’s degrees of freedom f and to the particle densityn(n“N{V).
C“n f
2R“
N V f
2R (3.27)
The equation of state of a hypothetical ideal gas is PV “ NkBT. Remind R “ NAkB,
considering the ideal gas equation and the previous relation, the heat capacity is,
C“NAf
2
P
T (3.28)
Since a simple approximation of the heat flow rate at the molecular flow is desired, it is considered that the mean free path is almost equal to the length of the system (λ« L). From Eq.3.23the velocity is proportional toaT{M. So, the heat flow rate from Eq.3.26
becomes proportional to:
9
Q9 P T
c
T M L
S L∆T “
P ?
TMS
∆T (3.29)
From this relation we obtain the heat flow rate in the molecular regime is pressure depen-dent and it doesn’t depend on the length of system (gap length independepen-dent). If a lowQ9
is desired in a switch, it is necessary to achieve a low pressure between the cold and hot walls. The molecular heat flow rate from the kinetic theory of gases is [9]:
9
Q“αS
ˆ
γ`1
γ´1
˙ c
R
8πMT P∆T (3.30)
whereαis the accommodation coefficient andγthe heat capacity ratio (γ“cP{cV).
Remember that in this regime the gas molecules basically strikes with the surfaces. When a gas molecule with a temperatureT1comes from the hot surface it strikes the cold surface
with temperatureT2(T1ąT2), giving up some of its energy when collide. However, the gas
molecule remains at somewhat higher temperatureT2’ than the cold wall, this occurring
CHAPTER 3. THERMAL MODEL
Temperature(K) Helium Nitrogen Air
300 0.29 0.29 0.8-0.9
77 0.42 0.53 1.0
20 0.59 0.97 1
Table 3.1: Accommodation Coefficients for Several Gases at Three Temperatures. From
Cryogenic Process Engineering[9].
3.2.3 Combined (or intermediate) flow
This regime corresponds to the transition between the viscous and molecular flow and it has both contributions, being more complex to obtain a model. Meanwhile the next equation describes somehow this mixed flow:
1
Keff “
1
Km `
1
Kv (3.31)
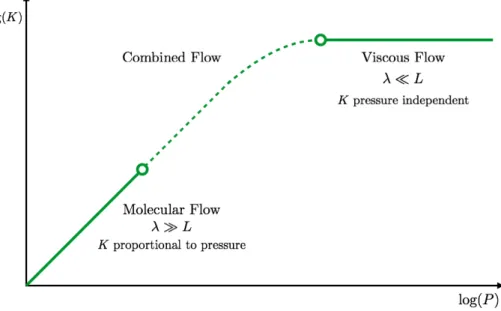
Such equation was empirically proposed byTantos[10], considering small temperature differences of a monoatomic gas and a large radius ratio of the coaxial cylinders. A very good agreement between Eq.3.31and experimental data on a GGHS was reported in [11]. As explained before, an important characteristic of a GGHS is its thermal conductance K (W/K), this isQ9/∆Tfor small∆T. An ON state requires a high thermal conductance, corresponding to the viscous regime and the OFF state aims to low thermal conductance, corresponding to the molecular regime. Both types of flow are represented in Fig.3.4.
Figure 3.4: Thermal conductance between two parallel surfaces as function of pressure.
3.3. THERMAL CONDUCTIVITY IN SOLIDS
3.3
Thermal conductivity in solids
The heat transfer in a solid is due to lattice vibrations (phonons) and to conduction electrons. In pure metals, nearly all heat is carried by the electrons. In impure metals, alloys and semiconductors, an appreciable proportion of the thermal conductivity is due to lattice conduction. In dielectric crystals and amorphous insulating solids, as expected, all the heat is transported by the phonons.
These carriers of heat do not move ballistically from the hotter part of the material to the colder one. They are scattered by other electrons, phonons, defects of the lattice and impurities. The result is a diffusive process which can be described as a gas diffusing through the material (Eq.3.15).
The main scattering processes are phonon–phonon, phonon defect, electron impurity, electron–phonon, or point defects and more rare electron–electron. The thermal resistivity due to the various scattering processes are additive. For the phonons[12],
1
kph “
Rpp`Rpe`Rpi (3.32)
whereRppis caused by phonon-phonon scattering,Rpeby phonon-electron (present only
in metals and electrical conductors),Rpiby scattering from impurities or point defects.
In the case of metals and electrical conductors, for the electrons, the thermal resistivity is,
1
ke “Rei`Rep (3.33)
where Rei is caused by impurity scattering and Rep by scattering from phonons. Since
the number of phonons increases with increasing temperature, the electron–phonon and phonon–phonon scattering processes are temperature dependent. The number of defects is temperature independent and correspondingly, the mean free path for phonon defect and electron defect scattering does not depend on temperature. The global thermal conductivity corresponds to the sum of both heat carriers,kph andke.
3.3.1 Lattice Conductivity
For phonons at temperatures well below the Debye’s2temperature (T!θD) the number of phonons is rather small, consequently the phonon-phonon scattering processes are rare and the phonons which carry the heat are scattered by crystal defects. At this regime the specific heat is proportional toT3[14], being the thermal conductivity at this regime
proportional to:
kph 9Cph 9T3 (3.34)
2The Debye temperature is the temperature of a crystal’s highest normal mode of vibration, i.e., the
CHAPTER 3. THERMAL MODEL
With increasing temperature the phonon-phonon scattering process becomes dominant, since the number of phonons increases with increasing temperature. As consequence the proportion T3 vanishes and the heat capacity tends to stabilize for high temperatures
(C“3R) and so does the heat conductivity.
3.3.2 Electronic Thermal Conductivity
Usually in a metal, the electronic contribution is much larger than the lattice contribution due to the strong difference in the velocity of heat carriers. Again there are two phenomena which produce the scattering of the electrons as heat carriers:
• The lattice may be distorted because of several reasons as vacancies and impurities.
These lattice defects cause the the so-called impurity scattering,Rei. At low
tempera-tures, this thermal resistance is the constant electronic thermal residual resistance typical of metals.
• The other contribution is due to phonons,Rep.
At low temperatures the number of phonons is small and the scattering of electrons from lattice defects and impurities dominates. We obtain a temperature-independent electronic mean free path resulting in the following equation for the electronic thermal conductivity:
ke9Ce9T. (3.35)
At high temperatures, the thermally excited phonons are the limiting scatterers for the heat conducting electrons. Because the number of thermally excited phonons increases with temperature, we find for the electronic thermal conductivity in the electron–phonon scattering region a thermal conductivity which decreases with increasing temperature. Despite the linear increasing of the heat capacity with temperature, the number of colli-sions with phonons also increases, resulting in a reduction of the thermal conductivity with temperature.
Again, there are two scattering processes dominating in different temperature regions and with opposite temperature dependencies. As a result, the electronic contribution to the thermal conductivity also goes through a maximum, as observed at Fig.3.5.
The value and position of this maximum strongly depends on the perfection of the metal. With increasing impurity concentration, the maximum is diminished and shifted to higher temperature (e.g copper in dashed lines in Fig.3.5). In a disordered alloy the scattering of electrons and phonons becomes comparable, no observable maximum (eg. aluminium alloy).
3.3. THERMAL CONDUCTIVITY IN SOLIDS
Figure 3.5: Temperature dependence of the thermal conductivities of Al and Cu of varying purity (expressed as their residual resistivity ratio) [15].
The residual-resistivity ratio (RRR) describes the purity of a metal, it is the ratio of the resistivity of a material at room temperature and at 0 K.
RRR“ ρ300K
ρ0K (3.36)
A perfect metal is free of scattering mechanisms so would expectρ0K“0, which would cause RRR to diverge. However, this doesn’t occur because the defects such as impurities or grain boundaries act as scattering sources at low temperatures, contributing to a temperature independentρ0Kvalue.
C
H A P T E R4
GGHS
PROTOTYPE
This chapter describes all thermal and mechanical requirements to build the gas-gap heat switch. Considering all requirements a solution was adopted. An analytical approach was made, optimizing the geometry for an ON/OFF thermal conductance. The heat switch was designed with a CAD software (SolidWorksTM).
4.1
Thermal requirements and adopted solution
As said before at Chapter 2.3 the Inter University Accelerator Centre (New Delhi) is implementing a cryogen-free apparatus for measuring magnetic properties. A 6 T super-conductor magnet is used and a particular cryocooler acts as a cold source (SRDK 415D), the cooling power as function of temperature is known from the manufacturer data-sheet (1.5 W @ 4.2 K, see Annex8.2). The parasitic heat loads were estimated, so the remaining cooling power could be diverted to the variable temperature insert (VTI).
The estimation of available power is a necessary parameter to develop a gas gap heat switch.
The cryocooler of the IUAC’s lab has a total cooling power of 1.5 W at 4 K. Considering all safety factors, the power needed to keep the superconductor coil working is about 1W, remaining about 500 mW to be diverted to the VTI.
A gas gap heat switch (GGHS) will be thermally connected between the cold finger and the VTI, allowing to close or open this thermal connection. The principal advantage of this configuration is the possibility to open the VTI without warming up the coil. When opening the VTI to the room temperature the heat switch must stay at OFF state. Because at this state the power diverted from the cryocooler will be relatively low, at maximum 0.5 W. With this requirement it is possibly to define the switch’s geometry.
CHAPTER 4. GGHS PROTOTYPE
gap width was chosen to prevent mechanical complications.
A 100µm thin stainless steel supporting shell (SSSS) was chosen to surround the cold copper block, assuring the sealing and centering the two copper blocks. This thickness is also a compromise to insure the mechanical rigidity of this assembly and to obtain a relatively high thermal isolation between the switch ends in the OFF state.
Figure 4.1: General scheme of a gas-gap heat switch. The arrows indicate the heat path directions used to calculate the thermal resistances.
Figure 4.2: Cutaway of a gas-gap heat switch.
From the discussion hold in Chapter3the thermal resistance Rgap(in K/W) is
pro-portional to the pressure in the OFF state, the pressure inside the gap being sufficiently low to assure thatRgapbecomes negligible, being the stainless steel tube the only thermal
conductor at this state. A thermal model used to assist the determination of the thermal conductance is schematized in Fig.4.3, where the pressure dependent gas-gap thermal resistance is drawn as a variable resistor.
With this model, it is possibly to choose a geometry for the stainless steel shell (radius and length). The geometry is defined upon the worst case scenario which is having one side at 300 K and the other at 4 K (i.e. the maximum temperature difference).
4.1. THERMAL REQUIREMENTS AND ADOPTED SOLUTION
Figure 4.3: Heat conduction elements considered in the thermal model between hot and cold blocks of a gas-gap heat switch [7].
The power through the shell is calculated with Eq.3.20. The values for the stainless steel thermal conductivity are found at NIST-Cryogenics Material Properties [16].
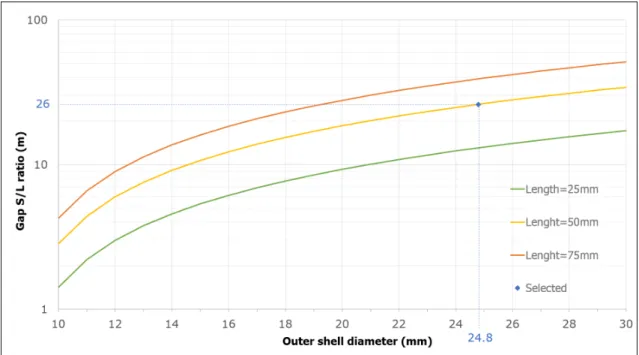
To select the best geometry (outer diameter and length) once the thickness fixed, thermal power was calculated as a function of the outer diameter for various lengths, as represented in Fig.4.4. Since a good ON state is also desired, the ratio of the gap section (S=πLIgap) and length (100µm gap) was calculated, Fig.4.5. This will give an estimation of the conduction optimization for the ON state.
In the OFF state the heat flow direction is along the shell (ydirection) and at the ON state is through the gap (xdirection), check arrows at Fig.4.1. The heat path direction is important to calculate the section to length ratio for both states.
Figure 4.4: Power (in W) through SS304L betweenTc“4 K andTh“300 K as a function
of outer shell diameterISS(in mm) for various lengths (in mm), tube thickness = 100µm.
CHAPTER 4. GGHS PROTOTYPE
The case of a 75 mm length, despite of always checking the power limit for that range of diameters, a long shell lead to a low rigidity tube resulting in a complicated manufacture. Also, it couldn’t fit on the IUAC’s setup.
The selected geometry is at 50 mm length curve with 0.47 W, 24.8 mm for the outer diameter andS{Lratio“26. This configuration lead to less mechanical problems and with reasonable dimensions. On a private communication with the workshop manufacturer this geometry seems reasonably. However the workshopping would bring some uncertainty in the thickness of the stainless steel tube, at maximum it could reach 130µm, so the ordered length was 60 mm to forearm this uncertainty.
From the scheme of Fig.4.1some of the available length of the tube is thermalized at hot and cold blocks considered each as isothermal. Then, some part of this length does not contribute in the conduction, it was defined the effective length is 54 mm (thermal power at extreme∆T“0.44 W).
Figure 4.5: GapS{Lratio for SS304L as a function of outer shell diameterISS(in mm) for various lengths (in mm).
4.2. MECHANICAL REQUIREMENTS AND ADOPTED SOLUTION
4.2
Mechanical requirements and adopted solution
The heat switch consists of two coaxial copper blocks. It was designed to be assembled in aI68 mm flange (as imposed by the diameter of the cryocooler cold finger). The copper blocks were built to guarantee a gap of 100µm. The cold and hot blocks were machined from a cylinder withI68 andI42 mm, respectively.
Figure 4.6: Gas-gap heat switch designed inSolidWorksTM.
The centering of both blocks, the switch sealing and mechanical rigidity are assured by a 100µm thickness wall supporting shell with a outer diameterIout“24.8 mm and a 60 mm length made in stainless steel
To control the gas pressure inside the gap a cryopump was designed and coupled to the cold block (Section4.4) through a stainless steel capillary, Fig.4.6.
The heat switch is filled through the filling capillary at the cold block. The cold block has two holes that makes connection from outside, one hole for the cryopump and other for the filling capillary, Fig.4.6.
Figure 4.7: Gas-gap heat switch designed inSolidWorksTM. From left to right: cold block,
CHAPTER 4. GGHS PROTOTYPE
To guarantee the concentricity of both blocks, the shell fits in a 3 mm step, see Fig.4.7. Also, around this step there is a small pit to assist the deposition of the solder.
To prevent a possible misalignment, which could lead to thermal short-circuit, it was used four alignment rods to maintain the correct position during the soft soldering process, see Fig.4.7.
The alignments rods are removed after soft soldering. Removing the central rod will leave a hole at the cold block: a copper stopper fits the hole, allowing the sealing of the switch, see Fig.4.8.
Figure 4.8: Gas-gap heat switch designed inSolidWorksTM. Detailed view of the stopper.
More detailed info about the dimensions are found in the technical drawings at Ap-pendix9.1.
4.3
Thermal conductance - analytical approach
4.3.1 OFF state
As said before, the OFF state is assured if the pressure inside the switch is sufficiently low to assume that the only material conducting heat is the stainless steel shell.
The chosen shell has aIout“24.8 mm,Iin “24.6 mm and 54 mm effective length. The thermal power through the shell is given by Eq.3.20, rewritten as:
9
QSS“ πpI2
out´ I2inq
4L
żTh
Tc
kSSpTqdT (4.1)
Fig.4.9expresses the power versus∆Tin such a cylinder, the cold side being at 4 K. The values for the thermal conductivity integral were calculated iteratively in Microsoft Excel Visual Basic ProgramR fromkpTqvalues from [16] with the trapezoidal rule:
żTh
Tc
kSSpTqdT« pTh´TcqkSSpTcq `kSSpThq
2 (4.2)
For low temperatures (∆Tď6), the thermal resistance in the OFF state is 11 K/mW (0.09 mW/K). With this configuration we obtain 436 mW for the worst case (4´300 K).
4.3. THERMAL CONDUCTANCE - ANALYTICAL APPROACH
Figure 4.9: Analytic curve of the power Q9 through the supporting shell of the switch versus∆T“Thot´Tcold,Tc “4K.
4.3.2 ON state
In the ON state the heat conduction is done by the gas, copper and shell, in an association as seen in Fig.4.3. Meanwhile the shell thermal conductance is negligible when comparing to the gas (KSS!1%Kgas), so it is ignored on the calculations. The global thermal resistance
in the ON state is:
1
K “
1
Kgas `
1
KCuh
` 1
KCuc
(4.3)
Meanwhile, the previous equation is valid if the heat flux flow is constant through one direction. Given the switch’s geometry it is not trivial to make a series or parallel association between the gas and copper blocks, because the heat flow on the copper blocks varies along the copper length. It can be shown that the effective length to be considered is half the geometrical length as long as the copper thermal resistances are close (i.e. leading to an uniform heat flux in the gas) [7,11] and hence use the association as seen in Fig.4.3. The global thermal conductance was calculated for several temperature differences ∆T1in Microsoft ExcelR. The mean temperatureT
Mwas considered for the determination
of thermal conductivity of the gas and copper, this approximation is valid in the considered intervals. Considering Eqs.3.17and4.3the heat flux for this state comes:
9
QON“
ˆ
1
Kgas`
2
KCu
˙´1
∆T (4.4)
In Eq.4.4,KCuh «KCuc “KCu.
CHAPTER 4. GGHS PROTOTYPE
Also remind that, the thermal conductanceKis proportional to the thermal conductiv-itykand theS{Lratio. For the gas, in SI units, theS{Lratio is 30.43 (considering a gap of 100µm) and for the copper is 7ˆ10´3(considering its half length).
It was selected the Helium-4 because of the temperature range applied (minimum temperature: 4 K), see Fig.3.3. The values for the copperRRR“50 thermal conductivity are found at [16] and for helium gas at REFPROP [17].
IfKCu"Kgasthe heat flux in the ON state depends only on the gas thermal
conduc-tance, because the termK´1
Cutends to zero, as can be verified in Eq.4.4. The curves from
Fig.4.10describes the effect of the copper on the global thermal conductance.
Figure 4.10: Analytic curve of the powerQ9 through the switch versus∆T“Thot´Tcoldin the ON state,Tc“4 K.
On a first approximation the thermal conductance in the ON state is 269 mW/K for the copper curve. A better quality copper, i.e. higher purity, would improve the conduction in the ON state, approximating to the helium curve.
4.4. CRYO-PUMP ADAPTATION
4.4
Cryo-pump adaptation
The amount of gas in the gap of a heat switch can be managed by using the sorption properties of an activated charcoal and benefit from a compact and small closed system. This way the actuation of the heat switch is made upon the heating/cooling of a cryopump. The heating of the cryopump is made with a 1.2 kΩheater resistor and its cooling with the stainless steel capillary thermally coupled to the cold block.
When the cryopump cools down, the thermal energy (kBT) is low (virtually no thermal
agitation) and the molecules prefer to stay at the activated charcoal surfaces by Van der Walls forces. An activated charcoal can adsorb great quantities of gas (having an inner surface of 3000 m2g´1).
Figure 4.11: Cryopump detailed view.
In the OFF state, the power through the gas must be negligible when compared to the power through the shell, this corresponds to molecular flow, which occurs when the mean free path is higher than the length of the gap (λ"δ). The power through the gas is described with Eq.3.30, it was defined that the OFF state is obtained when the gas thermal conductance is 10 times smaller than the shell (KgasďKSSSS{10). It was obtained a pressure POFFMAX“5.3ˆ10´6mbar at 4 K.
On the other hand, the ON state is achieved when there is sufficient pressure inside the gap to obtain a viscous flow between both blocks (λ !δ). As said before, the mean free path is given by Eq.3.25. It was defined that to achieve this state the mean free path has to be at least 100 times smaller than the dimension of the gap (λ ďδ{100) [7]. It is possible to obtain the minimum pressurePONMINfor Helium-4 to achieve the on state for various gas temperatures, Fig.4.12.
CHAPTER 4. GGHS PROTOTYPE
Figure 4.12: Minimum pressuresPONMIN, for Helium-4, to obtain the ON state for various gas temperatures with a 100µm gap.
at 4 K. However the cryopump must be capable to adsorb a amount of gas to obtain 5.3ˆ10´6mbar at 4 K to achieve the OFF state. The amount of adsorbed gasn
ads is:
nads “
ˆP
charge Tamb ´
PMAX OFF Tcold ˙ V R (4.5)
WherePchargeis the charge pressure at room temperatureTamb,POFFMAXmaximum
pres-sure to obtain the OFF state at Tcold,Vthe volume of the switch (including the feeding
mechanism) andRis the ideal gas constant.
Given the charge pressure and cryopump temperature, the amount of adsorbed gas by the carbon in grams of helium per gram of carbon can be obtained by resorting to the experimentally obtainedPTQ2equation of state[18].
A previous cryopump was reused filled with 45 mg of the type “C” activated charcoal [18]. Known the type of coal, the amount of adsorbing need and selected gas, one can conclude that with this amount of charcoal it is possible to achieve the OFF state, i.e., the estimated off pressure.
With Eq.3.31it is possible to calculate the “S” shaped curve, this curve showing the transient conduction regime between ON and OFF states. The estimated values forPMAX OFF
andPONMINare shown in Fig.4.13.
2Three state variables: Pressure (P), temperature (T), and amount of adsorbed gas per amount of adsorbent
(Q)
4.4. CRYO-PUMP ADAPTATION
Figure 4.13: Calculated thermal conductance of the heat switch at 4 K as a function of the pressure.
It is common to represent the heat switch performance by its ON/OFF conductance ratio, this one would be 4700 at 4K.
Remind this curve is representative only for 4 K, the limit values (ON and OFF thermal conductance) vary because the thermal conductivity depends on temperature (e.g Fig.4.14).
Figure 4.14: Calculated mean thermal conductance variation of the heat switch forTM“ 4
CHAPTER 4. GGHS PROTOTYPE
Another important parameter is the cooling time and necessary power to heat up the cryopump: on heating is intended to isolate the cryopump from the cold source, this way it would not be necessary to apply too much power to heat it up. In this case it would be convenient to use a long stainless steel capillary.
As for the cooling, since the cold block is the cooling source of the cryopump, the thermal decoupling can not be too high, otherwise would take too long to cool down. It can be defined a characteristic time of thermalization (τc “ RSSC) where RSS is the thermal
resistance of the stainless steel capillary which connects the cryopump to cold block andC
the heat capacity of the whole cryopump, Fig.4.11.
It can be concluded that an excessive length for the connection cryopump-cold block could largely enlarge the time of cooling. It was selected a capillary with diameters 1.5ˆ2 mm and 30 mm length. For which only 1 mW is necessary for reaching 25 K and about one hour to cool down from 25 to 4 K (τc«70 s).
C
H
A
P
T
E
R
5
E
XPERIMENTAL SETUP
This chapter describes the mechanical assembly of the device including its assembly on the cryocooler used for testing. The control and data acquisition is also briefly described.
5.1
Mechanical assembly
The construction of this switch requires high stringency due to the reduced dimensions of both the gap (100µm) and the thin stainless steel shell (100 µm). The pieces were manufactured in a precision metalwork at A. M. Tita, Lda located at Santa Marta de Corroios. The copper blocks were built in a lathe machine and the shell by electro-erosion. All tolerances were respected, otherwise it would be impossible to obtain a 100µm gap between the copper blocks.
CHAPTER 5. EXPERIMENTAL SETUP
Four stainless steel rods were projected and used to assist the alignment and concen-tricity of both blocks while assembling, as seen in Figs.5.1and5.2.
The shell is jointed to both copper blocks and the capillaries to the cold block. To assure a good brazed joint, the surfaces were polished and cleaned in a ultrasound bath before soft soldering, see Fig.5.2.
Figure 5.2: Copper blocks after polish.
The shell was jointed to the copper blocks with a soft solder, Sn96.5%Ag3.5%melting
point of 221˝
C, assisted with a liquid flux1.
The switch was heated up to approximately 220˝
C in a 600 W home-made heating aluminium plate, see Fig.5.3. After reaching the melting point, the surface to be brazed was wetted with liquid flux and then the filler metal was added. The first solder ring was made in the heavier block (cold block mass: 314 g). After cooling, the switch was flipped and the process was repeated on the other block (hot block mass: 188 g), the previous solder ring not being affected. The liquid flux can be very corrosive and could damage the thin shell, therefore the switch was cleaned up again in a ultrasound bath.
The switch was then heated up to approximately 190˝
C for soldering the filling cap-illaries. It was used a flux-cored soft solder Sn60%Pb40% with a melting point of 180˝C
to joint the capillaries to the cold block. A lower melting point solder was selected so it would not compromise the previous brazing.
At the end, when the switch is soldered, the alignment rods were removed. The central alignment rod goes through the hot and cold block, see Figs.4.7and4.8, leaving a hole at the cold block when removed. A copper stopper (see Appendix.9.1) was built at Physics department workshop and then it was soldered to the cold block with the same flux-cored soft solder used for the capillaries. Since, this was the last soldering, it was made with caution to prevent damaging the previous soldering.
1Solder:Castolin157 and Flux:Castolin157A
5.1. MECHANICAL ASSEMBLY
Figure 5.3: 600 W home-made heating aluminium plate.
After soldering, the surfaces were oxidated so it was necessary to clean the heat switch with nitric acid (10%). To assure a good thermal contact, the surfaces were cleaned (with acetone) and polished (steel wool), paying special attention to the surface of the cold block because this one will be directly attached to the cold finger.
5.1.1 Leak Detection
After soldering, the heat switch would be ready for testing if there are no leaks. The leakage tests were performed with two techniques: Helium-4 vacuum technique and sniffing test, the last one was used to detect the precise location of the leak. The tests were performed with aINFICONR(model: UL1000) helium leak detector.
There were several problems concerning the sealing of the heat switch. Initially the leakage test was performed with the vacuum technique, obtaining a leak rate of
„ 10´3 mbar.L/s, for a good sealing it was considered the gas leak should be inferior
to 2ˆ10´7
mbar.L/s. It was thought the problems came from the solder ring copper-shell. So, the soldering was repeated. Nevertheless the problems persisted, obtaining
„10´4mbar.L/s, the leakage tests were performed with the sniffing test to obtain the
specific location of the leaks.
It was detected several spot leaks along the thin stainless steel tube. Thus, it was considered the shell was practically permeable. The first solution was to cover the shell with VGE-7031 varnish, Fig.5.8. However this solution works temporarily (leak rate:
ă10´7mbar.L/s) because the cycle of cooling/heating eventually causes the varnish to
crack. Still, it was possible to obtain some experimental results.
CHAPTER 5. EXPERIMENTAL SETUP
Figure 5.4: Heat switch covered with Stycast2850FT as an attempt to repair the leaks.
5.1.2 Gas feeding and manifold
The pressure inside the switch was managed by a manifold composed by needle valves (V1 & V5), ball valves (V1-4 & V6-8), vacuum manometers (M1 & M2): piezoresistive and baratronTMcapacitance manometers2, 1 L calibrated volume (volume 1), 50 L helium cylin-der (volume 2), rotary vane pump and two copper “coil” tubes (C1 & C2), as represented in Fig.5.5.
Figure 5.5: Gas feeding scheme.
To test the ON state it is necessary to fill the calibrated volume with a determined pressure and open all the valves (except V4 and V7) to the switch. Before charging, the helium gas went through the conductance C2 which was immersed in a liquid nitrogen bath to purify the gas. Also, several purges were made to obtain a clean environment. The needle valves allows to control the gas flow and to fill the volume (V6) with the desired
2Range:0.1-1000 mbar or 0.001-10 mbar, whenever was necessary the baratron was switched.
5.2. CRYOGENIC ASSEMBLY
pressure. The conductance C1 is long enough and thin to allow a good thermal decoupling from the cold zone to the hot zone, Fig.5.6.
Figure 5.6: Manifold. The conductance C1 separates the cold zone from the hot.
5.2
Cryogenic assembly
A two stage cryocooler was used to test the heat switch fromSHI Cryogenics Group, model RDK-408D2 4K, Fig.5.7Its operation is based in a Gifford-McMahon thermodynamic cycle using compression and expansion cycles of helium.
Figure 5.7: Gifford-McMahon cryocooler, model:RDK-408D2 [20].
CHAPTER 5. EXPERIMENTAL SETUP
Annex8.2). Both stages are inside a stainless steel vacuum chamber, about 10´6mbar is
reached by a turbo pump and its own cryo-pumping made by the cryocooler.
The cold block of the heat switch was smeared with grease (Apiezon) and directly coupled to the cold finger along with 4 screws.
For the temperature measurements threeCernoxTMthin film resistances were used as temperature sensors. They were coupled to the cold and hot blocks and to the cryopump and measured by aCryoConTMtemperature controller, model 34.
To control the temperature of the second stage (i.e. the cold block) a pair of heater resistors controlled in a closed loop from the temperature controller (max. power: 50 W) were used. For the cryopump a 1.2 kΩheater resistor also controlled by another loop from the temperature controller (max. power: 25 W) was used. For the hot block a 1.2 kΩheater resistor controlled by aAgilentTMDC power source with a maximum power of 2 W (50 V),
model E3631A, was used.
The pressure inside the switch was measured through a piezoelectric transducer with a multimeter,KeithleyTM(model 2001), see Fig.5.8.
Figure 5.8: Heat switch coupled to the cold finger. The shell was covered with varnish as an attempt to repair the leaks.
![Figure 2.2: Cryocooler application [2].](https://thumb-eu.123doks.com/thumbv2/123dok_br/16545677.736921/21.892.167.778.383.663/figure-cryocooler-application.webp)
![Figure 2.3: General scheme of the ESU thermally coupled to cryocooler cold finger by a heat switch [4].](https://thumb-eu.123doks.com/thumbv2/123dok_br/16545677.736921/22.892.321.551.136.426/figure-general-scheme-thermally-coupled-cryocooler-finger-switch.webp)
![Figure 3.3: Low temperature thermal conductivity of some selected gases [7].](https://thumb-eu.123doks.com/thumbv2/123dok_br/16545677.736921/30.892.249.602.449.715/figure-low-temperature-thermal-conductivity-selected-gases.webp)
![Figure 3.5: Temperature dependence of the thermal conductivities of Al and Cu of varying purity (expressed as their residual resistivity ratio) [15].](https://thumb-eu.123doks.com/thumbv2/123dok_br/16545677.736921/35.892.295.641.135.639/figure-temperature-dependence-thermal-conductivities-expressed-residual-resistivity.webp)