UNIVERSIDADE DO ALGARVE
DEPARTAMENTO DE CIÊNCIAS
BIOMÉDICAS E MEDICINA
INVESTIGATING THE LOCALIZATION OF AN
AVIAN HAIRY HOMOLOG (C-HAIRY1) PROTEIN
Janine Anselmo Cravo
Tese
Mestrado em Ciências Biomédicas
Trabalho efectuado sob a orientação de:
Professora Doutora Isabel Palmeirim e
Doutora Lisa Gonçalves
“Time is nature’s way of making sure everything doesn’t happen at once.”
UNIVERSIDADE DO ALGARVE
DEPARTAMENTO DE CIÊNCIAS
BIOMÉDICAS E MEDICINA
INVESTIGATING THE LOCALIZATION OF AN
AVIAN HAIRY HOMOLOG (C-HAIRY1)
PROTEIN
Dissertação apresentada à Universidade do Algarve para cumprimento dos requisitos necessários à obtenção do grau de Mestre em Ciências Biomédicas, realizada sob a orientação científica da Professora Doutora Isabel Palmeirim (Departamento de Ciências Biomédicas e Medicina e Centro de Biomedicina Molecular e Estrutural - CBME) e da Doutora Lisa Gonçalves (CBME).
Janine Anselmo Cravo
INVESTIGATING THE LOCALIZATION OF AN
AVIAN HAIRY HOMOLOG (C-HAIRY1) PROTEIN
Declaração de autoria de trabalho
Declaro ser a autora deste trabalho, que é original e inédito. Autores e trabalhos consultados estão devidamente citados no texto e constam da listagem de referências incluída.
Copyright em nome da estudante da UAlg, Janine Anselmo Cravo
A Universidade do Algarve tem o direito, perpétuo e sem limites geográficos, de arquivar e publicitar este trabalho, através de exemplares impressos reproduzidos em papel ou de forma digital, ou por qualquer outro meio conhecido ou que venha a ser inventado, de o depositar através de repositórios científicos e de admitir a sua cópia e distribuição com objetivos educacionais ou de investigação, não comerciais, desde que seja dado crédito ao autor e editor.
AGRADECIMENTOS
Após mais uma etapa na minha vida académica, existem contributos de natureza diversa que não podem e nem devem deixar de ser realçados. Por essa razão, desejo expressar os meus sinceros agradecimentos:
À Professora Doutora Isabel Palmeirim, minha orientadora, por me ter concedido a oportunidade de participar neste projecto. Agradeço o apoio, a confiança, e a partilha do saber que tanto me ajudou na realização deste projecto. Acima de tudo, obrigada pela competência científica, pelo acompanhamento do trabalho, pela disponibilidade e generosidade demonstrada.
À Doutora Lisa Gonçalves que vivenciou comigo todas as alegrias e frustrações, e cuja excelente capacidade critica me guiou durante todo o trabalho e sempre me incentivou a ir mais longe.
Ao Tomás quero agradecer toda generosidade e paciência demonstrada ao longo do desenvolvimento do trabalho e que tanto me ajudou com o seu inglês exemplar.
A todo o grupo de Cronobiologia, do qual orgulhosamente fiz parte. A vocês não vos considero colegas mas também amigos. A todos quero agradecer pelo enorme espírito de equipa e por toda a disponibilidade demonstrada.
À Doutora Raquel Andrade por toda a disponibilidade que sempre demonstrou. À Professora Doutora Solveig, e ao seu grupo por toda a ajuda concedida. A todos os professores funcionários e colegas do CBME pelo apoio prestado, em especial à Doutora Cláudia Florindo pelos ensinamentos e sugestões no campo da microscopia.
Aos meus amigos que sempre presentes me aconselharam, apoiaram e que nunca me deixaram desistir. A vossa presença tornou a todo o meu percurso mais leve.
A toda a família, com um especial agradecimento aos meus pais, que foram e sempre serão o grande pilar que suporta a minha vida. Obrigado por todo o amor incondicional.
ABSTRACT
The embryo segmental pattern is first established with the formation of somites. Somites are embryonic segments of vertebrates, periodically formed in a strict temporal precision, which has been believed to be governed by a biological clock, called the ‘segmentation clock’. In the mid-70s, the “Clock and Wavefront Model” was proposed, predicting the existence of an intracellular clock or oscillator in the presomitic mesoderm (PSM) cells. Several years later, Palmeirim et. al., identified the first molecular evidence of this clock by discovering and characterizing the oscillatory expression of c-hairy1 in the chicken embryo paraxial PSM, which strikingly matched the period of somite formation (90 min).
This present work aims to characterize the chicken Hairy1 protein, and to study its expression both in early embryo stages and chicken embryonic fibroblasts (CEFs). Bioinformatic tools have predicted the biochemical properties, primary and secondary structure, post transcriptional modifications and subcellular localization of c-Hairy1 protein. By western blot were established the optimal working conditions of the customized monoclonal antibody, as well as the expression of the protein in both chick embryos and CEFs. The protein distribution and its subcellular localization in CEFs was assessed by immunofluorescence.
Results of western blot have demonstrated sensitivity of the antibody, although its specificity for c-Hairy1 protein remains debatable. Even more, both immunofluorescence and bioinformatics analysis showed c-Hariy1 to be localized both in nucleus and cytoplasm. Interestingly, it was also demonstrated that the nucleus:cytoplasm ratio distribution varied between cells.
These work’s findings suggest that c-Hairy1 protein holds much investigation potential, and the optimization of the antibody working conditions enables its use for further studies.
Keywords: segmentation clock, chicken embryo, Hes-gene family, c-hairy1, bioinformatics, chicken embryonic fibroblasts
RESUMO
Nos vertebrados, o padrão segmentado do embrião é estabelecido com o aparecimento de unidades metaméricas na mesoderme pre-somítica (MPS), os sómitos, que se formam numa precisão temporal restrita demonstrando um comportamento periódico. Estes originam todas as estruturas segmentadas presentes no animal adulto: vértebras, discos intervertebrais, costelas, a derme das costas e todos os músculos esqueléticos do tronco e membros.
Em meados dos anos 70, foi proposto o modelo “Clock and Wavefront” que previa a existência de um relógio intracelular, ou um oscilador em células da MPS, responsável pela regulação da formação dos sómitos, a somitógenese. Vários anos mais tarde, Palmeirim et al., identificou pela primeira vez uma evidência molecular deste relógio, descrevendo e caracterizando uma expressão oscilatória de c-hairy1 na MPS paraxial de embriões de galinha. Surpreendentemente esta periodicidade correspondia ao período de formação de um par sómitos em galinha (90 min). Vários componentes das vias de sinalização Notch, FGF e Wnt foram, mais tarde, descritos como tendo uma expressão dinâmica semelhante ao de c-hairy1 na MPS de embriões de galinha, ratinho e peixe zebra. Estas vias de sinalização parecem estar interligadas e constituem uma rede complexa de vias oscilatórias envolvidas na somitogénese.
Os genes da família Hes, à qual c-hairy1 pertence, são descritos como alvos da via Notch e funcionam como repressores de transcrição que regulam a proliferação e diferenciação celular. Estes participam em diversos processos do desenvolvimento embrionário, funcionando como relógios biológicos, mas também mantendo o estado indiferenciado de células progenitoras. A desregulação da expressão destes genes tem sido ligada a defeitos do desenvolvimento embrionário e oncogénese.
As proteínas da família Hes possuem três domínios conservados, basic Helix-Loop-Helix (bHLH), Orange e WRPW, que lhes conferem características únicas como repressores e osciladores. A região basic é responsável pela ligação da proteína ao DNA, o domínio Helix-Loop-Helix promove a dimerização, o domínio
Orange actua como selecionador de um possível heterodímero ao qual o factor Hes se liga. O motivo WRPW é responsável pela interação de co-repressores e também funciona como sinal de poliubiquitinização.
Alguns membros da família Hes foram descritos como apresentando expressão oscilatória, quer ao nível do RNAm como da proteína. Tal expressão parece ser auto-regulada por um mecanismo de feedback negativo, em que o homodímero da proteína se liga ao promotor do seu gene, reprimindo-o. Por outro lado, o curto tempo de meia-vida do RNAm e da proteína parece também estar na origem deste fenómeno.
Com o objectivo de caracterizar a proteína c-Hairy1, e estudar a sua expressão em estadios iniciais de embriões de galinha e em fibroblastos embrionários de galinha (FEG), foi requerida a uma empresa a produção de um anticorpo monoclonal contra c-Hairy1. Neste contexto, ferramentas bioinformáticas foram usadas para analisar as propriedades bioquímicas, estrutura primária e secundária, modificações pós-transcricionais, bem como a localização subcelular da proteína c-Hairy1. Por western blot foram estabelecidas as condições funcionais ótimas do anticorpo monoclonal, assim como a expressão da proteína em embriões de galinha e em FEGs. A distribuição da proteína e a sua localização subcelular foi determinado por imunofluorescência.
A análise bioinformática da sequência proteica previu c-Hairy1 como sendo uma proteína pequena com características hidrofílicas. A previsão da estrutura secundária mostrou uma grande percentagem de regiões coil, apresentando algumas hélices-α e folhas-β localizados nos domínios conservados. Tais características podem conferir a c-Hairy1 uma estrutura globular.
A análise de modificações pós-transcricionais usando dois softwares sugeriu vários possíveis locais de fosforilação distribuídos principalmente nas extremidades da proteína. Foram também sugeridas dez cinases capazes de fosforilar estes locais. Um estudo dos da localização subcelular permitiu a identificação de um sinal de localização nuclear conservado nas sequências proteicas de c-Hairy1 e nos seus homólogos, propondo a localização de c-Hairy1
no núcleo. Este estudo revelou ainda dois potenciais sinais de exportação nuclear, sugerindo a exportação de c-Hairy1 para o citoplasma.
Para a optimização das condições de funcionamento do anticorpo monoclonal estabeleceram as quantidades mais apropriadas de proteína purificada e de extractos proteicos a serem carregadas no gel. A sensibilidade do anticorpo monoclonal foi demonstrada pela detecção da banda de peso molecular esperada de c-Hairy1, tanto nos extractos proteicos de embriões e FEGs. Contudo, outras bandas de peso molecular não esperado foram sistematicamente detectadas, apesar do aumento do tempo de desnaturação das amostras. Estas bandas podem ser justificadas por diferentes graus de fosforilação, formação de dímeros, splicing alternativo, isoformas não descritas, e ainda ligação do anticorpo a outras proteínas. Concluiu-se que a especificidade do anticorpo para c-Hairy1 é ainda um tema sujeito a debate. Futuramente, poderá ser realizada uma identificação por espectrometria de massa de forma a garantir que as bandas detectadas correspondem à proteína em estudo.
Os resultados de imunofluorescência, complementados pela previsão bioinformática, mostraram que a proteína c-Hairy1 está localizada tanto no núcleo como citoplasma de FEGs. Estas evidências sugerem um possível shuttle de c-Hairy1 entre o núcleo e citoplasma, possivelmente regulado por diferentes níveis de fosforilação da proteína. No entanto, este mecanismo de shuttle deverá ser validado em estudos futuros.
Os resultados de imunofluorescência revelaram ainda um sinal de fluorescência mais intenso nas bordas celulares em aproximadamente 40% das FEGs analisadas, indicando uma possível interação entre a c-Hairy1 e outras proteínas do citoesqueleto. Em mitose, c-Hairy1 apresentou uma distribuição homogénea na célula, o que poderá reflectir o papel desempenhado por esta como promotor de proliferação celular.
A análise detalhada da localização de c-Hairy1 em 54 FEGs, demonstrou que o rácio de distribuição núcleo:citoplasma variou entre células. Esta variação pode
sugerir uma distribuição dinâmica da proteína, apoiando a ideia da existência do shuttle de c-Hairy1 entre o núcleo e citoplasma.
Este trabalho permitiu estabelecer as condições óptimas de funcionamento do anticorpo contra c-Hairy1, permitindo a realização de novos estudos de caracterização desta proteína a nível da sua expressão e função.
Palavras-chave: Relógio embrionário, embrião de galinha, Hes-gene family, c-Hairy1, bioinformática, Fibroblastos embrionários de galinha.
TABLE OF CONTENTS
Abstract ...vi
Resumo ... vii
Abreviations list ... xiii
Tables list ...xv
Figures list ... xvi
1. Introduction ... 2
1.1. Chicken embryo as a model... 3
1.2. Brief view of avian embryo development stages ... 4
1.3. Somitogenesis and the molecular clock ... 4
1.4. Signalling pathways regulating clock gene oscillations ... 9
1.4.1. Roles of Notch signalling pathway ... 10
1.4.2. Roles of FGF signalling pathway ... 12
1.4.3. Roles of Wnt signalling pathway ... 13
1.5. Hes gene family ... 14
1.5.1. Structural analysis of Hes family proteins ... 14
1.5.2. Hes and Hairy-related transcription factors ... 17
1.5.3. Expression and transcriptional activities of Hes factors ... 17
1.5.4. Hes factors misregulations ... 19
1.6. C-Hairy1 protein and antibody production ... 21
1.7. Aims ... 24
2. Materials and methods ... 26
2.1. Bioinformatic approach... 26
2.1.1. Sequences searches ... 26
2.1.2. Sequences alignment ... 26
2.1.3. Phylogenetic analysis ... 26
2.1.4. Assessment of the physico-chemical properties ... 27
2.1.5. Domain determination ... 27
2.1.6. Phosphorylation sites and kinase prediction ... 27
2.1.8. Prediction of subcellular localization signals ... 28
2.2. Preparation of biological material... 30
2.2.1. Eggs and embryos ... 30
2.2.2. Culture and use of primary chicken embryo fibroblasts ... 30
2.3. Molecular biology... 30
2.3.1. Protein extraction ... 30
2.3.2. Determination of protein concentration ... 31
2.3.3. SDS-PAGE (sodium dodecyl sulfate-polyacrylamide gel electrophoresis) and western blotting ... 32
2.3.4. Immunofluorescence ... 33
2.4. Digital image processing and deconvolution ... 34
2.4.1. Quantification of images ... 34
3. Results ... 37
3.1. Bioinformatic analisys of c-Hairy1 sequence ... 37
3.1.1. Primary structure analysis ... 37
3.1.2. Post-translational modifications ... 38
3.1.3. Secondary structure analysis ... 41
3.1.4. Subcellular localization of c-hairy1 and its homologs prediction... 42
3.2. Assessing the c-Hairy1 antibody specificity and sensitivity ... 48
3.3. Subcellular distribution of c-Hairy1 protein by fluorescence microscopy ... 54
4. Discussion ... 63
4.1. C-Hairy1 is likely to be a globular protein ... 63
4.2. Bioinformatic results suggest a high propensity of c-Hairy1 to be phosphorylated ... 64
4.3. C-Hairy1 is predicted to be localized in both nucleus and cytoplasm ... 66
4.4. The monoclonal antibody recognizes c-Hairy1 protein ... 69
4.5. C-Hairy1 is likely to be expressed differently in chick embryos and cefs ... 71
4.6. Immunofluorescence results indicate a different c-Hairy1 distribuition in nucleus and cytoplasm ... 74
5. Conclusion ... 79
6. References ... 81
ABREVIATIONS LIST
aa Amino acid
ATM Ataxia telangiectasia mutated
bHLH Basic helix-loop-helix
BSA Bovine serum albumin
CEFs Chick embryonic Fibroblasts
Cdc2 Cyclin dependent kinase (Cdk1)
CKI Casein kinase 1
CKII Casein kinase 2
DAPI 4',6-diamidino-2-phenylindole
DIC Differential interference contrast microscopy
DMEM Dulbecco’s modified Eagle’s medium
DNA Deoxyribonucleic acid
DNAPK DNA-dependent protein kinase
EGFR Epidermal growth factor receptor
FBS Fetal bovine serum
FGF Fibroblast growth factor
GRAVY Grand average of hydropathicity
GSK3 Glycogen Synthase Kinase 3
Hes Hairy Enhancer of Split
Hrt Hairy-related transcription factors
INSR Insulin receptor
Lnfg Lunatic fringe
Da Dalton
ĸ-NN k-Nearest neighbor
NES Nuclear export signal
NLS Nuclear localization signals
NCBI National Center for Biotechnology Information
NICD Notch intracellular domain
p38 MAPK p38 Mitogen-activated protein kinase
PBS Phosphate buffered saline
PKA Cyclic AMP dependent protein kinase
PKB Protein kinase B
PKC Protein kinase C
PKG Cyclic GMP-dependent protein kinase
PSM Presomitic mesoderm
RA Retinoic acid
RNA Ribonucleic acid
ROI Region of interest
RSK ribosomal s6 kinase
SD Spondylocostal dysostosis
Src Proto-oncogene tyrosine-protein kinase
SAP18 Sin3-associated polypeptide, 18 kDa
TABLES LIST
Table 1.1 - Number of somites and its periodic formation time in several
organisms. ... 5
Table 1.2 - Compilation of Hes-family genes and its different transcripts described
so far in Human, Mouse, Chicken, Xenopus leavis and Zebrafish. ... 8
Table 1.3 - Comprehensive presentation of the PSM oscillatory genes belonging to
the Notch, FGF and Wnt signalling pathways in mouse, chick and zebrafish. ... 9
Table 2.1 – Specificities and sensitivities for different predictors of subcellular
localization signal programs. ... 29
Table 2.2 – Specificities and sensitivities correspondent to different NucPred score
thresholds. ... 29
Table 2.3 – Measurement of absorbance of serial dilutions of BSA. ... 31 Table 3.1 - Protparam predicted molecular weight, theoretical isoelectric point and
grand average of hydropathicity for c-Hairy1A. ... 37
Table 3.2 - Amino acid composition and respective percentage of c-HairyA. ... Erro! Marcador não definido.
Table 3.3 - Predicted positions of the conserved domains and motifs predicted for
c-Hairy1A ... 38
Table 3.4 - Selected phosphorylation sites predicted by NetPhos (NP) and
DISPHOS (DP). ... 39
Table 3.5 – Kinases that were predicted to phosphorylate c-Hairy1A. ... 40 Table 3.6 – Selection of c-Hairy1A protein homologs obtained from BLASTP and
its respective accession codes, E-value and maximum identity of the alignment. . 43
Table 3.7 - Prediction of subcellular localization of c-Hairy1 homologs. ... 44 Table 3.8 – Comparison of NetNES predicted nuclear export sequences (NESs)
with consensus NES motifs in c-Hairy1 protein and homologs. . ... 46
FIGURES LIST
Figure 1.1 - Representation of the somitogenesis, molecular clock and
determination front concept. ... 6
Figure 1.2 - Somitogenesis molecular clock.. ... 7
Figure 1.3 – Model of Notch, c-Hairy1/2 and Lnfg feedback loop mechanism. ... 11
Figure 1.4 – Schematic representation of Hes family proteins conserved domains, and their main functions. ... 15
Figure 1.5 – Schematic representation of Hes auto feedback regulation... 18
Figure 1.6 - Active and passive repression of Hes1. ... 19
Figure 1.7 - Test of the polyclonal antibody against c-Hairy1.. ... 22
Figure 1.8 - Test for specificity of several hybridomas supernatants against hairy 1, in chick embryo extracts and purified protein.. ... 23
Figure 2.1 – Graphical representation of the standard curve of BSA dilutions.. .... 31
Figure 2.2 – Representation of the selection of a ROI of a whole cell and its nucleus. ... 35
Figure 3.1- Graphical representation of the total phosphorylation sites predicted by NetPhos and DISPHOS and the ones with score higher than 0,5. ... 39
Figure 3.2 - Distribution of the predicted phosphorylation sites and their specific kinases.. ... 41
Figure 3.3 - C-Hairy1A secondary structure, surface accessibility and phosphorylation sites. ... 42
Figure 3.4 – Phylogenetic tree of c-Hairy1A homologs. ... 43
Figure 3.5 – Multiple alignment of c-Hairy1 colored for the presence of NLS.. ... 45
Figure 3.6 - NetNES prediction of the Hairy homologs.. ... 47
Figure 3.7 - Determination of the most appropriate loading amount of purified protein for c-Hairy1 detection by western blot.. ... 49
Figure 3.8 - Determination of the most appropriate loading amount of embryo protein extract for c-Hairy1 detection by western blot.. ... 50
Figure 3.9 - Determination of the most appropriate loading amount of CEFs protein extract for c-Hairy1 detection by western blot.. ... 51
Figure 3.10- Determination of the most appropriate denaturation time for c-Hairy1
detection by western blot.. ... 52
Figure 3.11- Detection of c-Hairy1 in embryo and chick embryo fibroblasts (CEFs)
by western blot.. ... 53
Figure 3.12 – Test for secondary antibodies unspecific staining by western blot.. 54 Figure 3.13 - Subcellular distribution of c-Hairy1 protein by fluorescence
microscopy of chicken embryonic fibroblasts. ... 56
Figure 3.14 - Distribution of c-Hairy1 protein at cell’s leading edges by
fluorescence microscopy of chicken embryonic fibroblasts.. ... 57
Figure 3.15 – Expression of c-Hairy1 protein in mitotic cells by fluorescence
microscopy of chicken embryonic fibroblasts ... 58
CHAPTER 1
1. INTRODUCTION
Life itself is a complex, intertwining and extraordinary process, full of wonder to unveil, and questions to answer. For instance, how does a single cell become a complete individual? The more we discover about the mechanism that regulates life, the more we realize that there are so many points and steps that can go wrong.
Multicellular organisms do not spring forth fully formed. Rather, they arise by a relatively slow process of progressive change. In almost all cases, the development of a multicellular organism begins with a single cell, called the fertilized egg, or zygote, which divides mitotically to produce all the cells of the body (Alberts et al., 2007). The study of animal development from fertilization to birth has traditionally been called embryology, however development does not stop at birth or even at adulthood. In fact, most organisms never stop developing and so the subject responsible for studying embryonic and other development processes is called developmental biology (Gilbert, 2010). Developmental biology is one of the most exciting areas in biology, as it integrates anatomy, physiology, genetics, biochemistry and cellular and molecular biology. It too deals with fascinating biologic events, such as changes in form, structure and function of the organism (Tuan and Lo, 2000). As the embryos go through growth and differentiation, there are three well known dimensions that grant a field for their growth, but the mechanisms underlying the processes of life have to be performed in a synchronicity of events, so time can be considered as the fourth dimension (Andrade et al., 2007). This can lead us to the question, how is temporal control achieved? Biology takes advantage of animal models to answer this and many more questions.
Every model has some characteristics that are more or less advantageous to study a particular question. The models which are most commonly used in development include the nematode Caenorhabditis elegans, the fruit fly Drosophila melanogaster, the zebrafish Danio rerio, the South African clawed toad frog Xenopus laevis, the chicken Gallus gallus, and the mouse Mus musculus (Tuan
and Lo, 2000). Of these, the chicken was the first model be used in developmental studies, and there can be found reports which dates back to ancient egyptians (Stern, 2005).
1.1.
CHICKEN EMBRYO AS A MODEL
For a long time the chick embryo (Gallus gallus) has been used in different areas in biology, it has a distinguished history as a major model system in developmental biology, and has also contributed with major concepts to immunology, genetics, virology, cancer, and cell biology (Siegel et al., 2006; Stern, 2005)
Chick embryo gives advantages over other embryo models in embryology since the chicken egg is inexpensive, accessible all year, and can be purchased in any specified quantity. Chicken eggs can be incubated to any stage of interest, which facilitates designing an experiment that requires specific stages of development. When the egg is laid, the avian embryo consists of a flat, two-layered blastoderm that lies on the surface of the yolk and, therefore, is readily accessible for experimentation (Gilbert, 2010). Chick development occurs with incubation at 38°C, and the period of incubation is about 21 days, after which the egg will hatch. Experimental design and timely data collection gets easier with such rapid development. Cultures in ovo and ex-ovo (removed from the shell) can be performed during the period of early development when so much is occurring. Two great advantages of this model are its semitransparency, making viewing of internal tissues possible under the microscope, and their sufficient size that allows several types of micromanipulation at these early stages. Due to its many advantages, there are many detailed experimental studied on the chick embryo, in which its availability adds to the value of chick embryos as a model system for studying development (Tuan and Lo, 2000).
Because the chick embryo forms most of its organs in ways very similarly to those of mammals, it has often served as a surrogate for human embryos (Gilbert, 2010). As so, all the great advances and discoveries in chick have relevance for
other vertebrates, including mammals, and some have brought about dramatic changes in fundamental understanding of development itself (Siegel et al., 2006).
1.2.
BRIEF
VIEW
OF
AVIAN
EMBRYO
DEVELOPMENT STAGES
In embryonic development there are some common stages to all vertebrate species known. The fertilization is the first step and gives rise to the process of development. Immediately following fertilization, a series of extremely rapid mitotic divisions occurs wherein the enormous volume of zygote cytoplasm is divided into numerous smaller cells, by a phenomenon called cleavage. These smaller cells are called blastomeres, and they generally form a sphere known as a blastula, by the end of cleavage. Once the rate of mitotic division has slowed down, the blastomeres go through dramatic movements where they change their positions relative to one another. At this point, the embryo is now in the process of gastrulation and is said to be in gastrula stage. As a result of gastrulation, the embryo ends up with three germ layers: the ectoderm, the endoderm, and the mesoderm. Once the three germ layers are established, the cells interact with one another and rearrange themselves to produce tissues and organs. This process is called organogenesis. Many organs contain cells from more than one germ layer, and it is not unusual for the outside of an organ to be derived from one layer and the inside from another (Gilbert, 2010).
1.3.
SOMITOGENESIS AND THE MOLECULAR
CLOCK
One of the major tasks of gastrulation is to create a mesodermal layer between the endoderm and the ectoderm. A localized and specialized region of the embryo is established during gastrulation, and has a role of an organizer. In avian it is called Hensen’s node and is found at the rostral end of primitive streak, which is the major structural characteristic of avian, reptilian, and mammalian gastrulation (Darnell et al., 1999; Gilbert, 2010). As the primitive streak regresses and the
neural tube folds, beginning to gather at the center of the embryo, somitogenesis is initiated (Gilbert, 2010). Somitogenesis is a periodic and sequential process, wherein each successive bilateral somite pair segregates at a regular time interval from the anterior end of the pre-somitic mesoderm (PSM) as the body axis elongates (Oates et al., 2012).
Somites consist of epithelial spheres of cells and, although these are transient structures, they are of extreme importance for organizing the segmental pattern of vertebrate embryos (Figure 1.1A). These structures are the earliest manifestation of the segmental pattern of the adult vertebrate body and give rise to the vertebrae and ribs, the dorsal dermis, the skeletal muscles of the back, body wall and limbs (Andrade et al., 2007; Gilbert, 2010). Interestingly, the intervals of each somite formation and the total number of somites formed are intrinsic to the species (Described in Table 1.1) (Andrade et al., 2007). This periodic event, somite segmentation, has been believed to be governed by a biological clock, called the ‘segmentation clock’. In the mid-70s, the “Clock and Wavefront Model” was proposed, and it predicted the existence of an intracellular clock or oscillator in the PSM cells, which temporal periodicity turns into the spatial periodicity of somites (Cooke and Zeeman, 1976). In this model, the wavefront represents the anterior to posterior progression of development of the embryo. Thus, this wavefront governs the maturation of the PSM to become somites. In this sense, a somite unit forms only in the presence of two conditions, the wavefront of maturation must reach a group of cells who are at the appropriate phase of the clock. This model postulates that somite size is regulated by the speed of the wavefront while the rate of somite formation is controlled by the frequency of the oscillator (Gibb et al., 2010).
Table 1.1 - Number of somites and its periodic formation time in several organisms. Specie Total number of somite pairs
formed
Time intervals
Zebrafish 30 (Stickney et al., 2000) 30 min (Stickney et al., 2000)
Chick 52 (Andrade et al., 2007) 90 min (Andrade et al., 2007)
Mouse 65 (Tam, 1981) 120 min (Bessho and Kageyama, 2003)
Several years later, molecular evidences supporting both the intrinsic clock and the wavefront were reported (Andrade et al., 2007). For instance, it has been described that the wavefront relies on an intersection of gradients and cross regulatory activities of three transduction pathways, namely FGF (fibroblast growth factor), Wnt and Retinoic acid (RA). Therefore, the determination front is delimited by the intersection of these three gradients, and it denotes the position where the PSM is already committed (Figure 1.1B). As for the molecular oscillator the first evidence came in 1997, when Palmeirim et. al, reported the periodic expression of the avian homolog of the Drosophila segmentation gene hairy, in chick embryo PSM. Chick hairy1 gene was shown to be cyclically expressed in PSM cells, with the same periodicity as somite formation (90 min). This was the first example of the molecular oscillator working in embryos (Bessho and Kageyama, 2003), and it became known as the segmentation clock.
Figure 1.1 - Representation of the somitogenesis, molecular clock and determination front concept. A: Illustration of a HH10 chick embryo, highlighting its
major structures. Epithelial Somite pairs are periodically formed from the anterior most tip of the PSM in an AP manner, and due to new entrance of cells from the tailbud region, the embryo elongates posteriorly. B: Enlarged view of posterior embryo highlighting determination front (DF), situated more or less in the two third level of the PSM. This
illustration indicates as well the three gradients by which the determination front is defined, Retinoic Acid (RA) FGF/p-ERK and Wnt. New somites are formed every 90 minutes, having the notion of time and space which are provided respectively by the molecular clock and the determination front. Elongation is made in an Anterior Posterior manner. The forming somite is represented as S0 and the fully formed somites as SI to SIV. Adapted from (Sheeba, 2011).
Chick hairy1 starts to be expressed rhythmically as early as gastrulation (Jouve et al., 2002), and when the embryo elongates and PSM starts to form, it shows a very particular expression pattern, since it resembles a wave sweeping the PSM in a posterior-to-anterior direction (Figure 1.2). Each cycle of expression goes through 3 different phases. In phase I, hairy1 appears in the large caudal domain, filling about 70% of the posterior PSM and in the anterior PSM it can be detectable a narrow stripe that marks the position where the future somite will form. In phase II, while the anterior stripe is maintained, the caudal expression of hairy1 disappears and it seems to shift anteriorly. In phase III, hairy1 expression shifts to the anterior PSM, corresponding to about one somite-length. Simultaneously, a new caudal domain arises which corresponds to the phase one of the next cycle of expression (Palmeirim et al., 1997).
Figure 1.2 - Somitogenesis molecular clock. Illustration of chick PSM, and
representation of the three phases, by which is defined a cycle of c-hairy1 expression, which take place in every 90 minutes. Individual cells over time, turn on and of the gene. This dynamic expression at the level of single cells, by virtue of being synchronized across the PSM, results in kinematic ‘waves’ of gene expression that ‘move’ across the PSM. Adapted from (Gibb et al., 2010).
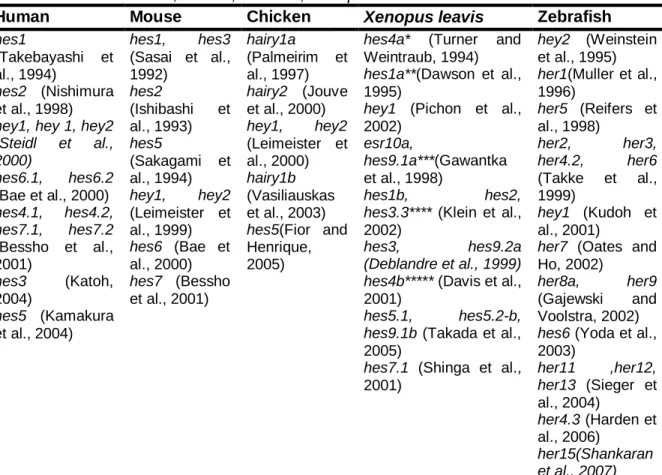
After c-hairy1 discovery, several more genes were found to be dynamically expressed in the PSM with cycling times equal to the time taken to form one somite (Andrade et al., 2007; Baker et al., 2006; Dequéant et al., 2006; Krol et al., 2011), these genes included not only components of the Notch signalling pathway, but also Wnt and FGF components (Dequéant et al., 2006; Krol et al., 2011). It is now evident that the molecular events underlying somitogenesis are highly conserved among vertebrates, since periodic gene transcription has also been described in other animal models used in Developmental Biology - mouse, zebrafish, frog and medaka (Andrade et al., 2007). Several homologs of the c-hairy1 have been identified in humans, and other mammals, as well as frogs and zebrafish, these include not only other hairy or Enhancer of split (E(spl), but also hairy/E(spl) (hes), hairy/E(spl)-related (her) and hairy/E(spl)-related with YRPW motif (hey) genes (Table 1.2).
Table 1.2 - Compilation of Hes-family genes and its different transcripts described so far in
Human, Mouse, Chicken, Xenopus leavis and Zebrafish.
Human Mouse Chicken Xenopus leavis Zebrafish
hes1
(Takebayashi et al., 1994)
hes2 (Nishimura
et al., 1998)
hey1, hey 1, hey2 (Steidl et al., 2000) hes6.1, hes6.2 (Bae et al., 2000) hes4.1, hes4.2, hes7.1, hes7.2 (Bessho et al., 2001) hes3 (Katoh, 2004) hes5 (Kamakura et al., 2004) hes1, hes3 (Sasai et al., 1992) hes2 (Ishibashi et al., 1993) hes5 (Sakagami et al., 1994) hey1, hey2 (Leimeister et al., 1999) hes6 (Bae et al., 2000) hes7 (Bessho et al., 2001) hairy1a (Palmeirim et al., 1997) hairy2 (Jouve et al., 2000) hey1, hey2 (Leimeister et al., 2000) hairy1b (Vasiliauskas et al., 2003) hes5(Fior and Henrique, 2005)
hes4a* (Turner and Weintraub, 1994)
hes1a**(Dawson et al.,
1995)
hey1 (Pichon et al.,
2002)
esr10a,
hes9.1a***(Gawantka
et al., 1998)
hes1b, hes2, hes3.3**** (Klein et al.,
2002)
hes3, hes9.2a (Deblandre et al., 1999) hes4b***** (Davis et al.,
2001)
hes5.1, hes5.2-b, hes9.1b (Takada et al.,
2005)
hes7.1 (Shinga et al.,
2001) hey2 (Weinstein et al., 1995) her1(Muller et al., 1996) her5 (Reifers et al., 1998) her2, her3, her4.2, her6 (Takke et al., 1999) hey1 (Kudoh et al., 2001)
her7 (Oates and
Ho, 2002)
her8a, her9
(Gajewski and Voolstra, 2002)
hes6 (Yoda et al.,
2003) her11 ,her12, her13 (Sieger et al., 2004) her4.3 (Harden et al., 2006) her15(Shankaran et al., 2007)
* - Previously named hairy2a; ** - Previously named hairy1; *** - Previously named esr9 ; **** - Previously named esr2;**** Previously named hairy2b;****
1.4.
SIGNALLING
PATHWAYS
REGULATING
CLOCK GENE OSCILLATIONS
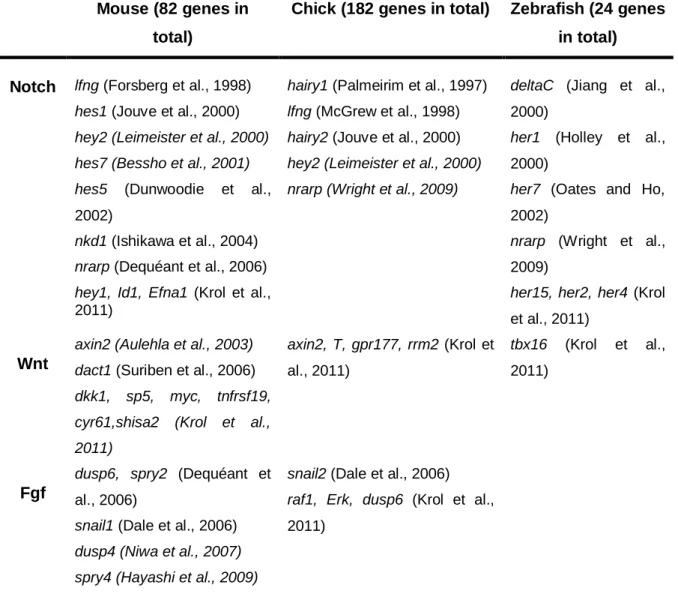
In addition to the oscillation of hes-related (hairy/Enhancher of split) genes, other Notch, Wnt and FGF pathway components have been identified to have a similar dynamic expression in the PSM (Andrade et al., 2007; Gibb et al., 2010). These genes were identified both by classical method (Andrade et al., 2007) and by microarray analysis in mouse, chick and zebrafish (Dequéant et al., 2006; Krol et al., 2011) (Table 1.3).
Table 1.3 - Comprehensive presentation of the PSM oscillatory genes belonging to the
Notch, FGF and Wnt signalling pathways in mouse, chick and zebrafish.
Mouse (82 genes in total)
Chick (182 genes in total) Zebrafish (24 genes in total)
Notch lfng (Forsberg et al., 1998) hes1 (Jouve et al., 2000) hey2 (Leimeister et al., 2000) hes7 (Bessho et al., 2001) hes5 (Dunwoodie et al.,
2002)
nkd1 (Ishikawa et al., 2004) nrarp (Dequéant et al., 2006) hey1, Id1, Efna1 (Krol et al.,
2011)
hairy1 (Palmeirim et al., 1997) lfng (McGrew et al., 1998) hairy2 (Jouve et al., 2000) hey2 (Leimeister et al., 2000) nrarp (Wright et al., 2009)
deltaC (Jiang et al.,
2000)
her1 (Holley et al.,
2000)
her7 (Oates and Ho,
2002)
nrarp (Wright et al.,
2009)
her15, her2, her4 (Krol
et al., 2011)
Wnt
axin2 (Aulehla et al., 2003) dact1 (Suriben et al., 2006) dkk1, sp5, myc, tnfrsf19, cyr61,shisa2 (Krol et al., 2011) axin2, T, gpr177, rrm2 (Krol et al., 2011) tbx16 (Krol et al., 2011) Fgf
dusp6, spry2 (Dequéant et
al., 2006)
snail1 (Dale et al., 2006) dusp4 (Niwa et al., 2007) spry4 (Hayashi et al., 2009)
snail2 (Dale et al., 2006) raf1, Erk, dusp6 (Krol et al.,
Dequéant’s microarray showed not only a large number of genes cycling in mouse PSM, but also that the FGF and Notch components were activated in parallel and were cycling in phase, while genes belonging to the Wnt pathway exhibit an opposite cycling phase to the Notch/FGF pathway components (Dequéant et al., 2006). These signalling pathways seem to interconnect and constitute a complex oscillating signalling network involved in somitogenesis (Aulehla and Pourquie, 2008).
To date, most of the genes identified as cycling belong to Notch signalling pathway, and among these, it seems that only hairy-related genes have the property of oscillating universally among various species (Bessho and Kageyama, 2003).
Currently, with the knowledge gathered it is possible to observe a great interconnection of these Notch, FGF and Wnt signalling pathways. However, the search for the upstream pacemaker of the segmentation clock remains in open, and is essential to reach a full understanding of the nature and biological relevance of the somitogenesis clock (Andrade, et al 2007).
1.4.1.
ROLES OF NOTCH SIGNALLING PATHWAY
Notch signalling is an intercellular communication pathway mediated by the interaction between the Notch receptors (Notch 1-4) with their ligands (Delta or Serrate1 & 2/Jagged1 & 2) by direct cell-cell interaction. When binding occurs, a multiprotein complex containing Presinilin1/ Presinilin2 performs a proteolytic cleavage of the Notch Intracellular Domain (NICD) (Fortini, 2002). NICD is then released from the membrane region and able to translocate into the nucleus, where it converts the DNA-binding transcription factor RBPjk from a repressor to an activator, forming a complex with it, and activates the transcription of its target genes, such as hes and hey genes (Kageyama et al., 2010; Shimojo et al., 2008).
The mechanism by which cell intrinsic cyclic expression is generated has been deeply analyzed. Strikingly, autoregulatory feedback loops seem to be one of the main mechanisms by which the oscillations of these genes activity are generated, alongside with short lived mRNA and proteins. In fact, several downstream targets
with oscillatory expression are known inhibitors of the pathways that induce their expression. Such simple feedback mechanisms can generate oscillations, provided the presence of a delay in the process (Aulehla and Pourquie, 2008). Dale, et, al (2003) first identified a negative feedback loop acting in the chick PSM, in which lfng (Lunatic fringe is a Notch target gene encoding glycosyltransferase that modulates Notch signalling will act, in turn, to inhibit Notch signalling and thus regulate lfng’s own expression. In this model, the NICD domain, after translocated to the nucleus, will activate hairy1, hairy2 and lfng genes. Lnfg protein modifies Notch, which becomes less sensitive to activation by Delta, yet it’s a transient and periodic effect due to the short life and rapid turnover of the Lfng protein. Oscillations are thus generated by alternation between activation of lfng expression and repression of Notch by Lfng. The influence of NICD on lfng exerted via hairy genes will be delayed relative to the influence exerted directly, and this phase shift can, in principle, allows the two influences to act in synergy (Giudicelli and Lewis, 2004).This study proposed that this negative feedback loop involving these genes represents a core component of the avian segmentation clock mechanism (Giudicelli and Lewis, 2004) (Figure 1.3).
Figure 1.3 – Model of Notch, c-Hairy1/2 and Lnfg feedback loop mechanism. Notch
signalling activates cyclic gene transcription of lfng and c-hairy1/2. Lnfg protein will in turn modulate Notch, which becomes less sensitive to activation by Delta, inhibiting Notch signalling. The proteins c-Hairy1/2 will inhibit lfgn transcription, having an indirect influence on lfng via Notch signalling. Adapted from (Giudicelli and Lewis, 2004).
Although generating gene oscillations is an intrinsic property of individual PSM cells and tissue (Masamizu et al., 2006; Palmeirim et al., 1997), several studies demonstrated an out of synchronicity of hes1 oscillations in dissociated PSM cells, and a necessity of cell-cell contact for synchronized oscillations (Maroto et al., 2005; Masamizu et al., 2006). Hirata, et. al (2002) demonstrated a Delta1 mediated synchronization of hes1 cycles, which are evident as mouse cell lines exposed to Delta1 expressing cells maintained a synchronous expression of hes1, which otherwise presented out of synchrony expression, pointing Notch signalling responsible in synchronizing gene oscillations between neighbouring PSM cells (Jiang et al., 2000). Many other studies in zebrafish either using genetic or chemical inhibition of Notch signalling, or even mathematical modelling, suggested that DeltaC-Notch intercellular interaction synchronize PSM cells oscillations by reducing their internal noise (Dequeant and Pourquie, 2008; Giudicelli et al., 2007; Horikawa et al., 2006; Riedel-Kruse et al., 2007). Notch signalling in zebrafish somitogenesis has been solely assigned to synchronize oscillations of neighbouring cells (Ozbudak and Lewis, 2008). More recently, was observed a delay on the zebrafish segmentation clock by a disruption of Delta-Notch coupling, extending its periodicity and reveled an additional role of Notch signalling in clock period regulation (Herrgen et al., 2010).
1.4.2.
ROLES OF FGF SIGNALLING PATHWAY
FGF signalling is another important pathway for the segmentation clock, as it has been demonstrated that it is crutial for the initiation of the expression of dusp4, a negative regulator of FGF/MAPK signalling and hes7, in the posterior PSM, which is required for their dynamic expression in the anterior PSM (Niwa et al., 2007). FGF signal initiates hes7 expression as well as oscillation in the posterior PSM, which is propagated and maintained in the anterior PSM by Notch signalling, implementing FGF signalling as the base for Hes7 generated oscillations (Bessho et al., 2003). While the influence of the FGF signalling pathway on the segmentation clock appears to be a controversial topic, an interesting finding shows that FGF components (dusp6, spry2, snail1) does not oscillate in
presenilin1/ presenilin2 double mutant mice lacking NICD, indicating that Notch signalling is necessary for FGF component oscillations (Ferjentsik et al., 2009). Other intriguing study demonstrated that chemical inhibitors of FgfR1 failed to perturb Notch target gene expression in mouse and chick (Delfini et al., 2005; Dubrulle et al., 2001; Gibb et al., 2009; Niederreither et al., 2002), whereas, Wahl et al. (2007) observed a quick disruption of Wnt target gene axin2 and a slow, but abrogated lfng expression in mouse FGFR1 mutants. Despite the constitutive expression of Dusp4 in hes7 mutants, axin2 still presents dynamic expression, ruling out the possibility of FGF/Dusp4 signalling to be the phasemaker of gene oscillations (Niwa et al., 2007; Hirata et al., 2004).
1.4.3.
ROLES OF WNT SIGNALLING PATHWAY
Until recently it was thought that, although Wnt cluster genes oscillate in mouse PSM, there was no indication of these oscillations in chick PSM. However, chick Wnt components that included axin2, T, gpr177 (commonly known as Wntless) and rrm2 and zebrafish: tbx16 (Krol et al., 2011), were identified for the first time in a genome-wide study as being oscillating (Table 1.3). A linkage between Notch signalling and Wnt targets, was disbelieved since it has been already described that, in hes7, RBPjk and NICD gain of function mutants, axin2 retains dynamic expression pattern (Hirata et al., 2004; Feller et al., 2008; Ferjentsik et al., 2009). However, abolishing the expression of presenilin1, and presenilin2 in mouse PSM, axin2 oscillations ceased to exist (Ferjentsik et al., 2009) indicating that Notch signalling is operating upstream of Wnt targets. Yet, other results indicate Wnt signalling to be upstream of Notch, since wnt3a hypomorphic mouse mutants (vestigial tail with less wnt3a expression in the tailbud) present downregulated dll1, notch1 and non-dynamic lfng and hes7 expression in the posterior PSM (Aulehla et al., 2003; Niwa et al., 2007). This cross-talk between Notch and Wnt pathways was considered in Gibb et al. (2009), wherein it was observed a reciprocal regulation of Notch and Wnt pathways upon their components since, the inhibition of any of these pathways affected both
component genes suggesting a mutual interaction between Notch and W nt signalling in chick as previously observed in mouse PSM (Ishikawa et al., 2004).
1.5.
HES GENE FAMILY
Since the initial description of the segmentation clock, multiple other cyclic genes have been shown to oscillate at the mRNA level in the PSM of chick, mouse (Mus musculus) and zebrafish (Danio rerio) embryos (Gibb et al., 2010). Many of these genes belong to the Hes gene family, in which c-hairy1 is included, and are described as targets of Notch pathway that act as transcriptional repressors, regulating cell proliferation and differentiation (Kageyama et al., 2007; Vasiliauskas et al., 2003). Hes family genes are implicated in a number of developmental processes such as segmentation of the mesoderm, functioning as biological clocks, measuring time (Palmeirim et al., 1997). The molecular clock has also been showed to be operating during limb development in the chondrogenic precursor cells (Pascoal et al., 2007). Additionally, these repressor genes have been described to play a role in embryogenesis by maintaining the undifferentiated state of progenitor cells, and regulating the binary cell fate decisions (Kageyama et al., 2007).
1.5.1.
STRUCTURAL ANALYSIS OF HES FAMILY PROTEINS
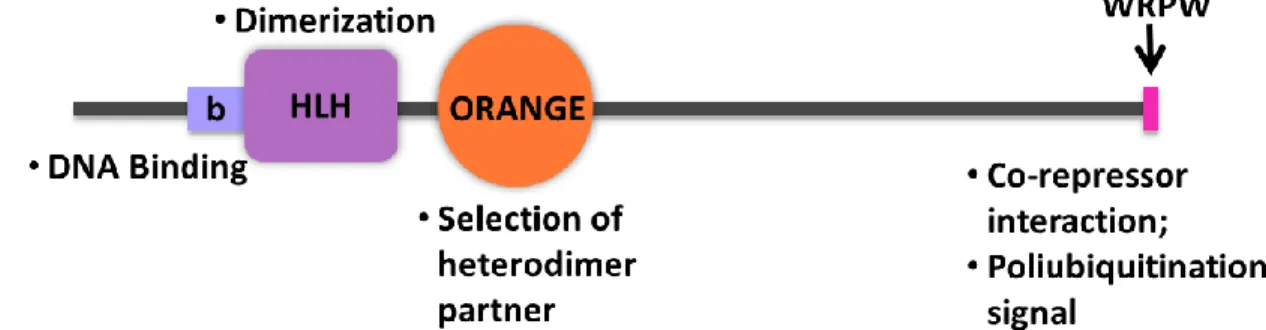
Structurally, Hes family proteins contain three conserved domains which endow them with unique features as repressors and oscillators. These are the basic Helix-Loop-Helix (bHLH), Orange and WRPW domains (Kageyama et al., 2007) (Figure 1.4).
Figure 1.4 – Schematic representation of Hes family proteins conserved domains, and their main functions. Hes family proteins have three conserved domains, the basic
Helix-Loop-Heix, Orange and WRPW domains. The basic moitif (b), is responsible for DNA binding, the helix-loop helix (HLH) domain promotes dimerization, the Orange domain acts as the selector of the heterodimer partner which Hes protein will bind, and WRPW is responsible for interaction with Hes co-repressors, and acts a poliubiquitination signal.
The bHLH domain can be distinguished in two regions, the basic region, and the Helix-Loop-Helix domain (Kageyama et al., 2007). The basic region, located at the N-terminal end of the domain consists of approximately 15 amino acids with a high number of basic residues. This motif is present in the majority of proteins containing the HLH domain, facilitating binding to the DNA that contains the canonical ‘E box’ recognition sequence, CANNTG (Massari and Murre, 2000; Toledo-Ortiz et al., 2003). Contemplating the amino acids within the basic region of the protein, it has been shown that some of them provide recognition of the core consensus site, whereas other residues determine specificity for a given type of hexanucleotide sequence E-box. Hes factors have a highly conserved proline residue located in the middle of basic region, suggesting that this may confer DNA-binding specificity, although the exact role has not yet been established (Dawson et al., 1995; Sasai et al., 1992).
The HLH domain is constituted mainly of hydrophobic residues (Toledo-Ortiz et al., 2003), which comprise two amphipathic α-helices, each 15-20 residues long, separated by a shorter intervening loop that has a more variable length and sequence, which mediates protein dimerization with homo and heterodimers (Norton, 2000; Toledo-Ortiz et al., 2003). Although the role of DNA binding has been assigned to basic region, evidences show residues in the loop and second helix also make contact with DNA (Massari and Murre, 2000).
The bHLH proteins, in animal systems, have been classified into six main groups, in which its classification is based on the evolutionary origin and sequence relatedness as well as the information available on their DNA binding specificities and functional activities (Atchley and Fitch, 1997; Ledent and Vervoort, 2001). Hes family proteins are classified as belonging to group E (previously considered part of group B by Atchley and Fitch [1997]), distinguished from other groups based on the presence of several conserved amino acids flanking the bHLH and the presence of the WRPW peptide (Ledent and Vervoort, 2001). The members belonging to this group are also considered to preferentially bind to N-boxes (CACGGC or CACGAC), having low affinity for E-boxes, as well as possessing a Proline instead of an Arginine residue at a crucial position in the bHLH domain (Fisher and Caudy, 1998)
The orange domain has two amphipathic helices and regulates the selection of bHLH heterodimer partners being particularly important for the efficiency of the interaction (Kageyama et al., 2007; Taelman et al., 2004) This domain is also shown to mediate transcriptional repression, although a co-repressor interacting with this domain is not known yet (Castella et al., 2000) .
Localized at C-terminus is a well-defined simple motif, the WRPW, and it consists of the tetrapeptide Trp-Arg-Pro-Trp. This motif is responsible for binding to the transcriptional corepressor Groucho and its mammalian homologues, the TLE (Transducin-like E(spl)) proteins, and thereby functions as the repressor domain of this family of transcription factors. WRPW is not, however, the only motif required for repression, since functional dissection of the HES proteins revealed other important regions for repression, such as the Orange domain. In Drosophila deletion mutants for the gene Enhancer of split [E(spl)], it has been demonstrated that both the Orange and the interval between the Orange and the WRPW motif appear to be important to the repression function of the gene (Giebel and Campos-Ortega, 1997). WRPW sequence also acts as a polyubiquitination signal, controlling the half-life of Hes proteins by promotion of proteasome-mediated
degradation, which results in very short half-lives, 22 min for both Hes1 (Hirata,2002), and Hes7 (Hirata, 2004).
1.5.2.
HES
AND
HAIRY-RELATED
TRANSCRIPTION
FACTORS
Hes factors are similar to but distinct from Hairy-related transcription factors (Hrt), also known as Hesr, Hey, CHF, grl, and HERP. For instance, Hes family members are characterized by a highly conserved proline residue in the basic domain, that contrast a glycine at the comparable position that likely underlies Hrt specificity for E box DNA-binding sites (CACGTG) over the N-box site (CACNAG) favored by Hes family members. In addition, Hrt proteins contain a carboxy-terminal YXPW-TEI/VGAF (Y/T) motif that is alike to but distinct from the WRPW motif of Hes1. This region is necessary for Hes1’s recruitment of the co-repressor, Groucho but the Y/T domain of Hrt proteins does not appear to interact with Groucho. (King et al., 2006)
1.5.3.
EXPRESSION AND TRANSCRIPTIONAL ACTIVITIES
OF HES FACTORS
Hes family oscillation seems to be generated by an auto feedback loop, as it was shown by Hirata, et al. (2002). This study demonstrates that the mouse Hes1 protein directly binds to the N-box in its own promoter repressing the gene transcription. This repression is transient probably due to the short half-life of both hes1 (22 min) mRNA and Hes1 protein (Figure 1.5) (Hirata et al., 2002). Data suggest that the 3´untranslated region (3´-UTR) of hes1 gene might be responsible for the short half-life of hes1 mRNA (Hirata et al., 2002), as it has been previously reported for Xenopus hairy2 mRNA stability (Davis et al., 2001). Both the protein and mRNA maintain a 2 hour oscillation period, although the protein oscillation is delayed ~15min compared to mRNA, probably due to the time required for protein turnover by the ubiquitin–proteasome pathway (Hirata et al., 2002) (Figure 1.5). When Hes1 protein is constitutively activated either by using proteasome inhibitors or an expression vector, hes1 transcription is repressed by the persistently high
Hes1 levels. On the other hand, treatment with cyclohexamide, an inhibitor of translation, or over-expression of a dominant-negative form of Hes1 (dnHes1) constitutively upregulates hes1, blocking its oscillations. Therefore, hes1 oscillations requires both de novo synthesis and degradation of Hes1 protein and the negative feedback loop, in which Hes1 periodically represses its own transcription, is the central mechanism for the hes1 oscillations both in cells and in the PSM (Hirata et al., 2002) (Figure 1.5). Furthermore, using mathematical modeling, the authors predict that alterations in synthesis and degradation rates should change the oscillations period.
Figure 1.5 – Schematic representation of Hes auto feedback regulation. When hes1
transcription activated by Notch, for example, Hes1 protein is produced, allowing it to form dimers. The homodimer then will induce the repression of its own gene. Both the proteins and mRNA are degraded rapidly due to their very short half-lives, therefore allowing the start of a new cycle of expression. Adapted from (Kageyama et al., 2007).
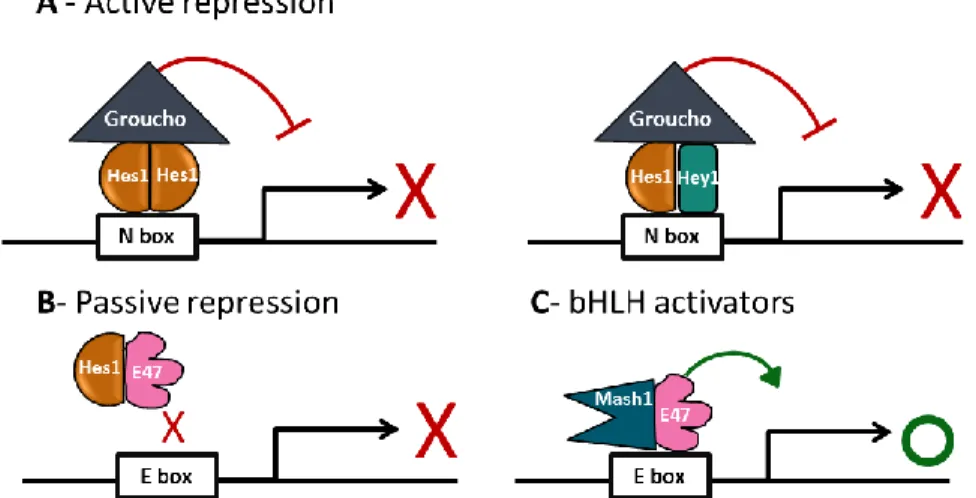
Hes factores repression is carried out in two manners, it can repress actively or passively (Figure 1.6). In the active repression, the WRPW domain is involved, and will interact with the co-repressor Transducin-like E(spl) (TLE) genes/Groucho-related gene (Grg) (Kageyama et al., 2007) (Figure 1.6A). Groucho is able to repress transcription by recruiting histone deacetylase, an enzyme responsible for inactivate chromatin (Chen and Courey, 2000). Thus, it is likely that the Hes–
Studies reveal an interaction between the C-terminal portion of chick hairy1 and Sap18 (Sin3-associated polypeptide, 18 kDa), a component of the Sin3/histone deacetylase (HDAC) transcriptional repressor complex, indicating that in c-hairy1 may mediate gene transcriptional repression by recruiting the Sin3/HDAC complex through a direct interaction with the Sap18 adaptor molecule (Sheeba et al., 2007). The passive repression is due to the ability of Hes factors to inhibit bHLH activators that bind to the E box, by forming non-DNA-binding heterodimers with them. These activators include Mash1 and E47 that normally activate neuronal-specific gene expression by forming heterodimers and biding to the E box (Figure 1.6C), a process prevented by intervention of Hes1 (Kageyama et al., 2007) (Figure 1.6B).
Figure 1.6 - Active and passive repression of Hes1. A – Active repression: Hes factors are able to actively repress transcription, by binding to the N box, in form of homodimers (left panel) or heterodimers with Hey (right panel), interacting with co-repressors, such as Groucho homologs. (C) Passive repression: By forming non-DNA binding heterodimers with bHLH activators such as E47, Hes factors are able to passively inhibit transcriptional activation (D) Activation: bHLH activators such as Mash1 and E47 form heterodimers that bind to the E box and activate transcription. Adapted from (Kageyama et al., 2007).
1.5.4.
HES FACTORS MISREGULATIONS
Misregulations of HES family members have been linked to developmental defects and oncogenesis (Andrade et al., 2007; Davis et al., 2001). Andrade et al. (2007) reviews some development defects associated the segmentation clock, in mutant mouse embryos and in human embryos with congenital malformations in
the axial skeleton. Mouse mutant models can be very useful to investigate the cause of some malformations observed in humans. The most common defect observed in these embryos mutated for segmentation clock genes, when not lethal, are shorter trunks with fused or bifurcated vertebrae and ribs (reviewed in Andrade et al., 2007). Similar segmentation problems can be found in human spondylocostal dysostosis (SD), in which patients exhibit a short trunk due to multiple hemi-vertebrae formation accompanied by rib fusions, bifurcations and deletions and mutations in Notch-regulated genes such as dll3, lfng and mesp2 have been observed to induce SD (Giampietro et al., 2009; Turnpenny et al., 2007). Alagille syndrome, a disorder characterized by developmental abnormalities of the liver, heart, eye and skeleton, has been associated with mutations in jagged1, a Notch ligand, and notch2 genes. Mutations of fgfr1-3 in human have also been shown to result in skeletal disorders, including fusion of the craniofacial sutures and short-limbed dwarfisms (reviewed in Chen and Deng, 2005).
While expanding of the understanding of the mechanisms regulated by Hes-family members the number of observations associating them with oncogenesis also increased. It is, however, controversial whether Hes genes act as a tumor suppressor and/or oncogene, since conflicting observations suggest that these genes may have a dual role depending on the tumor types and the stages of cancer progression (Lee et al., 2012). In the most common of malignant brain tumors, medulloblastomas (MBs), expression of HES1 has been associated with the worse clinical outcome. Down-regulation of Hes1 expression negatively regulates the proliferation rate and anchorage-independent growth of MB cells (Garzia et al., 2009). Studies also suggest that Hes1 may have an oncogenic role in oral squamous cell carcinoma (OSCC), associated with cancer progression and cancer stem cells phenotype in OSCC (Lee et al., 2012). Beyond Hes1, Hes6 adds up to the growing list of Notch signalling pathway components involved in the process of transformed cell growth, being identified as up-regulated in colon, breast, lung ,and renal, primary carcinomas compared to expression in normal tissue (Swearingen et al., 2003).
1.6.
C-HAIRY1
PROTEIN
AND
ANTIBODY
PRODUCTION
Since the discovery of the oscillatory expression of c-hairy1 in the chick embryo PSM, many of the studies have been much focused on the understanding of the gene expression mechanisms rather that in the protein mechanisms (Andrade et al., 2007; Palmeirim et al., 1997). In 2003, Vasiliauskas et al., identified an expression of two products in a RT-PCR amplification of the entire hairy1 open frame from stage 19 chick embryos, which led to the discovery of a c-Hairy1 isoform, c-c-Hairy1B, since c-c-Hairy1A have already been described by Palmeirim et al in 1997. The isoforms differed in a insertion of 14 amino acids between the second and third residues belonging to basic region, resulting on a difference in the first two positions of the basic domain, RK (two basic amino acids) in c-Hairy1A, and AE (a hydrophobic and an acid residue) in c-Hairy1B. This change alters the net charge of the c-Hairy1B from negative to positive, which the authors suggest a possibility to change significantly the specificity or weaken the affinity of a transcription factor for DNA. Consequently, the two isoforms of c-Hairy1, by forming homo- or heterodimers, may bind a range of DNA sites. On the other hand, hairy1B could antagonize the transcriptional repressor function of c-hairy1A. The study described different functions of these isoforms in regulating the limb bud growth, suggesting the differences were due isoforms different activities rather than to the efficiency.
With the purpose to acquire better understanding about the c-Hairy1 protein, regarding expression, function, and its cellular localization in chicken, our lab ordered the production of an antibody against c-Hairy1 from a commercial company. This task was necessary since there was no antibody available in the market, nor has any other research group developed it before. In order to validate the future results it was crucial to have available the purified protein so it could be used as a positive control, and validate the results obtained. Therefore, a commercial company undertook the task of purifying the protein. The process consisted of the cloning of the c-Hairy1 cDNA fused to a His tag located in the
N-terminal, into the Invitrogen vector pCRII-TOPO vector, and then expressed in E. Coli. The protein was purified by His Tag pull-down assay, and removed the His tag from c-Hairy1. The protein was expected to be 90% pure and to have a molecular weight of 30,67 kDa.
At first, a rabbit polyclonal antibody against the c-terminal portion of the protein was produced, and by western blot was verified that the antibody was sensitive for c-Hairy1. In this test, bands with the expected molecular weight were detected in chicken extracts, using the purified protein as a positive control. Controversially, several bands of different molecular weights were also detected in both extract and the purified protein. The most intense bands in the extract corresponded to approximately 32, 49, 63, 72 and 75 kDa, whereas in the purified protein the predominant bands corresponded to 15, 35 and 39 kDa. Results suggested that a low specificity of the polyclonal antibody (Figure 1.7).
Regarding these results, a monoclonal antibody against the whole protein was produced in an attempt to increase specificity, as it only has affinity for one epitope (Alberts et al., 2007). Posteriorly serum from several different immunized mice, each specific for one epitope, were sent to be tested by western blot. Results reveal different staining for each serum, in which some presented a stronger staining than others. The serums were selected based on the presence of the predicted molecular weight bands in the samples that were tested, and presented
Figure 1.7 - Test of the polyclonal antibody against c-Hairy1. Polyclonal anti-c-Hairy1 was tested in western blot,
using as samples chicken embryo extract, E, (15 µg of protein/ lane), and purified c-Hairy1 protein (140 ng of protein/ lane), H1. Several bands were detected, including a band with the predicted c-hairy1 molecular weight, indicated with an arrow.
fewer unspecific bands with unpredicted molecular weights (Figure 1.8). Taking these conditions in considerations, the serums with the reference 8C9G4A10C11 (8C9) and 5C6F11E12 (5C6) were selected, as they detected the predicted band of c-Hairy1 in both embryo extracts and purified protein lanes. Due the fact that 8C9 serum detected fewer unspecific bands than 5C6, it was considered to have more specificity to c-Hairy1 protein. Thus 8C9 was developed as a monoclonal antibody, however the antibody referenced as 5C6 was asked to be kept by the company to possibly validate future studies.
Figure 1.8 - Test for specificity of several hybridomas supernatants against c-Hairy1, in chick embryo extracts and purified protein. Different hybridomas
supernatants anti-c-hairy1 were tested in western blot, using as samples chick embryo extract, E, (15 µg each), and purified c-Hairy1 protein, H1 (140 ng each). Each serum reacts against different epitopes, and are distinguished by their own reference: 2F8F6G8 (2F8); 1B11A9F12 (1B1); 3D3A7F7 (3D3); 3E5C6H9 (3E5); 7B6B10H1 (7B6); 8C9G4A10C11 (8C9); 3G3E5G10 (3G3); 4C1G1G10 (4C1); 5C6F11E12 (5C6); 7E10F11E11 (7E1).