1. Lab3R – Respiratory Research and Rehabilitation Laboratory (Lab3R), School of Health Sciences, University of Aveiro, Aveiro, Portugal.
2. Institute for Biomedicine (iBiMED), University of Aveiro, Aveiro, Portugal
INTRODUCTION
H
ealthy aging is defined “as the process ofde-veloping and maintaining the functional ability that allows well-being in older peo-ple”.1 Balance plays an important role in functional ability and falls and, consequently, in the daily life of older people,1-3resulting in a potential im-pact on healthy aging.3-4Furthermore, associations be-tween balance and recognized predictors of healthy aging (e.g., functional ability,5gait speed,6 self-repor-ted physical activity [PA]7and health-related quality of life [HRQoL])8have been reported.
Balance may be assessed in older people through a number of outcome tools, such as the Berg Balance Scale (BBS), the Timed Up and Go test (TUG), and the
Sara Almeida,1-2Cátia Paixão,1-2Alda Marques1-2
close relationship
RESUMO
Objectives:This study explored the: i) correlations between the Balance Evaluation Systems Test (BESTest) and its short-ver-sions (Mini-BESTest and Brief-BESTest), with functional ability, gait speed, physical activity, and health-related quality of life; ii) ability of the Five Times Sit to Stand (5STS), 10 Meter Walk Test (10MWT), Brief Physical Activity Assessment Tool (BPAAT) and World Health Organization Quality of Life-Bref (WHOQoL-Bref) to identify the prior history of falls in community-dwelling ol-der people.
Methods:An exploratory cross-sectional study was conducted with healthy older people living in the community. Balance (BES-Test and its short versions), functional ability (5STS), gait speed (10MWT), physical activity (BPAAT), and health-related quali-ty of life (WHOQoL-Bref) were assessed. Spearman correlation coefficient and receiver operating characteristics analysis were calculated.
Results:One hundred and eighteen individuals (76[69-83.3] years; n=79, 66.9% female) participated in this study. Correlations between balance and functional ability (-0.61< r < -0.51, p<0.001), gait speed (0.69 < r < 0.78, p<0.001), physical activity (0.39 < r < 0.42, p<0.001) and health-related quality of life (0.28 < r < 0.57, p≤0.002) were identified. The following cutoff points to differentiate between prior history of falls were established: 80.5 points for the BESTest, 16.5 points for the Mini-BESTest and 12.5 points for the Brief-BESTest, 13.5s for the 5STS, 1.2m/s for the 10MWT, 1.5 points for the BPAAT and 14.5/66; 14.5/66; 14/62.5; 15.5/72 points for domains I, II, III and IV, respectively, of the WHOQoL-Bref 0-20/100.
Conclusion:The BESTest and its short versions correlated with functional ability, gait speed, physical activity, and health-rela-ted quality of life in older people. These outcomes can differentiate prior history of falls in community-dwelling older people. Keywords:Community-dwelling older people; Falls; Functional ability; Health-related quality of life; Self-reported physical activity.
Functional Reach Test.9However, most of these balance tools present ceiling effects in older people10and none identify the different balance systems. Thus, a clinical comprehensive tool of balance, the Balance Evaluation Systems Test (BESTest), and its short versions (e.g., Mini-BESTest and Brief-BESTest), were developed to overcome these limitations.11-13BESTest and its short versions have been providing valuable information to tailor interventions for improving balance in healthy older people.2However, the correlation between the BESTest and its short versions with tools of healthy ag-ing in community-dwellag-ing older people remains un-known.
Additionally, falls affect healthy aging, as it is known that these events result in loss of independence, dis-ability, social isolation, institutionalization, morbidity, and mortality.3Balance tools have been shown to be able to identify fall status in older people,4,14however the
384
estudos
originais
etiology of falls is multifactorial.3,15Thus, functional ability, gait speed, self-reported PA, and HRQoL may also play an important role in identifying people at risk of falling who will benefit from a more comprehensive assessment of balance and, if needed, a personalized balance intervention. The Five Times Sit to Stand test (5STS), the 10 Meter Walk Test (10MWT), and the World Health Organization Quality of Life-Bref (WHOQoL-Bref ) have been recognized as tools able to identify healthy aging14,16-17and falls in older people.18-20The Brief PA assessment tool (BPAAT) has been poorly studied, however, PA is strongly associated with healthy aging and falls.21Nevertheless, research on the ability of the 5STS, 10MWT, WHOQoL-Bref, and BPAAT tools to iden-tify the history of falls in older people is scarce and it is important to be conducted since those who have fall-en are at higher risk to fall again.22
Therefore, this study aimed to explore the correlation between BESTest and its short versions, and function-al ability, gait speed, self-reported PA and HRQoL; and to establish the ability of 5STS, 10MWT, BPAAT, and WHOQoL-Bref to identify the history of falls in com-munity-dwelling older people. We hypothesized that higher balance scores will be positive and strongly cor-related with better performances in functional ability, gait speed, self-reported PA, and HRQoL and that these tools will be able to identify a history of falls in com-munity-dwelling older people.
METHODS
Study design and ethics
An exploratory cross-sectional study in community-dwelling older people was conducted. Ethical approval was first obtained (238/10-2014) followed by informed consent.
Participants
Community-dwelling older people were recruited from six day-care centers, two gymnasiums, and one se-nior university. The manager of each institution iden-tified and explained the study to eligible people. A meet-ing was scheduled with interested people and the re-searcher provided further information about the study. Community-dwelling older people were eligible if they: were ≥ 60 years old;23understood the aims of the study; were able to express their opinions;
demon-strated coherent discourse and spatiotemporal orien-tation, and voluntarily accepted to participate. Exclu-sion criteria involved any condition that could poten-tially influence scores on balance measurements, such as: hospitalization in the previous month; a history of dizziness or fainting; medication that could cause dizzi-ness or impaired balance; depressive disorders; signs of cognitive impairment or psychiatric symptoms; signi-ficant musculoskeletal, neurological or cardiorespira-tory disorders; the need of physical assistance to walk; and/or signs of substances abuses.
Data collection
Sociodemographic (age and gender) and anthropo-metric (height, weight, body mass index [BMI], and per-centage of fat-free mass [FFM]) data were first collec-ted, through a structured questionnaire based on the International Classification of Functioning, Disability and Health (ICF–checklist). BMI (weight/height2) and FFM (%) were assessed with a bioimpedance equip-ment (Omron body fat monitor BF306). The self-re-ported number of falls was assessed using two stand-ardized questions (1. «Have you had any fall in the last 12 months? / Teve alguma queda nos últimos 12 meses?» and, if yes, 2. «How many times did you fall down in the last 12 months? / Quantas quedas teve nos últimos 12 meses?»), after presenting to each partici-pant a clear definition of falls (“an event when you find yourself unintentionally on the ground, floor or lower level”).3
Then performance-based tests (BESTest, 5STS, and 10MWT) were performed. First, tests’ instructions were read by one researcher while a second researcher demonstrated the task to the participant. One re-searcher provided supervision to ensure the partici-pant’s safety during physical tests. All tests were as-sessed by the same assessor to ensure data reliability.
The balance was assessed with the BESTest and its short-versions. The BESTest is a clinical comprehen-sive balance assessment tool, with 36 items and cate-gorized into six balance systems: biomechanical cons-traints, stability limits/verticality, transitions/anticipa-tory postural adjustments, reactive postural control, sensory orientation, and stability in gait.12Each task is scored on an ordinal scale from zero(severe impair-ment) to three (no impairimpair-ment).12-13The total score is
108 points, with higher scores indicating better balance performance.12-13BESTest takes between 20-60 minutes to administer,12-13thus its use may not be doable in clini-cal practice. Therefore, a short version, Mini-BESTest, has been proposed to reduce the assessment time.11
The Mini-BESTest takes 10-15 minutes to apply and includes 14 items from the original BESTest, based in four balance systems: anticipatory postural adjust-ments, reactive postural responses, sensory orienta-tion, and stability in gait.11The Mini-BESTest total score is 32 points and each task is scored on a 3-point scale (zero to two), with higher scores indicating better per-formance.11 Nevertheless, as the Mini-BESTest does not identify the six balance systems of the original BESTest, the Brief-BESTest has been proposed.
The Brief-BESTest takes only 10 minutes to be ap-plied and consists of six items of the original BESTest.13 Each task is scored on a four-point scale (zero to three), with a total score of 24 points, with higher scores indi-cating better balance performance.13
Functional ability was assessed with the 5STS,19gait speed with the 10MWT,24PA with the BPAAT,25and the HRQoL with WHOQoL-Bref.16,26
The 5STS consists of standing up and sitting down from a straight-backed armless chair with a hard seat stabilized against a wall for five repetitions.19Longer time (seconds) to perform the test indicates worst func-tional ability performance.19
The 10MWT consists of walking 10 meters distance at a comfortable gait speed, whilst the velocity achieved during the intermediate six meters is recorded.24 High-er scores (m/s) indicate worst gait speed pHigh-erformance.24 The BPAAT consists of two questions (1. «How many times a week do you usually do 20 minutes or more of vigorous-intensity PA that makes you sweat or puff and pant? (e.g., heavy lifting, digging, jogging, aerobics, or fast bicycling)» [3 or more times a week, 1 to 2 times a week, none] / «Quantas vezes por semana, costuma realizar 20 minutos de atividade física intensa que o faz suar ou ficar ofegante? (e.g., jogging, levantamento de grandes pesos, cavar, aeróbica ou andar de bicicleta a um ritmo rápido)» [3 ou mais vezes por semana, 1 a 2 vezes por semana, nenhuma]; 2. «How many times a week do you usually do 30 minutes or more of mode-rate-intensity PA or walking that increases your heart rate or makes you breathe harder than normal? (e.g.,
carrying light loads, bicycling at a regular pace, or dou-bles tennis)» [5 or more times a week, 3-4 times a week, 1-2 times a week, none] / «Quantas vezes por semana, costuma realizar 30 minutos de atividade física mode-rada ou caminhada que aumenta a sua frequência car-díaca ou o faz respirar com mais dificuldade que o nor-mal? (e.g., cortar a relva, transportar cargas leves, an-dar de bicicleta a um ritmo regular, ou jogar ténis em duplas)» [5 ou mais vezes por semana, 3 a 4 vezes por semana, 1 a 2 vezes por semana, nenhuma]) assessing the frequency and duration of intense and moderate PA, undertaken in a usual week.25,27A total score was calcu-lated (range zero to eight), in which higher scores cor-respond to higher PA levels (scores < 4 indicate that the person is insufficiently active and scores ≥ 4 indicate that the person is sufficiently active).25
The WHOQoL-Bref is a short version of the original WHOQoL and assesses four domains of quality of life: I-Physical, II-Psychological, III-Social relationships, and IV-Environment.26This scale is composed of 26 questions, scored on a Likert scale from one to five, with higher scores indicating better quality of life.26
Data analysis
Statistical analyses were performed in IBM SPSS 24.0 (IBM Corp., Armonk, NY) and GraphPad Prism 5.01 (GraphPad Software, San Diego, CA). The level of sig-nificance was set at 0.05.
Descriptive statistics were used to characterize the sample. Participants were classified into two groups: non-fallers (reported history of zero or one fall) and multiple fallers (reported history of ≥ 2 falls). The nor-mality of data distribution was tested with the Kol-mogorov-Smirnov test and z-test with the skewness and Kurtosis.28Comparisons between groups were per-formed with Mann-Whitney-U tests since most vari-ables were not normally distributed. If significant dif-ferences in the performance of the tests were found, ef-fect sizes (ES) were computed with Cohen’s d (small d ≥ 0.2, medium d ≥ 0.5 or large d ≥ 0.8 effect).28The skew-ness of the distribution of scores was assessed for each tool to verify the occurrence of floor and ceiling effects (substantial floor effect: skewness > 1; substantial cei-ling effect: skewness < -1).28
Correlations were assessed using Spearman rank cor-relation and interpreted as negligible (0 – 0.30), low (0.30
386
estudos
originais
– 0.50), moderate (0.50 – 0.70), high (0.70 – 0.90) and very high (0.90-1).28
Receiver operating characteristics (ROC) analysis was used to assess the ability of the tools to significantly differentiate between a self-reported prior history of non-fallers and multiple fallers. The cutoff was chosen as the value which simultaneously maximized the sen-sitivity and specificity: (1-sensen-sitivity)2+(1-specificity)2 for each tool.28Area under the curves (AUC) and 95% confidence interval (95%CI) interpretation was:
AUC=0.5 no discrimination; 0.7 ≤ AUC < 0.8 acceptable; 0.8 ≤ AUC < 0.9 excellent, and AUC ≥ 0.9 outstanding dis-crimination.28The positive and negative likelihood ra-tios (LR+ and LR-) were computed.28
RESULTS
One hundred and eighteen community-dwelling older people (mean ± standard deviation 76.2 ± 8.9; me-dian [interquartile range] 76 [69 – 83.3] years old; n=79; 69.9% female) were enrolled in this study. On average
Non-fallers (0-1) Multiple fallers
Characteristics Overall (n=118) (n=98) (2 or more) (n=20) p-value
Age (years) 76 [69 - 83.3] 74 [68 - 82] 80.5 [71.5 - 87.5] 0.063 Gender (female n, %) 79, 66.9% 63, 64.3% 16, 80% 0.203 FFM (%) 34.9 ± 7.3 34.7 ± 7.5 35.9 ± 6.6 0.514 BMI (kg/m2) 26.2 [24 - 29] 26.2 [24 - 29.3] 27.1 [23.8 - 28.5] 0.917 Tools BESTest (points) 87.5 [68.8 - 94.4] 87.9 [74.9 - 95.4] 61.7 [53.6 - 85.9] 0.001* Mini-BESTest (points) 22.5 [14 - 29] 25 [17 - 30] 7.5 [5 - 19] < 0.001* Brief-BESTest (points) 16 [9 - 20.3] 17 [12 - 21] 6.5 [3 - 11.8] < 0.001* 5STS (s) 12.1 [9.1 - 16.5] 11.5 [8.9 - 15.7] 17.5 [13 - 25.3] 0.002* 10MWT (m/s) 1.3 [1 - 2.1] 1.5 [1.1 - 2.2] 0.9 [0.6 - 1.2] 0.001* BPAAT 1.5 [0 - 8] 2 [0 - 8] 0 [0 - 3] < 0.001*
Sufficiently active score ≥ 4 (n, %) 31, 26.3% 67, 68.4% -
-Insufficiently active score 0-3 (n, %) 87, 73.7% 31, 31.6% 20, 100%
-WHOQoL-Bref 0-20 score (points)
I – Physical health 15 [13 - 17] 15.2 [13 - 17] 13 [11 - 14] < 0.001*
II – Psychological 15 [13 - 17] 15 [13 - 17] 13 [12 - 14.8] < 0.001*
III – Social relationships 15 [13 - 16] 15 [13 - 16] 13 [11 - 15.8] 0.019*
IV – Environment 16 [14 - 17] 16 [15 - 17] 14 [13 - 16] 0.002*
WHOQoL-Bref 0-100 score (points)
I – Physical health 69 [56 - 81] 69 [56 - 81] 56 [44 - 63] < 0.001*
II – Psychological 69 [56 - 81] 69 [56 - 81] 56 [50 - 67.5] < 0.001*
III – Social relationships 69 [56 - 75] 69 [56 - 75] 56 [44 - 73.5] 0.019*
IV – Environment 75 [63 - 81] 75 [69 - 81] 63 [56 - 75] 0.002*
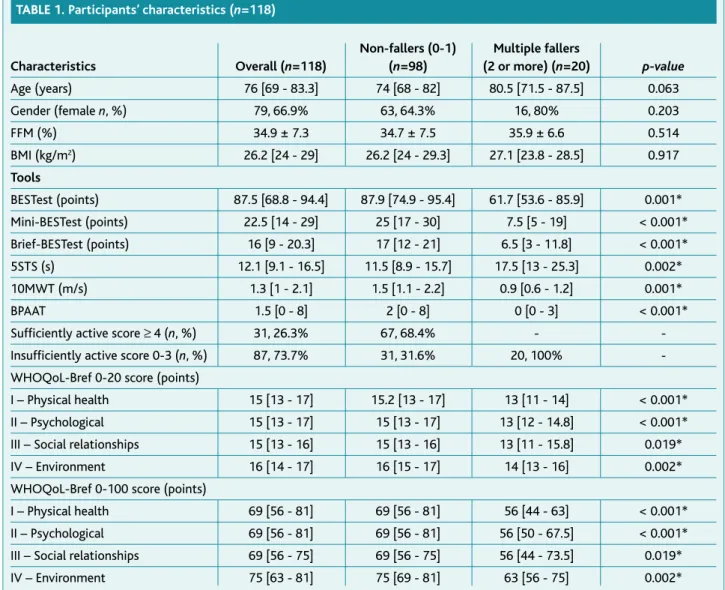
TABLE 1. Participants’ characteristics (n=118)
Note: values are presented in median [interquartile range] and mean ± standard deviation unless otherwise stated.
Abbreviations: 5STS = Five Times Sit to Stand test; 10MWT = 10 Meter Walk Test; BESTest = Balance Evaluation Systems Test; BMI = Body Mass Index; BPAAT = Brief Physical Activity Assessment Tool; FFM = Free-fat Mass Index; WHOQoL-Bref = World Health Organization Quality of Life–Bref. *p<0.05 significance.
participants were overweight (mean ± standard devia-tion 26.8 ± 4.2 median [interquartile range] 26.2 [24-29] kg/m2) and presented high FFM (34.9 ± 7.3%). Most in-dividuals (n=98; 83.1%) reported to have had zero or one fall, and 16.9% (n=20) reported to have had two or more falls in the previous year. Most participants were insuf-ficiently active (n=87; 73.7%). More than 1/3 of non-fallers were insufficiently active (n=31; 31.6%) and mul-tiple fallers were all insufficiently active (n=20; 100%) (Table 1).
All tools were able to significantly differentiate be-tween a self-reported prior history of non-fallers and multiple fallers (Table 1). Non-fallers performed sig-nificantly better at the BESTest (ES=0.87), Mini-BESTest (ES=1.15), Brief-BESTest (ES=1.11), 5STS (ES=0.76), 10MWT (ES=0.81), BPAAT (ES=0.97), and WHOQoL-Bref domains 0-20 (ESDOM – I=1.12, ESDOM – II=1, ESDOM – III=0.43 and ESDOM – IV=0.90) and 0-100 (ESDOM – I=1.14, ESDOM – II=0.81, ESDOM – III=0.62 and ESDOM – IV=0.87) than multiple fallers.
The 5STS (skewness=1.31) and the BPAAT (skew-ness=1) presented lower floor effects than the 10MWT (skewness=1.62). The WHOQoL-Bref0 – 20&0-100presented ceiling effect, which was higher in domains II and III (skewnessDOMII:0 – 20&0 – 100=-0.35; skewnessDOMIII:0 – 20=-0.31; skewnessDOMIII:0 – 100=-0.32) than in domains I and IV
(skewnessDOMI:0 – 20=-0.11; skewnessDOMI:0 - 100=-0.10; skew-nessDOMIV:0 – 20=-0.08; skewnessDOMIV:0 – 100=-0.07).
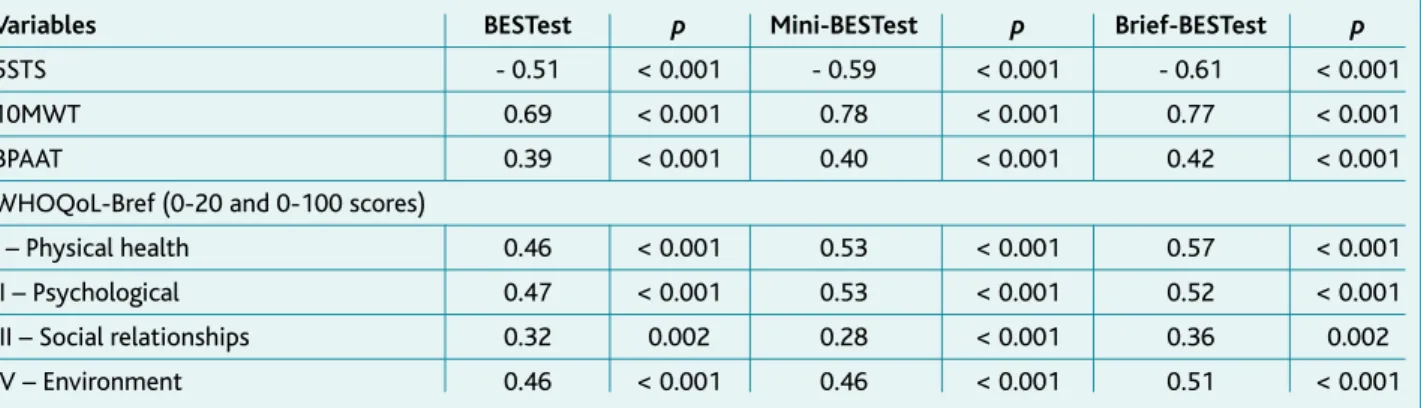
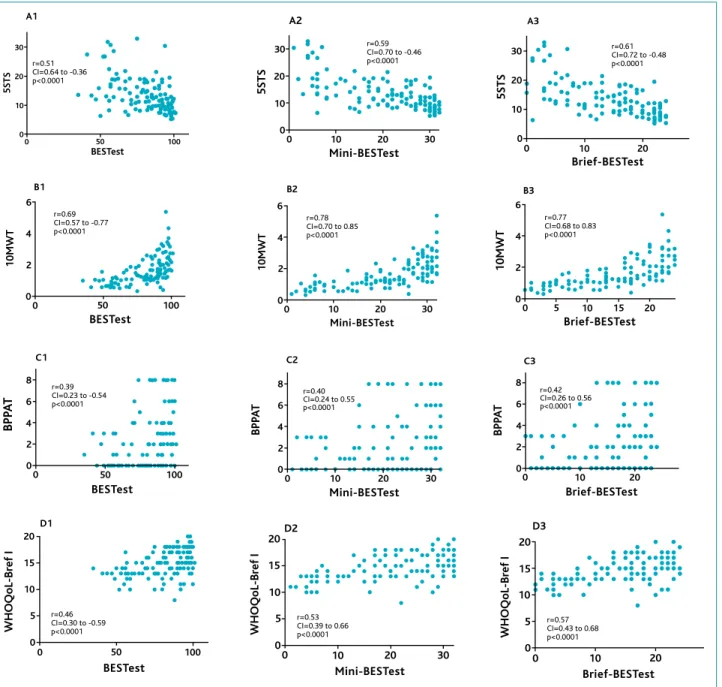
The BESTest and its short versions showed positive correlations with the 10MWT, BPAAT and WHOQoL-Bref and negative correlations with the 5STS. Correla-tion values are presented in Table 2. Scatterplots show-ing the correlations between BESTest, Mini-BESTest and Brief-BESTest and 5STS, 10MWT, BPAAT, and WHO-QoL-Bref domains can be found in Figure S1 (supple-mentary material).
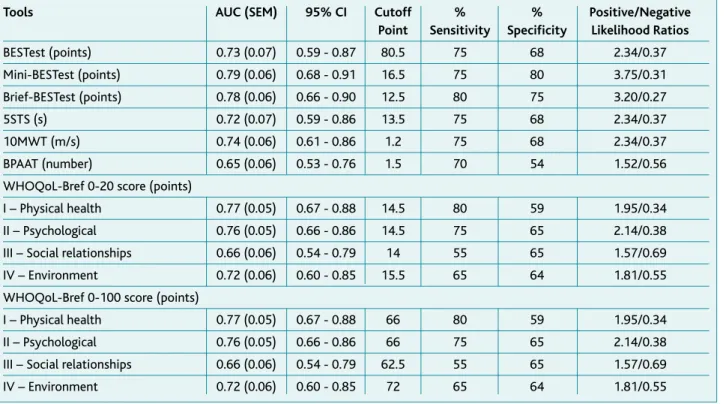
The AUC of the BESTest and its short versions, 5STS, 10MWT, BPAAT, and WHOQoL-Bref domains ranged between 0.65–0.79, indicating that these tests were able to significantly discriminate between older people with and without a history of multiple falls. The short ver-sions of the BESTest (Mini- [0.79] and Brief-BESTest [0.78]) and the WHOQoL-Bref domains I and II (AUC=0.77 for both), presented the higher AUCs. Table 3 shows the results of the ROC analysis.
To differentiate between a self-reported prior histo-ry of non-fallers and multiple fallers, the following cut-offs were identified: 80.5 points for BESTest, 16.5 points for Mini-BESTest, 12.5 points for Brief-BESTest, 13.5 seconds for 5STS, 1.2m/s for 10MWT, 1.5 points for BPAAT, 14.5/66; 14.5/66; 15/62.5; 15.5/72 for domains I, II, III, and IV of the WHOQoL-Bref 0-20/0–100,
Variables BESTest p Mini-BESTest p Brief-BESTest p
5STS - 0.51 < 0.001 - 0.59 < 0.001 - 0.61 < 0.001
10MWT 0.69 < 0.001 0.78 < 0.001 0.77 < 0.001
BPAAT 0.39 < 0.001 0.40 < 0.001 0.42 < 0.001
WHOQoL-Bref (0-20 and 0-100 scores)
I – Physical health 0.46 < 0.001 0.53 < 0.001 0.57 < 0.001
II – Psychological 0.47 < 0.001 0.53 < 0.001 0.52 < 0.001
III – Social relationships 0.32 0.002 0.28 < 0.001 0.36 0.002
IV – Environment 0.46 < 0.001 0.46 < 0.001 0.51 < 0.001
TABLE 2. Correlations between Balance Evaluation Systems Test, Mini-Balance Evaluation System Test and Brief-Balance Evaluation Systems Test, and Five Times Sit to Stand Test, 10 Meter Walk Test, Brief Physical Activity Assessment Tool and World Health Organization Quality of Life Bref (n=118)
Note: Spearman correlation coefficient are presented.
Abbreviations: 5STS = Five Times Sit to Stand Test; 10MWT = 10 Meter Walk Test; BESTest = Balance Evaluation Systems Test; BPAAT = Brief Physical Activity Assessment Tool; WHOQoL-Bref = World Health Organization Quality of Life Bref. p<0.05 significance.
388
estudos
originais
respectively. The cutoff points for all tools are presen-ted in Table 3 and Figures 1 and 2.
DISCUSSION
According to the authors’ best knowledge, this is the first study demonstrating that the BESTest and its short versions correlate significantly with functional ability, gait speed, self-reported PA, and HRQoL in communi-ty-dwelling older people and that these tools are able to differentiate between a self-reported prior history of non-fallers and multiple fallers in this population with sensitivities and specificities above 50%.
Moderate to high correlations between balance and i) functional ability in people with multiple sclerosis,5 ii) gait speed in healthy people (>40 years),6iii) self-re-ported PA in older people,7and iv) HRQoL in older peo-ple8have been previously demonstrated. However, the
balance tools used in these studies (BBS,5-6TUG,5and One Leg Stance test),7are unable to assess balance com-prehensively. The BESTest distinguishes itself from these other balance tools by allowing the identification of specific balance domains that are preserved or im-paired hence, guiding personalized interventions.12The correlations found between the BESTest and its short versions with the functional ability, gait speed, self-re-ported PA, and HRQoL strengthens the value of their use routinely, especially the short versions which presen-ted similar or even higher correlations than the BESTest. This finding is of particular relevance for clinical prac-tice since the short versions are simple, quicker and re-quire less material to be applied.11,13
It is widely recognized that falls have a multifactori-al etiology and numerous risk factors have been iden-tified in community-dwelling older people, including
Tools AUC (SEM) 95% CI Cutoff % % Positive/Negative
Point Sensitivity Specificity Likelihood Ratios
BESTest (points) 0.73 (0.07) 0.59 - 0.87 80.5 75 68 2.34/0.37 Mini-BESTest (points) 0.79 (0.06) 0.68 - 0.91 16.5 75 80 3.75/0.31 Brief-BESTest (points) 0.78 (0.06) 0.66 - 0.90 12.5 80 75 3.20/0.27 5STS (s) 0.72 (0.07) 0.59 - 0.86 13.5 75 68 2.34/0.37 10MWT (m/s) 0.74 (0.06) 0.61 - 0.86 1.2 75 68 2.34/0.37 BPAAT (number) 0.65 (0.06) 0.53 - 0.76 1.5 70 54 1.52/0.56
WHOQoL-Bref 0-20 score (points)
I – Physical health 0.77 (0.05) 0.67 - 0.88 14.5 80 59 1.95/0.34
II – Psychological 0.76 (0.05) 0.66 - 0.86 14.5 75 65 2.14/0.38
III – Social relationships 0.66 (0.06) 0.54 - 0.79 14 55 65 1.57/0.69
IV – Environment 0.72 (0.06) 0.60 - 0.85 15.5 65 64 1.81/0.55
WHOQoL-Bref 0-100 score (points)
I – Physical health 0.77 (0.05) 0.67 - 0.88 66 80 59 1.95/0.34
II – Psychological 0.76 (0.05) 0.66 - 0.86 66 75 65 2.14/0.38
III – Social relationships 0.66 (0.06) 0.54 - 0.79 62.5 55 65 1.57/0.69
IV – Environment 0.72 (0.06) 0.60 - 0.85 72 65 64 1.81/0.55
TABLE 3. Ability to identify history of falls of the Balance Evaluation Systems Test, Brief-Balance Evaluation System Test and Mini-Balance Evaluation Systems Test, Five Times Sit to Stand Test, 10 Meter Walk Test, Brief Physical Activity Assessment Tool and World Health Organization Quality of Life Bref (n=118)
Abbreviations: BESTest = Balance Evaluation Systems Test; 5STS = Five Times Sit to Stand test; 10MWT = 10 Meter Walk Test; AUC = Area Under the Curve; BPAAT = Brief Physical Activity Assessment Tool; CI = Confidence interval; WHOQoL-Bref = World Health Organization Quality of Life-Bref;
gait and/or balance impairments, social factors, and quality of life.15These and other risk factors can be easi-ly evaluated with the BESTest and its short versions,14 5STS, 10MWT, BPAAT and WHOQoL-Bref.21,24,29-30
The ability of BESTest and its short versions to iden-tify fallers and non-fallers was previously published.14 We have found similar results, however, the current study adds information on the ability of these compre-hensive balance tools to identify a self-reported prior history of non-fallers and multiple fallers in communi-ty-dwelling older people, establishing now specific cut-offs for this purpose which can be especially useful for clinical practice to identify those who are more likely to fall again.
One previous study has determined a cutoff of 12s for multiple fallers in the 5STS test.31This result differs slightly from the cutoff of 13.1s established in this study however, our study differentiated non-fallers and mul-tiple fallers based on the self-reported number of falls while that study analyzed falls prospectively and recorded with a monthly calendar.31For the 10MWT, a considerable variance between our cutoff (1.2m/s) and the cutoff proposed in a study including community-dwelling older indigenous Taiwanese (0.88m/s) was found.32However, in the Taiwanese study32 only wo-men were included and assesswo-ments were taken in a 10 meters corridor with 10 (five+five) meters extra provid-ed for acceleration/deceleration, whilst in our study women and men participated and assessments were taken from a six meters corridor, with four (two+two) meters for acceleration/deceleration, as recommen-ded.24Different methodological approaches might con-tribute to the different results found between the stu-dies.
A cutoff for falls using a PA tool has been proposed in the literature,33however a different test (short form of the International PA Questionnaire) to assess PA was used, hindering comparisons with the present study. Nevertheless, and similarly to our findings, fallers re-ported less PA than non-fallers.33Since PA plays an im-portant role in the maintenance of the functional abi-lity independence and decreases the risk of falls,3the es-tablished cutoff of 1.5 points for the BPAAT might be useful to quickly screen community-dwelling older people and refer them for a comprehensive balance as-sessment in case of need.
100 80 60 40 20 0 0 20 40 60 80 100 S e n si ti v it y ( % ) 100% - Specificity% BESTest 100 80 60 40 20 0 0 20 40 60 80 100 S e n si ti v it y ( % ) 100% - Specificity% Mini-BESTest
A
B
100 80 60 40 20 0 0 20 40 60 80 100 S e n si ti v it y ( % ) 100% - Specificity% Brief-BESTestC
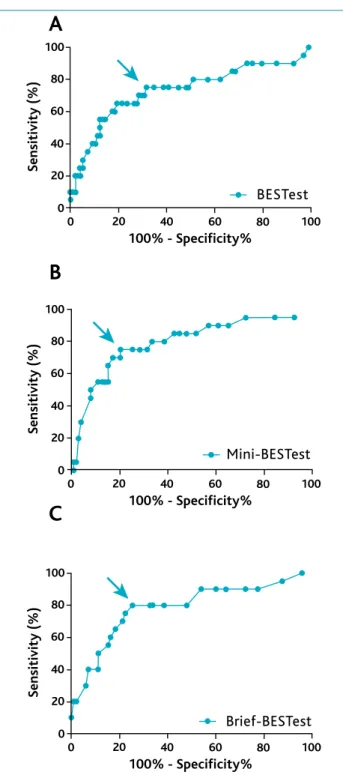
Figure 1. Receiver operator characteristics of the (A) Balance Evaluation Systems Test, (B) Mini-Balance Evaluation System Test and (C) Brief-Balance Evaluation System Test to differentiate bet-ween self-reported prior history of non-fallers and multiple fallers. The points corresponding to cutoff points are indicated by arrows (n=118).
390
B
D
A
C
F
E
G
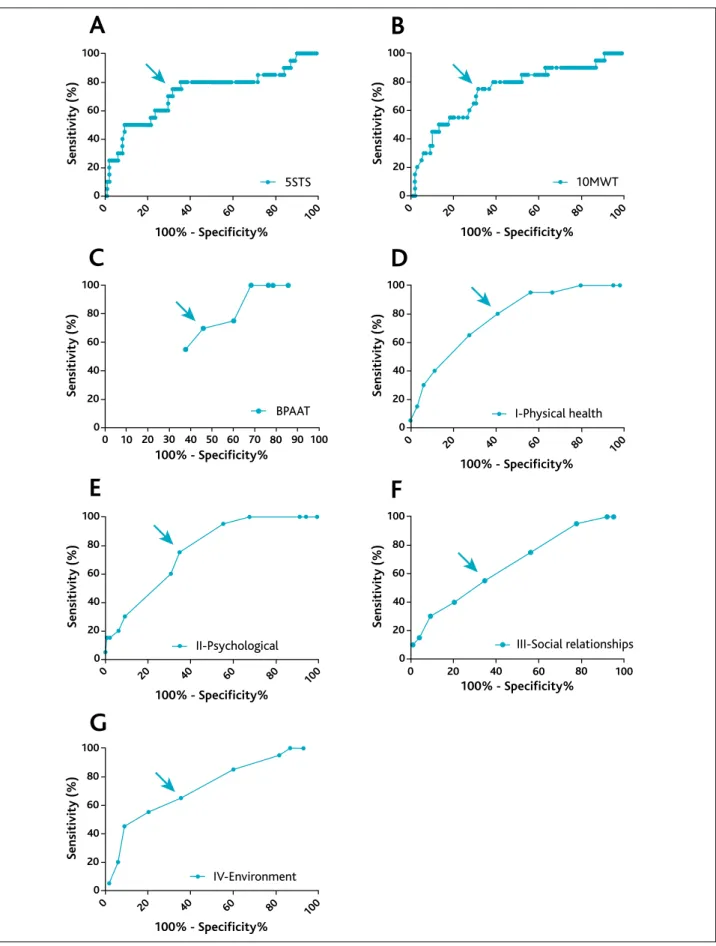
100 80 60 40 20 0 40 20 0 60 80 100 100% - Specificity% S e n si ti v it y ( % ) 10MWT 100 80 60 40 20 0 40 20 0 60 80 100 100% - Specificity% S e n si ti v it y ( % ) I-Physical health 100 80 60 40 20 0 40 20 0 60 80 100 100% - Specificity% S e n si ti v it y ( % ) 5STS 100 90 80 70 60 50 40 30 20 10 0 100 80 60 40 20 0 S e n si ti v it y ( % ) 100% - Specificity% BPAAT 100 80 60 40 20 0 40 20 0 60 80 100 100% - Specificity% S e n si ti v it y ( % ) III-Social relationships 100 80 60 40 20 0 40 20 0 60 80 100 100% - Specificity% S e n si ti v it y ( % ) II-Psychological 100 80 60 40 20 0 40 20 0 60 80 100 100% - Specificity% S e n si ti v it y ( % ) IV-EnvironmentFigure 2.Receiver operator characteristics of the (A) Five Times Sit to Stand Test, (B) 10 Meter Walk Test, (C) Brief Physical Activity Assessment Tool, (D) World Health Organization Quality of Life-Bref Physical health, (E) World Health Organization Quality of Life-Bref Psychological,
(F) World Health Organization Quality of Life-Bref Social relationships and (G) World Health Organization Quality of Life-Bref Environment
to differentiate between self-reported prior history of non-fallers and multiple fallers. The points corresponding to cutoff points are indica-ted by arrows (n=118).
Our findings showed that multiple-fallers presented worse HRQoL than non-fallers, as corroborated by the literature.8Although the impact of falls on the quality of life is well established, the ability of the quality of life to detect the risk of falls is poorly explored. According to the authors’ best knowledge, this is the first study providing a cutoff to distinguish the self-reported pri-or histpri-ory of non-fallers and multiple fallers using an HRQoLtool. The established cutoffs for the different do-mains of the WHOQoL-Bref might be useful to identify those to whom a preventive and/or effective interven-tion for falls might be a priority.
These values will enable professionals to interpret re-sults with more confidence and take informed action (e.g., referral for comprehensive balance assessments and personalized interventions since those who have fallen are more likely to fall again)22based on the results obtained, preventing disability and promoting healthy aging in community-dwelling older people.
This study has several limitations that need to be ac-knowledged. Due to the nature of this cross-sectional study, the ability to identify a history of falls was ana-lyzed retrospectively. Thus, future studies should con-duct longitudinal studies to assess the ability of the tools to identify multiple fallers prospectively. Moreover, falls were based on individuals’ self-report, hence, some de-gree of bias might have been present despite the im-portant contribution to the understanding balance and functional ability, gait speed, self-reported PA, and HRQoL in community-dwelling older people. Mini-BESTest and Brief-Mini-BESTest scores were derived from the original BESTest, thus it is possible to have occurred inter-item influences. In future studies, each test should be performed separately.
CONCLUSIONS
In conclusion, this study showed significant correla-tions between the BESTest and its short versions, with functional ability, gait speed, self-reported PA, and HRQoL in community-dwelling older people. Higher associations were found with the short versions. Since these comprehensive balance tools allow the identifi-cation of domains where balance is preserved or im-paired, their use in clinical practice offers great poten-tial to personalize interventions and effectively pro-mote healthy aging in community-older people.
BESTest and its short-versions and tools commonly used to assess functional ability, gait speed, self-re-ported PA and HRQoL in community-dwelling older people were able to distinguish between the self-re-ported prior history of non-fallers and multiple fallers. Cutoff points were identified for BESTest, Mini-BESTest, Brief-BESTest, 5STS, 10MWT, BPAAT, and WHOQoL-Bref. Health professionals can now use these cutoffs to identify those who might benefit from a more compre-hensive balance assessment which will inform who to prioritize for balance interventions. These findings are of great importance since falls prevention is a main goal in older populations that needs comprehensive and re-alistic interventions to be implemented.
REFERENCES
1. World Health Organization. Ageing and life course [homepage]. Gene-va: WHO; 2018. Available from: https://www.who.int/ageing/en/ 2. Almeida SI, Marques A, Santos J. Normative values of the balance
eval-uation system test (BESTest), mini-bestest, brief-bestest, timed up and go test and usual gait speed in healthy older Portuguese people. Rev Port Med Geral Fam. 2017;33(2):106-16.
3. World Health Organization. WHO global report on falls prevention in older age. Geneva: WHO; 2007. ISBN 9789241563536
4. Boyé ND, Van Lieshout EM, Van Beeck EF, Hartholt KA, Van der Cam-men TJ, Patka P. The impact of falls in the elderly. Trauma. 2013;15(1):29-35.
5. Nilsagård Y, Andreasson M, Carling A, Vesterlin H. Examining the valid-ity and sensitivvalid-ity to change of the 5 and 10 sit to stand tests in peo-ple with multipeo-ple sclerosis. Physiother Res Int. 2017;22(4).
6. Spagnuolo DL, Jürgensen SP, Iwama AM, Dourado VZ. Walking for the assessment of balance in healthy subjects older than 40 years. Geron-tology. 2010;56(5):467-73.
7. Washburn RA, Smith KW, Jette AM, Janney CA. The physical activity scale for the elderly (PASE): development and evaluation. J Clin Epi-demiol. 1993;46(2):153-62.
8. Ozcan A, Donat H, Gelecek N, Ozdirenc M, Karadibak D. The relation-ship between risk factors for falling and the quality of life in older adults. BMC Public Health. 2005;5:90.
9. Langley FA, Mackintosh SF. Functional balance assessment of older community dwelling adults: a systematic review of the literature. In-ternet J Allied Health Sci Pract. 2007;5(4):ID13.
10. Santos GM, Souza AC, Virtuoso JF, Tavares GM, Mazo GZ. Predictive val-ues at risk of falling in physically active and no active elderly with berg balance scale. Rev Bras Fisioter. 2011;15(2):95-101.
11. Franchignoni F, Horak F, Godi M, Nardone A, Giordano A. Using psy-chometric techniques to improve the balance evaluation systems test: the mini-BESTest. J Rehabil Med. 2010;42(4):323-31.
12. Horak FB, Wrisley DM, Frank J. The Balance Evaluation Systems Test (BESTest) to differentiate balance deficits. Phys Ther. 2009;89(5):484-98.
392
estudos
originais
13. Padgett PK, Jacobs JV, Kasser SL. Is the BESTest at its best? A suggest-ed brief version bassuggest-ed on interrater reliability, validity, internal consis-tency, and theoretical construct. Phys Ther. 2012;92(9):1197-207. 14. Marques A, Almeida S, Carvalho J, Cruz J, Oliveira A, Jácome C.
Relia-bility, validity, and ability to identify fall status of the Balance Evalua-tion Systems Test, Mini-Balance EvaluaEvalua-tion Systems Test, and Brief-Bal-ance Evaluation Systems Test in older people living in the community. Arch Phys Med Rehabil. 2016;97(12):2166-73.
15. Deandrea S, Lucenteforte E, Bravi F, Foschi R, La Vecchia C, Negri E. Risk factors for falls in community-dwelling older people: a systematic re-view and meta-analysis. Epidemiology. 2010;21(5):658-68. 16. Huang TT, Wang WS. Comparison of three established measures of fear
of falling in community-dwelling older adults: psychometric testing. Int J Nurs Stud. 2009;46(10):1313-9.
17. Marques A, Cruz J, Quina S, Regêncio M, Jácome C. Reliability, agree-ment and minimal detectable change of the Timed Up & Go and the 10 Meter Walk tests in older patients with COPD. COPD. 2016;13(3): 279-87.
18. Beauchet O, Annweiler C, Allali G, Berrut G, Herrmann FR, Dubost V. Recurrent falls and dual task-related decrease in walking speed: is there a relationship? J Am Geriatr Soc. 2008;56(7):1265-9.
19. Buatois S, Miljkovic D, Manckoundia P, Gueguen R, Miget P, Vançon G, et al. Five times sit to stand test is a predictor of recurrent falls in healthy community living subjects aged 65 and older. J Am Geriatr Soc. 2008; 56(8):1575-7.
20. Hwang HF, Liang WM, Chiu YN, Lin MR. Suitability of the WHOQOL-BREF for community-dwelling older people in Taiwan. Age Ageing. 2003; 32(6):593-600.
21. Daskalopoulou C, Stubbs B, Kralj C, Koukounari A, Prince M, Prina AM. Physical activity and healthy ageing: a systematic review and meta-analysis of longitudinal cohort studies. Ageing Res Rev. 2017;38:6-17. 22. Ganz DA, Bao Y, Shekelle PG, Rubenstein LZ. Will my patient fall? JAMA.
2007;297(1):77-86.
23. United Nations. World population ageing 2019: highlights. New York: UN; 2019. ISBN 9789210045537
24. Bohannon RW. Comfortable and maximum walking speed of adults aged 20-79 years: reference values and determinants. Age Ageing. 1997;26(1):15-9.
25. Marshall A, Smith B, Bauman A, Kaur S, Bull F. Reliability and validity of a brief physical activity assessment for use by family doctors. Br J Sports Med. 2005;39(5):294-7.
26. World Health Organization. WHOQOL-BREF: introduction, adminis-tration, scoring and generic version of the assessment [Internet].
Gene-va: WHO; 1996. Available from: https://www.who.int/mental_health/ media/en/76.pdf?ua=1
27. Cruz J, Jácome C, Marques A. Validity of the Brief physical activity as-sessment tool for clinical use in COPD. Eur Respir J. 2017;50(Suppl 61):PA2565.
28. Book review: Three books on statistical power analysis and related ideas. J Stat Comput Simul. 2005;75(12):1019-20.
29. de Labra C, Maseda A, Lorenzo-López L, López-López R, Buján A, Ro-dríguez-Villamil JL, et al. Social factors and quality of life aspects on frailty syndrome in community-dwelling older adults: the VERISAÚDE study. BMC Geriatr. 2018;18(1):66.
30. Makizako H, Shimada H, Doi T, Tsutsumimoto K, Nakakubo S, Hotta R, et al. Predictive cutoff values of the Five-Times Sit-to-Stand Test and the Timed ‘Up & Go’ Test for disability incidence in older people dwelling in the community. Phys Ther. 2017;97(4):417-24.
31. Tiedemann A, Shimada H, Sherrington C, Murray S, Lord S. The com-parative ability of eight functional mobility tests for predicting falls in community-dwelling older people. Age Ageing. 2008;37(4):430-5. 32. Chen JC, Liang CC, Chang QX. Comparison of fallers and nonfallers on
four physical performance tests: a prospective cohort study of com-munity-dwelling older indigenous Taiwanese women. Int J Gerontol. 2018;12(1):22-6.
33. Pereira CL, Baptista F, Infante P. Role of physical activity in the occur-rence of falls and fall-related injuries in community-dwelling adults over 50 years old. Disabil Rehabil. 2014;36(2):117-24.
CONFLICTS OF INTEREST AND SOURCE OF FUNDING
The authors have no conflict of interest to disclosure.
This work was funded by Programa Operacional de Competitividade e In-ternacionalização – POCI, through Fundo Europeu de Desenvolvimento Re-gional – FEDER (POCI-01-0145-FEDER-007628), Fundação para a Ciência e a Tecnologia (PTDC/SAU-SER/28806/2017; SFRH/BD/1206958/2016; SFRH/BD/148741/2019) and under iBiMED – Institute of Biomedicine (UIDB/04501/2020). CORRESPONDING AUTHOR Alda Marques E-mail: [email protected] https://orcid.org/0000-0003-4980-6200 Recebido em 13-11-2019
ABSTRACT
BALANCE AND HEALTHY AGING: A CLOSE RELATIONSHIP
Objectives:This study explored the: i) correlations between the Balance Evaluation Systems Test (BESTest) and its short-ver-sions (Mini-BESTest and Brief-BESTest), with functional ability, gait speed, physical activity, and health-related quality of life; ii) ability of the Five Times Sit to Stand (5STS), 10 Meter Walk Test (10MWT), Brief Physical Activity Assessment Tool (BPAAT) and World Health Organization Quality of Life-Bref (WHOQoL-Bref) to identify the prior history of falls in community-dwelling ol-der people.
Methods:An exploratory cross-sectional study was conducted with healthy older people living in the community. Balance (BES-Test and its short versions), functional ability (5STS), gait speed (10MWT), physical activity (BPAAT), and health-related quali-ty of life (WHOQoL-Bref) were assessed. Spearman correlation coefficient and receiver operating characteristics analysis were calculated.
Results:One hundred and eighteen individuals (76[69-83.3] years; n=79, 66.9% female) participated in this study. Correlations between balance and functional ability (-0.61< r < -0.51, p<0.001), gait speed (0.69 < r < 0.78, p<0.001), physical activity (0.39 < r < 0.42, p<0.001) and health-related quality of life (0.28 < r < 0.57, p≤0.002) were identified. The following cutoff points to differentiate between prior history of falls were established: 80.5 points for the BESTest, 16.5 points for the Mini-BESTest and 12.5 points for the Brief-BESTest, 13.5s for the 5STS, 1.2m/s for the 10MWT, 1.5 points for the BPAAT and 14.5/66; 14.5/66; 14/62.5; 15.5/72 points for domains I, II, III and IV, respectively, of the WHOQoL-Bref 0-20/100.
Conclusion:The BESTest and its short versions correlated with functional ability, gait speed, physical activity, and health-rela-ted quality of life in older people. These outcomes can differentiate prior history of falls in community-dwelling older people. Keywords:Community-dwelling older people; Falls; Functional ability; Health-related quality of life; Self-reported physical ac-tivity.
Rev Port Med Geral Fam2020;36:383-95 394
estudos
originais
20 20 10 15 10 5 0 0 Brief-BESTest W H O Q o L-B re f I r=0.57 CI=0.43 to 0.68 p<0.0001 D3 20 10 0 0 2 4 6 8 C3 Brief-BESTest B P PA T r=0.42 CI=0.26 to 0.56 p<0.0001 20 15 10 5 0 0 2 4 6 B3 Brief-BESTest 1 0 M W T r=0.77 CI=0.68 to 0.83 p<0.0001 Brief-BESTest 20 10 0 0 10 20 30 A3 r=0.61 CI=0.72 to -0.48 p<0.0001 5 S T S 30 20 10 0 0 10 20 30 5 S T S Mini-BESTest r=0.59 CI=0.70 to -0.46 p<0.0001 A2 10 5 S T S20 30 0 0 50 100 BESTest r=0.51 CI=0.64 to -0.36 p<0.0001 A1 BESTest 100 50 0 0 2 4 6 B1 r=0.69 CI=0.57 to -0.77 p<0.0001 1 0 M W T 1 0 M W T 0 0 20 30 10 2 4 6 Mini-BESTest r=0.78 CI=0.70 to 0.85 p<0.0001 B2 C1 BESTest B P PA T r=0.39 CI=0.23 to -0.54 p<0.0001 100 50 0 0 2 4 6 8 0 0 2 4 6 8 10 20 30 B P PA T Mini-BESTest C2 r=0.40 CI=0.24 to 0.55 p<0.0001 100 50 0 0 5 10 15 20 r=0.46 CI=0.30 to -0.59 p<0.0001 D1 BESTest W H O Q o L-B re f I W H O Q o L-B re f I Mini-BESTest 30 20 10 0 0 5 10 15 20 r=0.53 CI=0.39 to 0.66 p<0.0001 D2Figure S1.Scatterplots showing the correlations between Balance Evaluation Systems Test, Mini-Balance Evaluation System Test and Brief-Balance Evaluation Systems Test and Five Times Sit to Stand test: A1-3, 10 Meter Walk Test: B1-3, Brief Physical Activity Assessment Tool: C1-3, and World Health Organization Quality of Life-Bref domain I: D1-3, domain II: E1-3, domain III: F1-3, domain IV: G1-3 (n=118).
Legends: 5STS = Five Times Sit to Stand test; 10MWT = 10 Meter Walk Test; BESTest = Balance Evaluation Systems Test; BPAAT = Brief Physical Activity Assessment Tool; CI = Confidence interval; WHOQoL-Bref = World Health Organization Quality of Life-Bref.
395