Maria-Giovanna Masciotta
a,⇑, João C.A. Roque
b, Luís F. Ramos
a, Paulo B. Lourenço
a aISISE, University of Minho, Department of Civil Engineering, Campus de Azurém, Guimarães, PortugalbPolytechnic Institute of Bragança, Department of Applied Mechanics, Bragança, Portugal
h i g h l i g h t s
A wide experimental/numerical campaign is carried out on a famous historic church. The structural behaviour is evaluated through a multidisciplinary approach. Different diagnosis and analysis tools are used for assessing the system health. Potential collapse mechanisms are identified.
The environmental variability of static and dynamic behaviour is analysed.
a r t i c l e
i n f o
Article history:
Received 14 January 2016
Received in revised form 22 April 2016 Accepted 28 April 2016
Available online 4 May 2016
Keywords:
Historical masonry structures Multidisciplinary approach Structural health monitoring Environmental effects Safety assessment
a b s t r a c t
The preservation and risk mitigation of built cultural heritage require the use of reliable tools which enable to give a better insight into the complex behaviour of these structures, by providing a correct diag-nosis of their health conditions, and to identify potential vulnerabilities in order to prevent the risk of damage and to design in advance adequate retrofit solutions. The present paper describes an extensive experimental/numerical investigation campaign carried out on the Church of Monastery of Jerónimos in Lisbon in accordance with an iterative multidisciplinary approach and with the purpose of assessing the health state of one of the most prominent Portuguese monument, in light of future prevention actions. Special stress is given to the diagnostic procedure which includes and details in situ and labora-tory testing, dynamic identification, continuous structural health monitoring and analysis of environ-mental effects on the static and dynamic behaviour of the church. The structural performance of the temple under conditions of gravity loading is analysed as well and potential collapse mechanisms are identified. The results are compared with the actual response of the temple allowing to evaluate its safety level.
Ó2016 Elsevier Ltd. All rights reserved.
1. Introduction
Architectural heritage is an irreplaceable expression of the intellectual richness and cultural diversity of modern societies. The protection and enhancement of heritage structures do imply acknowledgement and respect of different cultural roots and belief systems. In a changing world, built cultural landmarks provide
identity to people, regions and towns and act as live documents of outstanding technical achievements from which study and uti-lization the mankind can still learn and improve. In addition to their historical interest, monuments do yield aesthetic, environ-mental and economic benefits, contributing to the global wealth and the touristic attractiveness of a country. For these reasons, the conservation and maintenance of architectural heritage is not only a cultural requirement[1].
In this context, the structural analysis and the safety assess-ment of historical constructions are issues of great importance, but they conceal several challenges and difficulties due to the geometrical complexity of ancient structures, the variability of
http://dx.doi.org/10.1016/j.conbuildmat.2016.04.146
0950-0618/Ó2016 Elsevier Ltd. All rights reserved.
⇑ Corresponding author at: ISISE, University of Minho, Department of Civil
Engineering, Campus de Azurém, 4800-058 Guimarães, Portugal.
E-mail addresses: [email protected](M.-G. Masciotta), [email protected]
(J.C.A. Roque), [email protected] (L.F. Ramos), [email protected]
materials and building techniques adopted, the poor knowledge on past events which might have affected the current condition of the constructions and the lack of design codes. Thus, the restoration projects related to architectural heritage are not straightforward and they require a multidisciplinary approach able to foster a fully comprehension of the structural behaviour before proceeding with specific conservation measures. In the last decades, recommenda-tions have been proposed [3] to ensure systematic methods of analysis and adequate tools of intervention in order to guarantee safety and durability of heritage structures without compromising their historical value.
In the process of preserving ancient buildings, engineers should act according to a step-by-step methodology organised in stages similar to those used in medicine[2]: condition survey (anamnesis), identification of the causes triggering damage and decay (diagnosis), choice of the remedial measures (therapy) and control of the efficiency of the interventions (control). Within this methodology, the first two stages are crucial for the subse-quent decision-making with regard to the need of specific treat-ment measures, whereas the last stage is fundatreat-mental in terms of monitoring and evaluation of the effectiveness of the interven-tion. Any heritage structure is the result of different building phases, constructional techniques and changes which have fol-lowed over time up to the present state. Therefore, condition sur-vey, direct observation of structural and non-structural damage, historical investigation, non-destructive tests, health monitoring and structural analysis procedures are all indispensable tasks within this iterative process for safety evaluation of heritage structures. A more exhaustive discussion on these issues can be found, e.g.[4].
In this paper, an outstanding example of Portuguese architec-tural heritage, i.e. the Church of Monastery of Jerónimos in Lisbon, is selected as a case study in order to provide the reader with a full-scale application in which different diagnosis and analysis tools are combined together to achieve a thorough assessment of the struc-tural performance of the monument in accordance with the afore-mentioned multidisciplinary approach. This case study may also serve as an example on how to address similar issues in analogous heritage structures. The information acquired at each stage repre-sent a step forward within this gradual and continuous process of knowledge accumulation. Firstly, the paper details the investiga-tions carried out for the experimental characterization of the church, including ultrasonic and radar inspections for the defini-tion of the internal constitudefini-tion of the structural elements, labora-tory tests on sampled materials for the estimation of the mechanical features and output-only modal analysis techniques for the identification of the dynamic parameters of the structure. Then, two main aspects are treated: the safety assessment of the church under conditions of gravity loading and the characteriza-tion of the structural behaviour over time from both static and dynamic points of view. Special regard is given to the environmen-tal variability of the system, as subtle changes caused by damage in masonry structures may be often masked by changes due to varying ambient conditions[5–6]. Indeed, in the last decades, the analysis of the environmental effects on the system’s behaviour has been regularly introduced in the common practice of structural health monitoring[5–11].
Although the structural behaviour of this monument has been already explored [7,12], new and fundamental aspects are addressed in the present work. The final scope of the paper is to give completeness to the diagnostic investigation of the Church of Jerónimos, merging the findings hereafter presented with the ones obtained in previous studies, in order to attain a deep com-prehension of the global behaviour of this outstanding historical landmark for future design of adequate remedial measures.
2. Description of the case study and historical background
Built in three successive phases during the XVI century, the Church of ‘Santa Maria de Belém’ is within one of the most notable examples of Late Gothic Manueline style of Portuguese architec-ture, namely the monastic complex of Jerónimos in Lisbon. The majestic monastery (Fig. 1a), four times smaller than the original planned construction, stretches over an area of 30050 m2and
develops around two courts. The larger court is bordered by a two-storey arcade which hosts the Ethnographic Museum of Archaeology and the Maritime Museum, whereas the smaller court or Cloister (Fig. 1c) is bordered by the Sacristy, the Chapter Room, the Refectory and the Church (Fig. 1b), object of the present work. Oriented towards the liturgical East, the plan of the temple is characterized by a cruciform shape with a single nave crossed by a transept with two lateral chapels and a chancel (Fig. 2). A single bell tower of 50 m height rises in the corner between south and west façades. The church was built with limestone (‘‘calcário de lioz”) quarried locally and has considerable dimensions, viz. a length of 70 m, a width of 23 m (40 m in the transept) and an aver-age height of 24 m. Either limb is covered with a slightly curved barrel vault provided with stone ribs that branch according to a spider’s web pattern (Fig. 2b and c). Exceptional examples of space unit of the latest Gothic, the barrel vaults spring directly from one external wall to the other. Two rows of octagonal columns with a free height of 16 m and a radius ranging from 1.04 m (nave col-umns) to 1.88 m (nave-transept colcol-umns) divide almost impercep-tibly the longitudinal limb and the clear fusion of the naves. The columns are connected to the vault above by means of large fan capitals and do act as supports reducing the free span of the nave (Fig. 2c). On top of the vaults, brick masonry wallets built during the 1930 s provide support for the roofing tiles. The thickness of the walls varies from side to side ranging from 1.90 m of the south wall to 2.5 2.65 m of the east walls (chancel side), whereas the north wall has an average thickness of around 3.5 m due to the presence of an internal staircase which provides access to choir, cloister and bell tower. It is noticed that the south wall is pierced by large openings and its stability is ensured by three trapezoidal buttresses, which are indeed not aligned with the columns of the church. This proves that the south wall existed before the concep-tion of the vault.
The seismic performance of the compound was successfully tested during the great earthquake of 1755. In that occasion, no severe damage was registered in the monastery. On the contrary, the subsequent shake of 1756 caused the collapse of one of the col-umn supporting the vaults of the church (with subsequent ruin of the nave) and also the partial collapse of the vault of the higher choir[12]. In addition to these events, during the XIX century, changes were made in the structure of the two towers and in the roof. The effect of these changes in the seismic performance of the structure remained an open issue[12]. Hence, several studies and numerical simulations have been performed in the last dec-ades to investigate the structural behaviour of this temple[12–14].
3. In situ investigations in the church
3.1. Non-destructive tests (NDTs)
vertical bearing system and the nave vault of church, whose role in the structural response was deemed fundamental.
The topographic and photogrammetric survey of the nave vault [15] allowed to detect two different rib profiles serving to the
laying of the arch-stones, which are held by cramp irons and are placed in concentric way starting from the supports up to the vault (Fig. 3a). The survey also pointed out the presence of transversal deformations of nearly 6 cm in the sidewalls and
(a)
(b)
(c)
N
3
4
2
5
5
6
7
1
0.0 25.0 m
Fig. 2.Church of Monastery of Jerónimos: (a) plan (1. West portal, 2. South portal, 3. Nave, 4. Transept, 5. Lateral chapels, 6. Chancel, 7. South tower); (b) choir side view; and (c) detail of the ribbed vault.
out-of-plumbness of the columns, which lean towards the longitu-dinal walls with deviations between 5 cm and 18 cm (Fig. 3b). Radar and boroscope investigations enabled to inspect the covering of the vault which is made of thin stone slabs of 8–10 cm thickness laying on the stone ribs and covered by a variable thickness mortar layer. The voids and encrustations found in this layer warned of the presence of cracks in the ribs. It is further noticed that the part of the slab inside the capitals is filled with a concrete-like material consisting of stones and clay mortar for a total thickness of 0.35–0.40 m.
Results from the ultrasonic tests performed in three columns of the church highlighted that the columns of the nave are monolithic or formed by two/three limestone blocks with thin vertical joints, whereas the columns of the transept are made of four juxtaposed blocks[15]. Low speed values were obtained in two sections: at the base of the south column of the transept owing to the presence of fissures, and at 6.35 m height in one of the columns of the nave for undetected reasons. Complementary GPR investigations were also carried out in the four columns of the nave that feature larger slenderness. The inspections were executed at about 7 m height from the floor level (one third of the columns’ development) and revealed the homogeneity of the material as well as the absence of significant anomalies and cramp irons between stone blocks. A few shallow cracks (or stone detachments) were found in the col-umns, likely imputable to high stress levels or material defects.
3.2. Ambient vibration tests (AVTs) and dynamic identification
Dynamic identification tests were conducted in the main nave between 20th and 21st of April 2005[1,7,14,16] using ambient excitations as operational conditions. Before proceeding with the Ambient Vibration Tests (AVTs), a preliminary numerical modal analysis with a simplified FE model was carried out to select and optimize sensors number and layout, and to choose sampling fre-quency and time window for the data acquisition. According to the results, thirty measuring points were selected to acquire the dynamic response of the structure (Fig. 4a): twenty points were located either on top of the columns or on top of the nave extrados (after removing the tiles to avoid noise contamination from the roof structure above), whereas other ten points were deployed on top of the external walls of the nave so as to estimate the dynamic response of the church at the boundaries as well. Twenty-nine setups were used to record the accelerations of the chosen DOFs. Each setup consisted of two tri-axial force balanced accelerometers (Fig. 4b), namely one reference and one moving sensor, with a bandwidth range from DC to 100 Hz, a dynamic range of ±1.0 g, a sensitivity of 10 V/g and an operating
temperature range from 20°C to 70°C. Each sensor was
connected by cable to a strong motion recorder with 16-bit ADC analyser provided with batteries. The final resolution of both sen-sor and analyser was 8
lg. Note that the measurement equipment
employed for the modal identification is the same used for the sub-sequent dynamic monitoring task.In order to catch all meaningful vibration characteristics of the church, the signals were recorded with a sampling frequency of 200 Hz which is actually much higher than that required for the investigated structure, since the frequency content of the signals is below 20 Hz. Moreover, considering that the length of the acquired time window should not be less than 1000–2000 times the structure’s fundamental period[17], the modal identification was performed using time series of 600 s (10 min) which corre-spond to more than 2000 times the fundamental period of the church.
The extraction of the modal parameters from ambient data was carried out by comparing two different identification techniques, viz. the Enhanced Frequency Domain Decomposition (EFFD)[18] in the frequency domain and the data-driven Stochastic Subspace Identification (SSI)[19]in the time domain, both available in the commercial software ARTeMIS[20]. Either of the adopted identifi-cation technique allowed to estimate 8 vibration modes in the fre-quency range 3–16 Hz. The results in terms of frequencies, damping ratios and MAC values are summarized inTable 1. Despite a good correlation between the frequencies identified by the two methods, the MAC points out a moderate correlation in terms of modes, except for the lower ones which show excellent correlation with values close to the unit. Stated that difficulties in extracting higher modes arise when dealing with low levels of excitation associated with ambient measurements, in the present case the poor correlation between mode shapes estimates is likely more imputable to the large number of different setups adopted for the AVTs rather than other factors. This explains why the correla-tion between damping ratios estimates also results not very good. However, in what concerns the first two vibration modes (Fig. 5), it is clear that the dynamic response of the church is dominated by the modal deflections of the columns. In detail, the first mode is a bending mode involving flexure in the transversal plane (north-south direction), whereas the second mode is a local mode with significant components along both the vertical direction (nave vault) and the transversal direction (south longitudinal wall).
3.3. Laboratory tests
To gain more knowledge on the mechanical characteristics of the materials constituting the structural elements of the church,
(b)
(a)
several laboratory tests were performed[16]. Given the historical value of the building and the consequent restrictions in the removal of specimens, the tests were carried out on ad hoc masonry specimens made of limestone with properties similar to the limestone used to build the church (‘‘calcário de lioz”). The test
campaign consisted of two types of uniaxial compressive tests, viz. monotonic tests and cyclic tests, conducted on both cylindrical specimens (Ø60120 mm3) and masonry triplets
(120120180 mm3per unit), seeFig. 6. All tests were carried
out under conditions of constant humidity and temperature. In the monotonic tests, an increasing load was applied to the specimens to identify a reference value for the ultimate strength and to gain insight into the stress-strain and post-peak behaviour of the material. The tests were performed displacement controlled (v = 2
lm/s for the cylindrical samples and v = 4
lm/s for the
tri-plets) until failure and the force-displacement evolution was cap-tured with LVDTs. In the cyclic tests, oscillating loads with values between 10% and 70% of the average compressive strength esti-mated through the monotonic tests were applied to the specimens. These tests were performed force controlled (4 kN/s), with the exception of the last loading cycle which was executed displace-ment controlled. In what concerns the masonry triplets, three pro-totypes were tested: triplet with smooth units and dry joints (SD);Fig. 5.Experimental mode shapes[7]: (a) first mode shape at 3.7 Hz; and (b) second mode shape at 5.1 Hz.
(a)
(b)
Fig. 4.Ambient vibration tests: (a) deployment of the measuring points (the reference point P1 is marked with a dash circle); (b) moving tri-axial force balanced accelerometer used during the test.
Table 1
Comparison between the modal parameters estimated by the EFDD and the SSI.
Mode shape f[Hz] n[%] MAC
EFDD SSI EFDD SSI
Mode 1 3.69 3.68 2.34 1.26 0.99
Mode 2 5.12 5.04 1.11 2.68 0.92
Mode 3 6.29 6.30 1.00 0.82 0.67
Mode 4 7.23 7.29 0.77 1.44 0.67
Mode 5 9.67 9.65 1.10 1.45 0.62
Mode 6 11.64 11.65 1.20 1.46 0.36
Mode 7 12.45 12.51 1.25 1.19 0.71
triplet with bush hammered units and dry joints (BD); and triplet with bush hammered units and sandy-clay joints (BC) of 5 mm. Given the similarity with the historical masonry used in the con-struction of the church, the masonry prototype BC was finally selected as the most representative sample of the material used in the church. Table 2 summarizes the mechanical parameters obtained for both cylindrical specimens and BC masonry triplets in terms of compressive strength (fc), Young’s modulus (E) and Poisson’s ratio (v).
4. Structural assessment
After the historical analysis and the experimental investiga-tions, the next stage of the procedure for the evaluation of the health state of the Church of Jerónimos focused on the assessment of the safety level of the building under conditions of constant gravity loads. To this end, a finite element analysis was carried out in DIANA[21]software. Given the size and the great complex-ity of the structure, the geometry of the finite element model was simplified to a great extent. Though, particular attention was paid in the discretization of the model in order to reproduce the geo-metrical stiffness of the church as close to reality as possible.
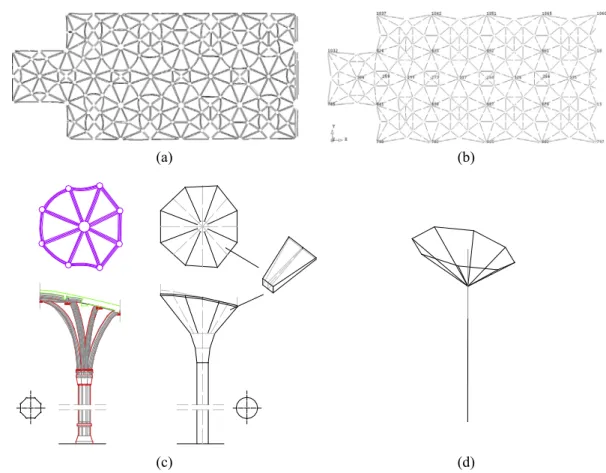
4.1. Description of the FE model
The 3D numerical model was built and calibrated using the dynamic features extracted from AVTs. The information provided by the NDTs was employed to accurately define the geometry of the FE model, whereas the results from the laboratory tests were used for the definition of the mechanical properties. The model consists of 2684 Timoshenko beam elements with quadratic inter-polation, 4242 nodes and 25,452 degrees of freedom (Fig. 7). The supports are fully restrained, being rotations possible given the non-linear material behaviour assumed. Special attention is given to the modelling of the vault and the piers of the nave (Fig. 8a and b). In detail, the ribs profiles of the vault are modelled by beam elements with trapezoidal cross section, whereas a T cross-section is adopted for the rib-slab system. Given the marginal contribution to the structural response, the mortar layer covering the stone slabs is taken into account only in terms of equivalent mass. As far as the piers are concerned, the octagonal geometry of the shaft is approximated by beam elements having a circular cross-section (Fig. 8c). The capitals are represented at the base by elements with a cone-frustum geometry and in the transition part to the vault by cuneiform elements radially set out (Fig. 8d). The infill of the cap-itals is not modelled but in terms of mass, considering negligible its
Table 2
Mechanical parameters estimated from uniaxial compressive tests.
Sample fc[MPa] E30%–60%[GPa] v
Monotonic Cyclic Monotonic Cyclic Monotonic Cyclic
Limestone cylindrical specimens 102.1 99.8 50.2 50.0a 0.25 0.25
Bush hammered & clay joints masonry triplets (BC) 58 61 25.9 53a
aEvaluated during the first loading/unloading cycle.
(b)
(a)
(d)
(c)
contribution to the structural response because of the poor mechanical properties of the material. The walls are modelled by a net of vertical and horizontal beam elements, with the mass entirely assigned to the vertical ones in order to avoid the occur-rence of marginal flexural stresses due to gravity load in the hori-zontal elements.
The constitutive model adopted for the stone masonry is a total crack strain model[21]characterized by a parabolic stress-strain relationship with a compressive strengthfcd= 10 MPa (estimated from the reference value obtained experimentally by taking into consideration the dispersion of the results, CV0.30%, and a safety factor for ancient masonry equal to 3), a tensile strength
ft= 0.01 MPa and a fracture energyGc= 16 kJ/m2. The material is assumed to be homogeneous with initial values of 25.9 GPa for the Young’s modulus and of 0.2 for the Poisson’s ratio. The weight per unit volume adopted for the masonry is 24 kN/m3. A
compre-hensive description of the FE model and its mechanical features is found elsewhere, e.g.[16].
A modal analysis was then carried out prior to the calibration of the numerical model.Table 3presents the numerical and experi-mental eigenfrequencies identified for comparable modes. Owing to the complexity of the structure and the difficulties in the modal parameters estimation, the FE model was manually tuned to the dynamic experimental results by using as a reference value for
(a)
(b)
(c)
(d)
the correlation the modal frequency of the first vibration mode, i.e. the mode featuring the highest participation factor [7,16]. The updating parameters initially selected are the moduli of elasticity of columns and nave, and the boundary conditions of the columns. Yet, considering that several parameters cannot be correctly updated by using just one reference as the inverse problem is highly ill-conditioned, the columns were finally considered as fully constrained and only the Young’s moduli of columns and nave were updated. Final values of 30 GPa and 12 GPa are obtained for the columns and the remaining masonry sub-structures, respec-tively. Given the high compressive stresses present in the columns because of their small cross section as well as the better quality of limestone blocks composing these bearing elements in comparison
to the quality of masonry used to build the other sub-structures, both the values of Young’s moduli are considered reasonable.
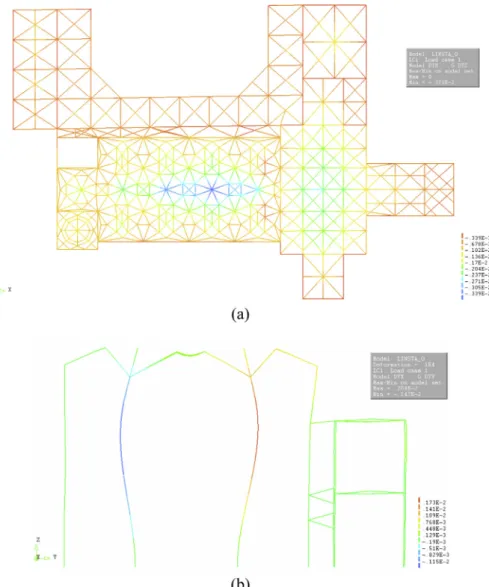
4.2. Safety assessment for gravity loading
In order to proceed with the evaluation of the safety level of the church, a first analysis was carried out under vertical loading assuming linear elastic behaviour of the material. The results indi-cated that the maximum deformations occur in the main nave of the church and are rather small.Fig. 9shows the typical arch shape deformation of the transversal section of the nave (central arcade), where maximum displacements of 3.7 mm and 21 mm are found for the vault key in vertical direction and for the upper part of the columns in horizontal direction, respectively. Unlike the north wall, the south wall does not show any outward displacement, sign of its minor sensitivity to the thrust action generated by the vault above. The stresses present in the structure are within the linear range of the material, e.g. the maximum compressive stresses in the columns are lower than 3.30 MPa. Tensile stresses up to 0.6 MPa are found in the nave vault, but they are very localized and the compressive stresses do not exceed 4.0 MPa in the critical areas where the ribs spring. Altogether, the average tensile stresses present in the structure are below the tensile strength of masonry. Table 3
Comparison between experimental and numerical eigenfrequencies.
Experimental Numerical
Mode fEXP[Hz] Mode fNUM[Hz]
1st 3.69 1st 3.79
2nd 5.12 4th 5.34
3rd 6.29 7th 6.23
4th 7.23 10th 6.61
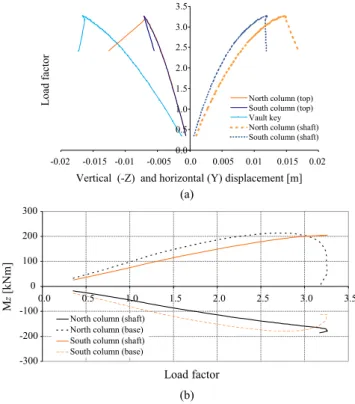
As columns and vault resulted to be the most critical sub-structures of the system, a second nonlinear static analysis under vertical loading was carried out in order to catch the possible occurrence of non-linear phenomena in these elements and to assess the global structural capacity of the church for gravity load-ing. A uniform distribution proportional to the mass is adopted for the loads (uniform pushover). The results of the nonlinear analysis are shown in Figs. 10a and 11 in terms of post-peak deformed shape and load-displacement diagram for both vault key and columns of the central arcade. Here, the load factor represents the ratio between the self-weight of the structure and the applied load. It is highlighted that the response of the church is severely affected by the structural behaviour of the supports, especially in regard to the north column which shows a sudden loss of bearing capacity associated with increasing horizontal and vertical dis-placements (up to 13 mm) which affect in turn the vault key. The ultimate load factor is 3.25 and corresponds to the collapse of the north column due to combined normal and flexural actions. For the same peak value the nave vault exhibits a nonlinear beha-viour with diffuse cracking. Note that the maximum ‘flexural moment’ at the base of the columns is attained for a load factor of 2.7 (Fig. 10b), but the stress redistribution associated with the nonlinear behaviour of the supports delays the failure. Therefore, the crushing of the north column occurs for increasing compressive stresses of decreasing eccentricity.
4.3. Final remarks
Notwithstanding the complexity of the case study, the numerical analyses carried out allowed to better understand the structural behaviour of the church and to conclude that: (a) the bearing capac-ity of the church under gravcapac-ity loading is considerably affected by the nave columns behaviour; (b) the potential collapse mechanism is associated with the failure of the north column of the central arcade; (c) even though the columns are very slender, the structural performance of the church under vertical loading is good.
5.1. Static monitoring system
The static monitoring system is active since June 2005 and it is composed by:
Two uniaxial tilt meters (TL1 and TL2) with a measurement range of ±1.5°and a resolution of 0.03°. The two tilt meters
are located at the nave extrados on top of the columns with lar-ger out of plumb and are positively oriented to North. TL1 mea-sures the inclination of the North column (C1) and TL2 tracks the inclination of the South column (C2);
Six surface temperature sensors (TS1 to TS6), with a measure-ment range varying from 20°C to +100°C and a resolution
of 0.2°C. Two sensors are installed at the nave extrados on
top of the observed columns and four sensors are installed in the north and south sidewalls. TS1 and TS2 register the temper-ature of outer and inner side of the north wall, respectively; TS4 and TS3 measure the temperature of outer and inner side of the south wall, respectively; and TS5 and TS6 record the tempera-ture on top of the north and south columns;
One data logger (D) for the data acquisition, provided with a Global System for Mobile (GSM) communication device to enable data remote downloading by phone line. The data logger is located inside a protection box in the bell tower.
On April 2007 the following devices were added to the perma-nent equipment:
One combined sensor to measure air temperature and relative humidity (TH). The temperature range goes from 20°C to
+70°C with a resolution of 0.2°C and the relative humidity
range varies from 0% to 100%, with a resolution of 2%; One ultrasonic 2D anemometer (W) to measure wind velocity
and direction, with an operating temperature between 35°C
and +70°C, an operating humidity between 5% and 100%, a
wind velocity range between 0 and 60 m/s with a resolution of 0.01 m/s, and a wind direction range of 360° with a
resolution of 1°.
The location of all devices is schematized inFig. 12. Since the columns determine the nave structural behaviour (see Section4), the monitoring system focuses on measuring the deformations of these elements. In order to catch daily temperature variations, the recordings are taken with a sampling rate of one per hour, equivalent to twenty-four events per day.
5.2. Dynamic monitoring system
The dynamic monitoring system is operating since April 2005 and it is composed by the same devices used for the dynamic
(b) -300
-200 -100 0 100 200
0.0 0.5 1.0 1.5 2.0 2.5 3.0 3.5
Load factor
M
z
[kNm]
North column (shaft) North column (base) South column (shaft) South column (base)
identification (Section3), namely two synchronized strong motion recorders (R) and two tri-axial force balance accelerometers (A1 and A2), seeFig. 13: sensor A1 is located at the base of the struc-ture near the chancel and is connected to the master recorder; sen-sor A2 is installed on the nave extrados in the location chosen as reference point during the AVTs and is connected to the slave recorder. Both recorders are installed near sensor A1 and are mutu-ally connected by an enhanced interconnection network which allows common trigger and time programmed records. In particu-lar, the monitoring system is set to acquire the response of the church according to the following schedule:
10 min records every month to compare the dynamic response of the church over time and to separate the influence of chang-ing environmental conditions on the structural behaviour; 10 min records every hour, one day per season, in order to
observe the daily seasonal fluctuations of the ambient parame-ters and their effect on the dynamic response of the church; Random records to measure the loading excitation anytime a
micro-tremor occurs. For this purpose the acceleration level for sensor A1 (on the base) is fixed to 0.5 mg in all directions
and for sensor A2 (on the main nave) is set to 10 mg inx direc-tion and to 50 mg foryandzdirections.
Since the force balance accelerometers are not enough to mon-itor the dynamic behaviour of the church in terms of mode shapes, only the global modal parameters (frequencies and damping coef-ficients) are being analysed. According to the results of the AVTs, all events are recorded with a sampling frequency of 100 Hz.
6. Monitoring results and environmental effects
6.1. Static behaviour of the church
Fig. 12.Static monitoring system: (a) and (b) sensors location; (c) temperature sensor; (d) tilt meter; and (e) data logger.
possible, this section presents the results beginning from 23rd April 2007. Fig. 14a shows the evolution of the air temperature along with the columns’ surface temperature over nearly seven cycles, where each one-year cycle embraces four seasonal fluctua-tions. As it can be observed, air and surface temperatures are char-acterized by the same trend, with the exception of the surface temperature of the north column (TS5) which presents an odd upward shift since May 2012, probably caused by the detachment of the sensor from the surface. Thus, after this date, the measure-ments recorded by sensor TS5 are deemed unreliable and will not be considered in the following analysis. Regarding the wind (Fig. 14b), it is noted that the instantaneous speeds recorded over time range from zero to about 12 m/s and the average speed is
always below 3 m/s, meaning that the energy available in the wind is rather low.
(a)
(b)
(c)
(d)
-0.30 -0.20 -0.10 0.00 0.10 0.20 Ma r-0 5 Sep-05 Ma r-0 6 Sep-06 Ma r-0 7Sep-07 Feb-08 Aug-08 Feb-09 Aug-09 Feb-10 Aug-10 Feb-11 Aug-11 Feb-12
Aug-12
Feb-13 Jul-13 Jan-14 Jul-14 Jan-15
Rotation [mm/m]
Date
Variation of Columns Rotation over Time
C1 (North) C2 (South)
r= 0.66
0 10 20 30 40 50 -0.30 -0.20 -0.10 0.00 0.10 0.20 Feb-07 Aug-07
Feb-08 Jul-08 Jan-09 Jul-09
Jan-10
Jul-10 Jan-11 Jul-11
Jan-12 Jul-12 Jan-13 Jul-13 Jan-14 Jun-1 4 Dec -14 T em p erature [ °C] Rotation [mm/m] Date
Temperature Effect on the Columns Rotation
C1 (North) C2 (South) TH
R² = 0.53
R² = 0.42 -0.40 -0.30 -0.20 -0.10 0.00 0.10 0.20
0 5 10 15 20 25 30 35 40
Rotation
[mm/m]
Temperature [°C]
Rotation of the North Column (C1)
vs Air Temperature TH
2005-2009 2010-2014
r= 0.65
r= 0.73
R² = 0.70 -0.40 -0.30 -0.20 -0.10 0.00 0.10 0.20
0 5 10 15 20 25 30 35 40
Rotation
[mm/m]
Temperature [°C]
Rotation of the South Column (C2)
vs Air Temperature TH
r= 0.84
movements, the horizontal displacements at the top of the col-umns range between 0.21 mm and 0.32 mm. The inspection of Fig. 15b reveals that the cyclic oscillations of the columns consid-erably suffer from the seasonal fluctuations of the temperature: when the temperature goes up, the columns do rotate towards north, whereas when the temperature goes down, the columns do lean towards south. However, after each cycle, the columns never recover their original position, but show an increasing resid-ual tilt towards south which indicates that the out-of-plumbness of both supports is permanent and keeps on raising over time, espe-cially in regard to column C1. This behaviour is further confirmed by the analysis of the rotation-temperature relationships which show a remarkable change of the slope of the regression line for the north column C1 (Fig. 15c), although the range of temperature variation remains almost the same. On the contrary, the rotation-temperature relationship of column C2 does not vary over time and results to be much stronger, with coefficients of correlationr and determination R2 equal to 0.84 and 0.70, respectively
(Fig. 15d).
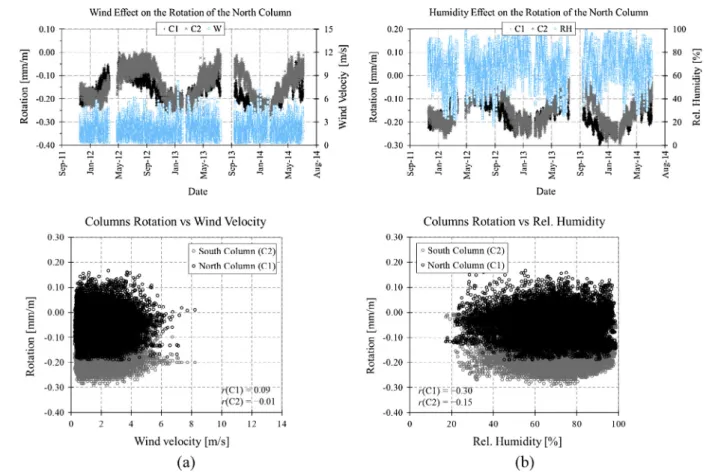
In order to investigate whether exogenous phenomena related to relative humidity and wind may influence somehow the col-umns rotation, the tilt data are also analysed with respect to these environmental parameters.Fig. 16plots the results relevant to the last two-year span. As conceivably verified by evaluating the coef-ficients of correlation, a weak correlation is found between the rel-ative humidity and the rotation of the north column (rC1= 0.30),
whereas almost no correlation exists between the relative humid-ity and the rotation of the south column (rC2= 0.15). Given the
low value of average wind speed recorded over time, no direct influence of the wind on the static behaviour of the columns is detected.
6.2. Dynamic behaviour of the church
In this section the results from the dynamic monitoring cam-paign carried out between 24th August 2005 and 28th April 2008 are presented and analysed with respect to four independent ambient variables: air temperature, relative humidity, wind and level of excitation. During this period, a total number of 1809 data-sets were acquired, of which 40% corresponds to programmed events of 10 min (monthly and seasonal events) and 60% corre-sponds to triggered events with an average duration of about 75 s. As datasets of various duration are characterized by different accuracy and uncertainty, the estimation of the dynamic features is performed by only processing the programmed events. Since higher vibration amplitudes are expected at the roof level, the analysis will concern the programmed events recorded in sensor A2.
6.2.1. Automated modal parameter estimation
The estimation of the global dynamic characteristics of the church is carried out through an automatic processing algorithm implemented in MATLAB[22] that makes use of the Stochastic Subspace Identification (SSI) method[19]as fulcrum for the fea-tures extraction process. Like all parametric system identification techniques[9,11,23], a user-defined integer is required, i.e. the maximum model order. In the present application, after testing dif-ferent values of model order in the range 20–100 with increments of 10, a maximum model order of 50 is selected. As an example, Fig. 17 shows the stabilization diagrams for the chosen model order before and after clearing. The final physical modes are selected according to a clustering approach. A cluster is a set of data points whose grouping meets similarity criteria, e.g. consistency
in terms of estimated frequencies as well as damping coefficients. For each model orderi,nclusters of datasets are created based on the following criteria:
dcv;i¼ jfcv fij fthr ð1Þ
nthr;minni;iþ1nthr;max ð2Þ
in whichd(cv,i)is the Euclidian distance,fcvandfthrstand for fre-quency control value and frefre-quency threshold value, whilenthr,min andnthr,maxindicate minimum and maximum damping coefficient threshold values, respectively. Clusters whose elements meet the Frequency Assurance Criterion (FAC) and the Modal Assurance Criterion (MAC) are selected for the candidate modes:
FAC¼ fiþi fi fi
FACthr; k¼ ½1;2; n ð3Þ
minðMACi;iþ1ÞkMACthr; k¼ ½1;2; n ð4Þ
Unlike spurious modes, physical modes are characterized by poles with nearly identical frequenciesfi, damping ratiosniand mode shapesui. Although only a single measurement point (A2) is available in this case, the MAC is not discarded but exploited as a relative modal amplitude comparison of the identified pole-weighted mode shape component/ioto assist in the selection of the physical modes along with the FAC and perform a more accu-rate clustering analysis.
The characteristic values of each physical mode are computed by averaging frequency and damping values obtained iteratively per each model order. Finally, the whole routine is looped in order to estimate the characteristic values of each mode throughout the monitoring period along with their 95% confidence intervals. In this regard, it is stressed that, dealing with a large number of data, a normal distribution is assumed and the two-sided confidence limits around each predicted valueyˆare evaluated as follows:
½^y 1:96
r
y;y^þ1:96r
y ð5Þwhere
r
yis the estimated standard deviation ofyˆand 1.96 is found from a statistical t-distribution table. The definition of such confi-dence intervals provides an unbiased criterion to identify the occur-rence of damage if the predicted values of new observations do not lie within the estimated confidence limits.In this study, the control values required for the automated (operational) modal analysis are defined using as reference param-eters the results from the previous ambient vibration tests (see Section 3.2). Before starting the procedure, a preliminary pre-processing task is performed, including decimation, de-trending and band-pass filtering of the collected signals. The adopted acqui-sition and data processing parameters are summarized inTable 5. The datasets not matching the sorting criteria imposed by the con-trol values are discarded during the process.
6.2.2. Results of the long-term dynamic monitoring
In the automated dynamic identification of the church, three modes are found, namely the first, the third and the fourth mode. The second vibration mode could not be estimated accurately. Fig. 18presents the frequencies tracking over the monitoring per-iod, whereas the statistical values of natural frequencies and modal damping ratios for the identified modes are given in Table 6 together with the statistics of the measured environmental vari-ables. The magnitude of the ambient noise level is here expressed by the Root Mean Square (RMS) of the three acceleration channels recorded in sensor A2. The standard deviations and the coefficients of variation (CVs) of the natural frequencies allow to understand that environmental variables have a strong influence, especially for mode 1 where the CV equals 2.20%, while mode 4 seems to be less influenced by environmental factors (CV = 1.11%). As far as the estimation of the damping coefficients is concerned, as expected, the results point out higher dispersions: the CV varies
3.0 4.0 5.0 6.0 7.0 8.0
Aug-05 Oct-05 Nov-05 Jan-06 Mar-06 May-06 Jul-06 Sep-06 Nov-06 Jan-07 Mar-07 May-07 Jul-07 Sep-07 Nov-07 Jan-08 Mar-08 May-08
Frequency [Hz]
Date
Frequency Evolution over Time
Mode3
Mode1 Mode4
Fig. 18.Variation of the identified natural frequencies during the monitoring period.
Table 5
Acquisition and data processing parameters for the automated modal identification.
Parameters Description Value
Acquisition parameters Sampling rate [Hz] 100
Signal duration [s] 600
Sampling interval [h] Variable
Processing parameters State-space model order 50
Decimation factor 5
Frequency range 3.0–8.0
Damping range 0.1–5.0
FAC threshold 0.06
MAC threshold 0.90
in fact between 22% of mode 1 and 40% of mode 4. The triggered events were analysed with the only purpose of gaining a better insight into the level of ambient excitation throughout the moni-toring period. As shown in Fig. 19a, the ambient noise is very low but a few isolated micro-tremors, mainly due to rally events and concerts taking place in the surrounding area, are discernible. It is worth noting that on 12 February 2007, at 10:35 am, a moder-ate earthquake of magnitude Mw= 6.1 and with epicentre offshore Southwest Iberia occurred. The Monastery felt the ground shaking and its response was acquired by the strong motion recorders installed in the church (Fig. 19b). As it can be observed from the inspection ofFig. 19c, the peaks of the frequency content of the elastic response spectra fell exactly within the range of identified
natural frequencies. This affected the vibration modes of the struc-ture, resulting in a drop of the modal frequencies as well as a change of the frequency-temperature correlation after the occurrence of the seismic event (Table 7). However, the estimated frequency shift did not exceed the confidence limits established around each predicted value, meaning that only minor damage took place during the earthquake.
The temporal variation of the natural frequencies with respect to environmental and loading conditions is illustrated inFigs. 20 and 21. Given the low levels of ambient excitation and wind speed (cfr. Section6.1), the variation of the modal frequencies is clearly imputable to the temperature effects and, to a certain extent, the humidity.Fig. 20shows the evolution of the natural frequencies of the global modes with respect to the temperature together with the best trend lines and the coefficients of correlationrand deter-minationR2. It can be clearly observed that all investigated
fre-quencies show an almost linear increasing trend with rising temperature and vice versa. The lower modes exhibit a strong pos-itive correlation, beingrandR2equal to 0.83 and 0.69 for mode 1,
and equal to 0.86 and 0.74 for mode 3, respectively; whereas mode 4 is characterized by a frequency-temperature trend similar to mode 3 but less strong, as pointed out by the lower values ofr (0.74) and R2 (0.55). It is noted that the positive correlation
between modal frequencies and temperature is often observed in long-term studies of masonry structures [8–11] and can be Table 6
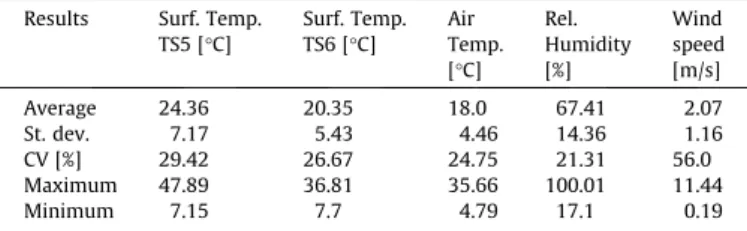
Statistics of ambient variables and global modal parameters monitored from 24/08/2005 to 28/04/2008.
Results Temp. [°C] RMS(y)[mg] Winda[m/s] Rel. Huma[%] f1[Hz] n1[%] f3[Hz] n3[%] f4[Hz] n4[%]
Average 19.79 0.013 2.15 65.25 3.74 2.51 6.36 0.89 7.29 1.04
St. dev. 5.39 0.004 1.23 14.51 0.08 0.57 0.11 0.31 0.08 0.41
CV [%] 27.26 26.95 57.34 22.24 2.20 22.67 1.74 34.38 1.11 39.45
Minimum 7.66 0.009 0.19 24.03 3.60 0.74 6.21 0.44 7.09 0.29
Maximum 35.13 0.068 7.57 98.60 3.94 4.32 6.78 3.48 7.53 3.14
aThe statistics refer to the period from 23/04/2007 to 28/04/2008.
(a)
(b)
(c)
0.0 0.5 1.0 1.5 2.0Aug-05 Oct-05 Nov-05 Jan-06 Mar-06 May-06 Jul-06 Sep-06 Nov-06 Jan-07 Mar-07 May-07 Jul-07 Sep-07 Nov-07 Jan-08 Mar-08 May-08
RMS [mg]
Date
Loading excitation over Time
RMS3 (z) RMS2 (y) RMS1 (x) earthquake -0.012 -0.008 -0.004 0 0.004 0.008 0.012 Acceleration [g] Time [s]
Response at the Vault Extrados (A2)
y (trans.) z (vert.) x (long.) 0 0.01 0.02 0.03 0.04 0.05
0 25 50 75 100 125 150
0 5 10 15 20 25 30 35 40 45 50
Sa [g]
Frequency [Hz]
Elastic Response Spectra (ξ = 5%)
y (trans.) z (vert.) x (long.)
Fig. 19.Ambient noise during the monitoring period: (a) root mean square of the acceleration channels as function of time; (b) response of the church during the seismic
event of 12/02/2007; and (c) corresponding elastic response spectra (n= 5).
Table 7
Frequency values before and after the seismic event of 12/02/2007.
Mode f[Hz] Df[%] Confidence Intervala[Hz] rTH-FRQ[%]
Before After Lower
Bound
Upper Bound
Before After
1st 3.77 3.73 0.96 3.59 3.95 0.87 0.84
3rd 6.40 6.34 0.95 6.15 6.66 0.93 0.79
4th 7.31 7.28 0.53 7.13 7.49 0.82 0.69
explained through the rise in stiffness induced by the thermal expansion of the materials with higher temperatures, lower mois-ture contents on the walls[7], and the consequent increase in fre-quency values. The plots relevant to modes 3 and 4 also highlight the considerable change in the frequency-temperature relation-ships triggered by the seismic event of February 2007. In order to analyse the possible influence of other environmental variables on the global modes of the church, the natural frequencies are plot-ted with respect to relative humidity, wind speed and ambient excitation (Fig. 21). The corresponding coefficients of correlation (r) are given inTable 8. The plots show that the identified modal frequencies are characterized by a moderate linear correlation with the relative humidity, reading values of r between 0.40% and 0.60%. As the relative humidity does increase, the frequencies do decrease. This behaviour can be ascribed to the absorption of moisture by the masonry walls, responsible in turn for the increase of mass and the consequent decrease of frequency values[7], given their inverse relationship. Finally, it is stressed that no trend is
found between modal frequencies and wind speed nor between modal frequencies and loading conditions (Fig. 21c and d).
6.3. Final remarks
The analysis of the monitoring data collected in the Church of Monastery of Jerónimos allows to conclude that the structural response of the system is controlled by the columns behaviour. The north column features rotation movements of greater ampli-tude with respect to the south column, but the displacements recorded hitherto do not compromise the bearing capacity of the church. In addition, it is noted that seasonal temperature and humidity variations significantly influence the structural response of the church, especially in terms of global modal behaviour. As far as wind and ambient noise are concerned, no impact on the static and dynamic response of the structure is found. Although the fre-quency shifts detected after the occurrence of the seismic event warned about the onset of possible endogenous phenomena linked
(b)
(c)
5 10 15 20 25 30 35
Temperature [°C]
5 10 15 20 25 30 35
Temperature [°C] 6.1 6.3 6.5 6.7 6.9 0 10 20 30 40 50
Aug-05 Oct-05 Nov-05 Jan-06 Mar-0
6
M
ay-06
Jul-06 Sep-06
Nov-06 Jan-07 Mar-07 May
-0
7
Jul-07 Sep-07 Nov-07 Jan-08 Mar-0
8 M ay-08 Frequency [Hz] Temperature [°C]
Date
Temperture Effect on the Third Mode
Temperature FRQ3
R² = 0.7377 5.9 6.1 6.3 6.5 6.7 6.9 Freq uency [Hz]
Mode 3
r= 0.86
7.0 7.2 7.4 7.6 7.8 0 10 20 30 40 50
Aug-05 Oct-05 Nov-05 Jan-06 Mar
-0 6 M ay-06 Jul-06 Sep-06 Nov-06 Jan-07 Mar
-0 7 May -0 7 Jul-07 Sep-07 Nov-07 Jan-08 Mar
-0 8 May -0 8 Frequency [Hz] Temperature [°C]
Date
Temperture Effect on the Fourth Mode
Temperature FRQ4
R² = 0.5456 6.8 7.0 7.2 7.4 7.6 7.8 Freq uency [Hz]
Mode 4
r= 0.74
to structural damage, the comparison with the confidence intervals defined for each mode allowed to rule out this hypothesis. Nevertheless, more data are needed to accurately model and pre-dict the structural response of the church over time. Additional events are being collected for this purpose and the results will be presented in a future work.
7. Conclusions
The paper stresses the importance of a multidisciplinary approach for the structural analysis and the safety assessment of historical constructions. Anamnesis, diagnosis, therapy and control are the four key-steps to put into practice in order to guarantee a correctmodus operandifor the preservation of architectural her-itage. Appropriate tools for continuous structural health monitor-ing and advanced numerical modellmonitor-ing are indispensable to effectively analyse the structural behaviour of such non-conventional masonry systems and to identify possible anomalies and vulnerabilities which may compromise the structural perfor-mance over time. This has been demonstrated through the case study of the Church of Monastery of Jerónimos, in Lisbon. After an extensive experimental campaign carried out to characterize the geometrical and mechanical features of the church, a simplified FE model has been adopted for safety assessment purposes under conditions of gravity loading. The structural behaviour of the most critical part of the system has been analysed with focus on the bearing capacity of both north and south columns of the nave at different levels. This has allowed to understand how and to which
extent the non-linear response of the supports affects the global behaviour of the structure. The finite element method has been used as a complementary analysis tool in combination with struc-tural monitoring techniques for a complete evaluation of the state of preservation of the monument. The static and dynamic beha-viours of the church have been thoroughly investigated along with the system’s environmental variability. From the analyses carried out it is concluded that: (a) the temperature variation has a non-negligible influence on the structural response of the church from both static and dynamic points of view and it is worth monitoring together with the relative humidity; (b) although the slenderness of the columns, the safety level of the church under conditions of vertical loads is good; (c) no urgent need for the adoption of speci-fic remedial measures is found. It is worth mentioning that the information obtained from the continuous monitoring will be used to further validate the numerical model, especially in regard to the simulation of the effect of the environmental parameters.
References
[1]L.F. Ramos, Damage identification on masonry structures based on vibration signatures (Ph.D. thesis), University of Minho, Guimarães, Portugal, 2007. [2]P.B. Lourenço, Recommendations for restoration of ancient buildings and the
survival of a masonry chimney, Constr. Build. Mater. 20 (2006) 239–251. [3]ICOMOS, Recommendations for the analysis, conservation and structural
restoration of architectural heritage, 2001.
[4]G. Croci, The Conservation and Structural Restoration of Architectural Heritage, Computational Mechanics Publications, Southampton, 1998.
[5]B. Peeters, G. De Roeck, One-year monitoring of the Z24-Bridge: environmental effects versus damage events, Earthquake Eng. Struct. Dyn. 30 (2) (2001) 149– 171.
[6]H. Sohn, Effects of environmental and operational variability on structural health monitoring, Philos. Trans. R. Soc. A 365 (1851) (2007) 539–560. [7]L.F. Ramos, L. Marques, P.B. Lourenço, G. De Roeck, A. Campos-Costa, J.C.A.
Roque, Monitoring historical masonry structures with operational modal analysis: two case studies, Mech. Syst. Signal Process. 24 (2010) 1291–1305. [8]R. Cantieni, One-year monitoring of a historic bell tower, in: Proceedings of the
9th International Conference on Structural Dynamics, EURODYN 2014, 2014, pp. 1493–1500 (Porto, Portugal).
[9]A. Saisi, C. Gentile, M. Guidobaldi, Post-earthquake continuous dynamic monitoring of the Gabbia Tower in Mantua, Italy, Constr. Build. Mater. 81 (2015) 101–112.
Table 8
Correlation between estimated modal frequencies and monitored environmental parameters.
Correlation [%] Environmental parameters
Temp. Rel. Hum. Wind RMS
1st Freq. 0.83 0.56 0.06 0.14
3rd Freq. 0.86 0.41 0.07 0.04
4th Freq. 0.74 0.42 0.09 0.09
(b)
(a)
(d)
(c)
3.2 4.2 5.2 6.2 7.2 8.25 10 15 20 25 30 35 40 45
Frequency [Hz]
Temperature [°C]
Frequency versus Temperature
1st mode 3rd mode 4th mode 3.2 4.2 5.2 6.2 7.2 8.2
0 20 40 60 80 100
Frequency [Hz]
Relative Humidity [%]
Frequency versus Humidity
1st mode 3rd mode 4th mode 3.2 4.2 5.2 6.2 7.2 8.2
0.0 2.0 4.0 6.0 8.0 10.0
Frequency [Hz]
Wind speed [m/s]
Frequency versus Wind
1st mode 3rd mode 4th mode 3.2 4.2 5.2 6.2 7.2 8.2
0.005 0.010 0.015 0.020 0.025 0.030 0.035
Frequency [Hz]
RMS [mg]
Frequency versus Ambient Noise
1st mode 3rd mode 4th mode

![Fig. 3. In situ testing [15]: (a) topographic and photogrammetric survey of nave vault; and (b) out of plumbness of columns and sidewalls.](https://thumb-eu.123doks.com/thumbv2/123dok_br/16991021.763669/4.892.210.673.104.343/testing-topographic-photogrammetric-survey-vault-plumbness-columns-sidewalls.webp)
![Fig. 5. Experimental mode shapes [7]: (a) first mode shape at 3.7 Hz; and (b) second mode shape at 5.1 Hz.](https://thumb-eu.123doks.com/thumbv2/123dok_br/16991021.763669/5.892.224.691.102.387/fig-experimental-mode-shapes-mode-shape-second-shape.webp)

![Fig. 13. Dynamic monitoring system [7]: (a) sensors location; (b) accelerator A2 at the roof level; (c) battery of recorders and accelerator A1 at the base level.](https://thumb-eu.123doks.com/thumbv2/123dok_br/16991021.763669/11.892.216.686.636.1109/dynamic-monitoring-sensors-location-accelerator-battery-recorders-accelerator.webp)