788 Brazilian Journal of Physics, vol. 33, no. 4, December, 2003
Estimate of Control Voltage Tolerances
for a Photo-Electron Analyzer of Toroidal Design
C. Azimonte
(1,2), A. R. B. de Castro
(1,2), A. Tadich
(3), J. D. Riley
(3), and R. C. G. Leckey
(3)(1)Instituto de F´ısica, UNICAMP, Caixa Postal 6165, Campinas, SP, 13083-970, Brasil
(2)Laborat´orio Nacional de Luz S´ıncrotron, Caixa Postal 6192, Campinas, SP, 13084-971, Brasil
(3)Physics Department, La Trobe University, Melbourne, Australia
Received on 5 March, 2003
We have run electron optics simulations and determined the tolerance in the control voltages of all elements (re-tarding input lens, analyzer, accelerating exit lens) of the La Trobe University photoelectron analyzer, recently redesigned to reach a spectral resolution of 5000, and which will be installed at LNLS (Campinas Brasil) and BESSY II (Berlin, Germany).
1
Introduction
Photoelectron spectroscopy is an important analytical tech-nique based on the photo-electric effect. When an atom is illuminated with photons of sufficiently high frequency ω, a bound electron of energy Ebinding can be promoted to a
free-statekabove the ionization threshold, with kinetic en-ergy Efree=~2k2/2me=~ω- Ebinding. Since, for a given
ω, there are in general many different core and valence lev-els with Ebinding <~ω, one gets, from an energy analysis
of the emitted photo-electrons, important information about the core and valence level positions and the density of states. There is ample literature covering the principles, instrumen-tation and “classical” analytical applications of photoelec-tron spectroscopy [1].
Further applications ensue in solid state physics and ma-terials science. If, instead of a single atom, one considers a solid sample, then the exciting light might penetrate a few hundred atomic layers beneath the surface. The photoelec-trons from deep layers, however, may interact strongly with the host crystal, suffer inelastic scattering and lose most of their kinetic energy before reaching the solid/vacuum inter-face. Only electrons emitted close to the surface make it to the vacuum outside and to the electron analyzer without un-dergoing inelastic scattering. The probability of escape is a sensitive function of the photoelectron initial kinetic energy. In this way, it is possible to contrive experimental condi-tions such that only photoelectrons from the surface layer itself escape, which lends to the photoemission experiment a unique surface-sensitive character.
The surface is of great fundamental interest because a real crystal grows from a seed by accretion of atoms at the surface; crystallization is a surface phenomenon.
In addition, it is of enormous technological interest, be-cause the surface is the seat of all catalytic phenomena, on
which depend the chemical, pharmaceutical and petroleum industries.
Surface analysis is a very delicate business, because clean, well characterized surfaces are difficult to prepare and to keep for extended periods of time. Even in the highest quality vacuum possible with current technology (say, 10−11 mbar pressure with mainly H as residual gas) a clean surface becomes contaminated with adventicious residual atoms and molecules in a few hours. It is, therefore, mandatory to complete the photoelectron data gathering in a shorter time.
The photoelectron detection rate depends on many pa-rameters, including energy and angle resolution of the elec-tron energy analyzer, cross-section for photoemission of the particular chemical species under study, frequency intensity and polarization of the photon-source, etc, but it is usually much lower than desirable.
There is a constant striving to get more and more intense photon sources - the state of the art today is to use undulator radiation from a low emittance synchrotron source [2,3].
On the opposite end of the chain, parallel detection of photoelectrons in an extended angular and energy range is obviously a desirable and efficient way of gathering data.
C. Azimonteet al. 789
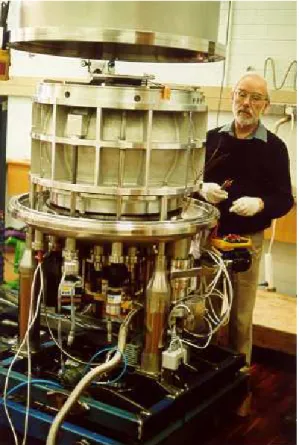
Figure 1 shows a photograph, and Fig. 2 a cross-section of the analyzer, which has cylindrical symmetry about the vertical axis. Electrodes 1 2 3 belong to an entrance retard-ing lens. They focus a beam of photo-emitted electrons cov-ering a zenithal angle interval∆Θ, coming from a sample placed on axis. This focusing is done independently and simultaneously for all azimuthal angles 0 < Φ < π of emission from the sample. The analyzer proper is a pair of concentric toroids kept at different electric potentials. An almost radial electric field exists in the region between the toroids, which deflects the electrons. The total deflection at the exit of the toroidal section is roughly proportional to the time-of-flight, i.e, to E−1/2
kinetic. An approximate
analyti-cal model of the fields in the toroidal section has been given by the La Trobe team [6]. An accelerating exit lens boosts the kinetic energy of the analyzer output (for more efficient generation of secondary electrons) and refocus it on a Mi-crochannel electron multiplier plate. The intensified elec-tron cloud then falls on a fluorescent screen. The visible light emitted by each pixel is read out by a CCD camera and gives the number of detected photoelectrons in a range
∆E of energy and∆Θ ∆Φof zenithal and azimuthal an-gles. This image, with about 4 106pixels 20x20µm2each, is stored on disk for further off-line analysis.
Figure 1. Photograph of the La Trobe photoelectron toroidal analyser.
Figure 2. Cross-section of the La Trobe photelectron toroidal analyser.
2
Methods
The effects of fluctuations (noise) on the electrical voltages of the eleven control electrodes are vastly different, depend-ing on function and position of the electrode.
The cost of a power supply increases steeply as one tries to reduce the noise. It is, therefore, of critical interest to de-termine the largest tolerance the power supplies might admit for a (small) given loss in the optimum ideal performance. We took as ideal starting point the spectral resolving power of 5000, limited by aberrations in the electron optics, and the voltages prescribed by Tadich, Riley and Leckey [7], mak-ing an allowance of 20 % increase or displacement in the focal spot. We then found the permissible tolerance for the voltage of each electrode under a variety of conditions.
The electron spot size and position in the detector plane were studied with the commercial program SimIon [8]. This program, initialy developed at La Trobe University, then sold to a private US company, calculates the potential V(r) in the vacuum region between the electrodes using the po-tentials given at the electrodes as boundary conditions. The solution to the Laplace equation is found using a relaxation technique, with various enhancements to speed up the con-vergence of the method. Once the electric field -∇V(r) is obtained, the equation of motion for each photoelectron with given initial conditions is numerically solved and the trajec-tory tracked till the electron strikes the MCP detector. In order to reach acceptable accuracy, very small time incre-ments have to be specified in the numerical solution of the equation of motion, which leads to many weeks spent on these simulations.
3
Results
790 Brazilian Journal of Physics, vol. 33, no. 4, December, 2003
voltages constant and observing the changes in resolution for changes in that electrode’s voltage.
Figure 3 shows the effect of voltage changes in V1. This
is the first element of the retarding entrance lens and has the function of retarding the incoming electron to the ki-netic energy of the central orbit in the toroidal analyzer, which is the pass energy of the analyzer. If the pass en-ergy is kept fixed and the electron kinetic enen-ergy is varied, we expect the radius of curvature of the trajectory to change (increasing for larger energies, being reduced for lower en-ergies) and the edges of the focal spot to move radially on the MCP detector, in a fashion approximatelly linear with changes in the kinetic energy. This is clearly seen in the figure, from which one can also extract a linear deviation coefficient dr/dV1 ≈-42 mm/V. Then one finds the
volt-age tolerance∆V1by requiring that∆r be at most 20% of
the optimum spot size.
-0.006 -0.004 -0.002 0.000 0.002 0.004 0.006 37.0 37.1 37.2 37.3 37.4 37.5 37.6
changing the voltage V1 ( K=5.1eV; Ep=5eV)
R (m m ) V1 (V) Y upper Y lower Y average
Figure 3. Dependence of the position of the focal spot on the volt-age applied to electrode V1. “Upper” and “Lower” refer to the
radial edges of the electron focal spot, while “Average” refers to the estimated radial position of the centroid.
Figure 4 shows the effect of voltage changes in V2. This
is the “focusing” element of the retarding entrance lens. As the voltage departs from the optimum value, the spot in-creases in size, without significant radial motion of its cen-troid, as expected. Here, again, the voltage tolerance is cho-sen to be that∆V2which increases the spot size by 20%.
-26.6 -26.4 -26.2 -26.0 -25.8 -25.6 -25.4 -25.2 37.27 37.28 37.29 37.30 37.31 37.32 37.33 37.34 37.35 37.36 37.37 37.38 37.39 37.40
changing the voltage V2 ( K=5.1eV; Ep=5eV)
R ( m m ) V2 (V) Y upper Y lower Y average
Figure 4. Dependence of the focal spot size on the voltage applied to electrode V2. “Upper” and “Lower” refer to the radial edges
of the electron focal spot, while “Average” refers to the estimated radial position of the centroid.
Figure 5 shows the tolerance on voltage V1as a function
of incoming photoelectron energy, for various pass energies.
It is interesting to observe that the tolerance is substantially smaller than the na¨ıve estimate of∆V1/V1 ≈ ∆E/E≈
1/5000.
10 100 1000
1E-4 1E-3 0.01
Maximum tolerance allowed to V1
to
le
ra
nc
e on vol
tage V
1
(
V
)
Photoelectron energy (eV)
Ep=5eV Ep=10eV Ep=20eV Ep=50eV Ep=100eV
Figure 5. Tolerance on the voltage applied to electrode V1in order
to have a loss in spectral resolution not exceeding 20%, as a func-tion of incoming electron kinetic energy, for various pass energies. This is a retarding electrode.
The value of the focusing element V2voltage is not
crit-ical, requiring a power supply with a precision of only a few percent.
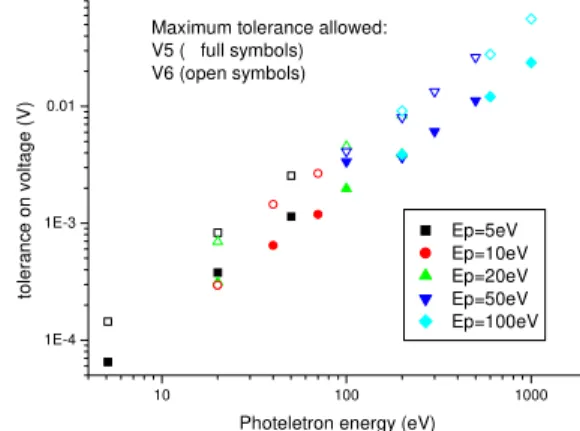
V5and V6are the analyzer toroids. For low kinetic
en-ergy, the required precision is high, being about 8 10−5V
6,
again much tighter than the na¨ıve 1/5000. This is shown on Figure 7.
The focusing electrode V8 in the exit lens is also very
undemanding, a precision of a few percent is satisfactory, as shown in Figure 6 (open symbols).
The electrode V9needs a precision of roughly 1 part in
1000 in the worst case, see Figure 6 (full symbols).
10 100 1000
0.1 1 10
Maximum tolerance allowed: V9 (full symbols) V8 (open symbols)
to le rance o n v o lt age s (V)
Photeletron energy (eV)
Ep=5eV Ep=10eV Ep=20eV Ep=50eV Ep=100eV
Figure 6. Open symbols: tolerance on the voltage applied to elec-trode V8in order to have a loss in spectral resolution not exceeding
20%, as a function of incoming electron kinetic energy, for various pass energies. Full symbols: tolerance on the voltage applied to electrode V9. These are focussing electrodes in the exit lens.
Finally, voltage fluctuations on the equipotential elec-trodes V10 and V11 (the last one is the MCD detector
sur-face) have very small effects.
C. Azimonteet al. 791
to speed up the data transfer between CCD camera and the control computer, and to reduce the volume of data stored and treated.
10 100 1000
1E-4 1E-3 0.01
Maximum tolerance allowed: V5 ( full symbols) V6 (open symbols)
to
ler
a
n
c
e
on
v
o
lt
ag
e (
V
)
Photeletron energy (eV) Ep=5eV Ep=10eV Ep=20eV Ep=50eV Ep=100eV
Figure 7. Tolerance on the voltage applied to electrode V5 (full
symbols) and electrode V6 (open symbols) in order to have a loss in spectral resolution not exceeding 20%, as a function of incom-ing electron kinetic energy, for various pass energies. These are the toroidal energy-dispersive electrodes.
4
Conclusions
We have run computer simulations of the electron trajecto-ries in a complex photoelectron analyzer of toroidal geom-etry with input and output lenses, in order to establish tol-erances for the control voltages of the electrodes. We find
that, contrary to na¨ıve expectation, the precision required on the energy selecting electrodes is much finer than∆E/E≈
1/5000, the maximum spectral resolution allowed by aberra-tions of the electron optics, which is roughly consistent with the spatial resolution dictated by MCD size, and the CCD camera number (4 106)and size of pixels.
References
[1] Electron spectroscopy: Theory, Techniques and Applications, ed. C R Brundle and A D Baker, Academic Press, New York (1977).
[2] See the web pages of institutions such as BESSY II in Berlin, Germany (www.bessy.de) and Sincrotrone Trieste, Trieste, Italia (www.elettra.trieste.it), for instance.
[3] A. R. B. de Castro, Physicae2, 31 (2001).
[4] D. Roy and D. Tremblay, Rep. Prog. Phys.53, 1621 (1990). [5] R. C. G. Leckey, J. D. Riley, and A. Stampfl, Journal of Electr
Spectr and Rel Phenom,52, 855 (1990).
[6] F. Toffoletto, R. C. G. Leckey, and J. D. Riley, Nucl Instrum and Meth in Phys Res, B12, 282 (1985).
[7] “The La Trobe 2000 Energy analyser: a brief overview of op-erational considerations”, A. Tadich, J. D. Riley, and R. C. G. Leckey, La Trobe Univ Internal Report (2000).