Article
J. Braz. Chem. Soc., Vol. 22, No. 2, 204-210, 2011. Printed in Brazil - ©2011 Sociedade Brasileira de Química 0103 - 5053 $6.00+0.00
A
*e-mail: [email protected]
Characterization of Poly(Safranine T)-Modiied Electrode and Application for
Simultaneous Determination of Epinephrine and Uric Acid Coexisting with
Ascorbic Acid
Lingmei Niu,*Kaoqi Lian, Weijun Kang and Shan Li
School of Public Health, Hebei Medical University, Shijiazhuang, 050017 P. R. China
Um eletrodo de carbono vítreo modiicado com poli(safranina T) foi utilizado para a determinação simultânea de epinefrina (EP) e ácido úrico (AU) na presença de ácido ascórbico (AA). Correntes eletrocatalíticas aumentadas e potenciais bem separados para EP e AU foram observados. As correntes de pico anódico de EP e AU foram lineares em função das concentrações correspondentes, na faixa de 6,0×10⁻⁶-1,0×10⁻⁴ mol L-1. Além disso, o eletrodo modiicado mostrou
boa sensitividade e estabilidade. Resultados satisfatórios foram alcançados para a determinação de EP e AU em soluções de injeção de EP bem como em amostras de urina humana.
A poly(safranine T) modified glassy carbon electrode was used for the simultaneous determination of epinephrine (EP) and uric acid (UA) in the presence of ascorbic acid (AA). Enhanced electrocatalytic currents and well-separated potentials for EP and UA were observed. The anodic peak currents of EP and UA were linear to the corresponding concentrations in the range of 6.0×10⁻⁶-1.0×10⁻⁴ mol L-1. In addition, the modiied electrode showed good sensitivity
and stability. Satisfactory results were achieved for the determination of EP and UA in injection solutions of EP and in human urine samples.
Keywords: safranine T, glassy carbon electrode, epinephrine, uric acid, ascorbic acid
Introduction
Uric acid (2,6,8-trihydroxypurine, UA) is the primary
end product of purine metabolism.1 The normal UA level in
serum ranges from 2.4×10⁻⁴-5.2×10⁻⁴ mol L-1, and in urinary
excretion, the level is typically 1.4×10⁻³-4.4×10⁻³ mol L-1.2
Disorders of purine biosynthesis or purine catabolism, such as gout, hyperuricemia, and Lesch-Nyhan syndrome, are generally caused by an abnormal concentration of UA
dissolved in human urine or blood.3 Thus, monitoring the
concentration of UA in biological luids may be used as
an early warning to the occurrence of these diseases.4 In
general, electroactive UA can be irreversibly oxidized in
aqueous solution, where the major product is allantoin.5
Epinephrine (EP), also called adrenaline, is an important catecholamine neurotransmitter in the mammalian central nervous system. It plays an important role in the function of the central nervous, renal, hormonal, and cardiovascular
systems.6 Changes in its concentration may result in many
diseases.7 In addition, EP is the common drug of choice
as vasoconstrictor, cardiac stimulator and bronchodilator.8
Thus, developing a quantitative method for studying EP will signiicantly help in understanding its effects on the nervous system and any artiicial substitutes. The method will be of great signiicance to pharmacological research and life sciences as well.
Generally, UA and EP coexist in human biological luids. UA is oxidized at a potential close to that of EP at most solid electrodes, resulting in an overlapping voltammetric response. Hence, the simultaneous detection of UA and EP in a mixture is interesting to biological and chemical researchers. Individual determination of UA and
EP have been widely reported,2,8-15 whereas simultaneous
determination is seldom studied.7,16,17 Ascorbic acid (AA)
also coexists with UA and EP in human luids, and the potentials usually overlap. Therefore, the simultaneous determination of UA and EP coexisting with AA is a serious
challenge to researchers.18-21
microelectronic devices.22 Among these compounds,
polyazines have been widely used as redox indicators
and mediators in recent years.23 However, focus has
been devoted to the redox kinetics and charge transport of polyazine ilms,24 and sensor applications are rarely
reported. To our knowledge, there is no known data on the improvement of peak separation during the simultaneous determination of EP and UA in the presence of AA using polyazine-modified electrode. Thus, the compound safranine T (SFR), which is an electroactive polyaromatic
cation,25 is used to modify a glassy carbon electrode
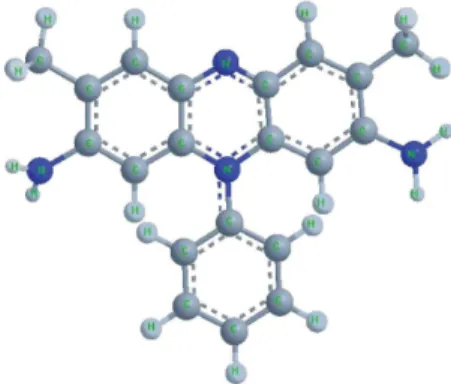
(GCE) in this study. In relation to this, the purpose of this paper is to investigate the electrochemically polymerized SFR modiied electrode for the oxidation of EP and UA under the coexistence of AA.
The structure of SFR is shown in Figure 1.
Experimental
Materials
Both safranine T and ascorbic acid were obtained from Shanghai Chemical Reagent Co., Ltd. Uric acid was purchased from Fluka (Buchs, Switzerland). Epinephrine was from Sigma Aldrich (Steinheim, Germany). They were used without further purification. Epinephrine hydrochloride injection solution was purchased from Guangzhou Mingxing Phramaceutical Co., Ltd. All other reagents were of analytical-reagent grade. Doubly distilled water was used throughout the experiments. The temperature of the experiments was set at room temperature (ca. 25 °C).
Apparatus
Electrochemical measurements were done on an electrochemical analyzer (model AD300, China). The three-electrode system used in the measurements was
comprised of a GCE (d = 3 mm, model P314771) or polySFR-modiied electrode as the working electrode, Pt as the counter electrode (model P314776), and Ag/AgCl (KCl-saturated) electrode (model P314794) as the reference electrode. Potentials are given with respect to the Ag/AgCl (KCl-saturated) electrode.
Preparation of polySFR modiied electrode
Prior to each experiment, the GCE was polished to a
mirror inish with 0.05 µm alumina in a water slurry. After
polishing, the electrode was rinsed and ultrasonicated with 1:1 (v/v) nitric acid (HNO3) solution, acetone, and doubly distilled water for 5 min, successively, to remove any adsorbed substance on the surface. Then, it was dried under nitrogen low.
The bare GCE was then immersed in 2.0×10⁻³ mol L-1
SFR solution containing 0.1 mol L-1 sulfuric acid (H
2SO4).
The polySFR-modiied electrode was prepared by potential-sweep electrolysis at a potential scan rate of 50 mV s-1
in the potential range of –0.5 to 1.8 V vs. Ag/AgCl
(KCl-saturated) electrode for 10 cycles. The electrode was washed with distilled water and stored in phosphate buffer solution (PB) at pH 7.0.
Result and Discussion
Electropolymerisation of SFR
The SFR polymerization in PB of different pH (pH 2.0 to 7.0) and different electrolytes sulfuric, nitric and
hydrochloric acid (H2SO4, HNO3, HCl) was investigated.
At higher pH, SFR cannot form a stable polymer; that is the
same to what was obtained in reference.24 H
2SO4 was chosen
as the acid electrolyte because the polymerization showed a better response in this solution. The reason is that the
addition of H2SO4 can facilitate ilm formation. Secondly,
potential-sweep electrolysis is more effective in preparing
the smooth ilm than constant potential electrolysis.26 The
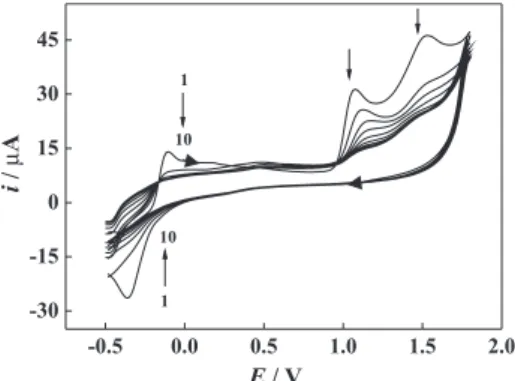
electrode modiied in this manner showed a blue-purple, fairly even ilm. In Figure 2, a pair of redox peaks appear at about –0.25 V in the irst cycle, probably because of a
reversible reduction/reoxidation of the monomer.22 Two
other anodic waves are formed at 1.1 and 1.5 V, probably because the dimers formed react with other monomer or
dimers.24 The two anodic waves decrease continuously
with potential cycling because of the absence of the
corresponding cathodic waves.22 As presented in reports,27
the growth mechanism for polySFR may be similar to that of polyaniline synthesized via head-to-tail bonding from acidic solutions. Safranine T is polymerized via
cation-radical formation at the primary amino group and its
linkage to one of the carbon atoms of the aromatic rings.22
The possible scheme was provided in the reference 24. In other words, in order to achieve the polySFR ilm, one must sweep the electrode potential over a value that oxidizes
the NH2 groups of SFR. This accounts for the absence of
substantial ilm formation if the potential sweep is limited to the range of –0.3 to 1.0 V.
Effect of cycle number on polySFR formation
The effect of cycle number on the surface coverage of
SFR was demonstrated in a pure 0.1 mol L-1 H
2SO4 solution.
In Figure 3, a pair of redox waves gradually increases near the –0.2 V results from the growth of a polySFR ilm.
The redox potential in H2SO4 is close to that of the SFR
monomer in solution. This indicates that the SFR retained
monomer-type redox activity after polymerization.22 The
improved electronic conductivity of the polymer resulting from the larger cycle number is attributed to an increase
in redox peak currents in H2SO4 solution. However, when
the cycle number is above 120, the polymer on the surface desquamates. The surface coverage of SFR was estimated from cyclic voltammetry (CV) using the following equation:28
Γ = Q/(nFA) (1)
where Q is the charge in coulombs, n is the number of electrons involved in the process, n = 2,22 F is the
Faraday constant, and A is the geometric area of the working electrode. The surface coverage of the polymer also develops with increasing cycle number (Figure 4). The slope of the linear region gives a growth rate of 2.9×10⁻¹¹ mol cm-2per cycle.
On the other hand, for polySFR produced at 20 cycles, the anodic peak current increases almost linearly with the
square root of the scan rate up to 200 mV s-1. This indicates
that the redox process is controlled by the diffusion-like electron transport in the polymer. When the cycle number is extended to 100, the relationship between the peak current and scan rate is maintained. Thus, the increased cycle number does not change the redox mechanism of the polymer, and the surface process is always controlled by the diffusion of electrons. From above, the obtained result is different from that for phenosafranine presented in literature.22
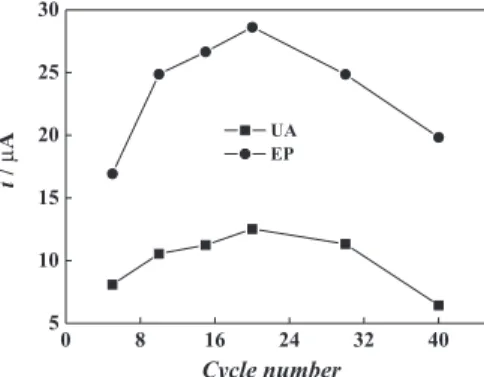
However, the developing response of EP and UA cannot be obtained at the polySFR electrode at increasing cycle numbers. In Figure 5, the peak currents of EP and UA from the polySFR electrode during the oxidation process have a maximum at 20 cycles. It then decreases with an increase in cycle number. The thick layer blocks the electron transfer during the EP or UA oxidation in the ilm. For this reason, a cycle number of 20 was selected for use in further experiments.
Simultaneous determination of EP and UA and the effect of solution pH
Differential pulse voltammograms (DPV) of EP and UA under the potential windows of 0.0-0.7 V using the bare electrode (Figure 6c) and the polySFR-modiied electrode
Figure 2. Consecutive CVs recorded during electropolymerization. Electrolyte: 2.0×10⁻³ mol L-1 safranine T solution in 0.1 mol L-1 H
2SO4;
scan rate: 50 mV s-1.
Figure 3. CVs in a pure 0.1 mol L-1 H
2SO4 solution after polySFR was
formed at different cycles.
(Figure 6a) were obtained in PB at pH 5.4. Curve b is the DPV of the modiied electrode in blank PB. In Figure 6, the unmodiied GC electrode cannot separate the EP and UA oxidation peaks. No obvious anodic oxidation peaks are formed at the bare GC electrode (curve c). In curve a, the anodic peak potentials representing EP and UA oxidations are 0.28 and 0.45 V, respectively, for the modiied electrode. EP and UA can be monitored separately, and the peak currents can increase remarkably compared with the bare electrode. When individual species, such as EP or UA, are taken into account, oxidation also takes place with an increase in peak current compared with the bare GC electrode. The individual oxidation potential of EP or UA is the same as that of mixture. The results represent the favorable effect of the polySFR ilm. It shows that it can be used to observe the kinetics of the electron transfer of EP and UA on the surface of the modiied electrode. When the polySFR-modiied electrode is immersed in a solution
containing EP and UA for 5 s and then kept in 0.1 mol L-1
PB for cyclic scanning, oxidation currents due to EP and UA are not observed. This shows that EP and UA were not adsorbed on the modiied electrode, which has been proven by the relationship between the anodic peak currents of EP
and UA, and the scan rates. The plot of the anodic peak current (ipa) against the square root of the scan rate (v1/2) is
linear for EP and UA at the SFR ilm-modiied electrode, indicating that the oxidation of EP and UA is controlled by diffusion.29
The enhanced signals of EP and UA can be understood through the following mechanism. PolySFR, the structure of which is similar to the poly(phenosafranine), is a kind
of cationic polymer.23 Dougherty demonstrated that the
cation-π interaction can cause synthetic hosts to develop
novel binding selectivity and high afinities for highly
water-soluble guests.30 Therefore, soluble species, such
as EP and UA, can accumulate on the polySFR ilm by molecular interaction. This pertains to hydrogen bonding with the proton donating group of polySFR. Consequently, this favorable condition increases oxidation current sensitivity.
To verify the practicality of polySFR-modiied electrode for the simultaneous determination of EP and UA, mixtures of these species were investigated. Figure 7 is the DPV graph of different concentrations of EP and UA. According to the experimental results, the concentrations are linearly related to the corresponding peak currents in the range of 6.0×10⁻⁶-1.0×10⁻⁴ mol L-1, with detection limits of
2.0×10⁻⁷ mol L-1 for EP and 4.3×10⁻⁶ mol L-1 for UA. The
linear equation is ip = 0.3873 + 0.4130 C (r = 0.9975) for EP and ip = 0.0519 + 0.2014 C (r = 0.9981) for UA, respectively. Based on the results, EP and UA have no interaction with each other and can be determined simultaneously using the modiied electrode.
The influence of solution pH on the simultaneous response of EP and UA at the modiied electrode was investigated using CV. The effect of pH on the oxidation peak currents is shown in Figure 8. Both the plots of EP
Figure 5. Effect of cycle number on the response of EP and UA oxidation.
CEP: 3.0×10⁻⁴ mol L-1; C UA: 3.0×10
-4 mol L-1.
Figure 6. DPVs recorded using the polySFR-modiied electrode (a, b) and bare GC electrode (c) in the presence of a mixture containing 1.0×10⁻⁴ mol L-1 EP and 1.0×10⁻⁴ mol L-1 UA (a, c); and absence of the
mixture (b). Phosphate buffer: pH 5.4; scan rate: 50 mV s-1.
Figure 7. DPVs of EP and UA at different concentrations. Concentrations of EP (10-5 mol L-1): (1) 0.6, (2) 0.8, (3) 1.0, (4) 2.0, (5) 3.0, (6) 4.0,
(7) 5.0, (8) 6.0, (9) 7.0, (10) 8.0, (11) 9.0, (12) 10; concentrations of UA (10-5 mol L-1): (1) 0.6, (2) 0.8, (3) 1.0, (4) 2.0, (5) 3.0, (6) 4.0, (7) 5.0,
and UA increase with pH enhancement and reach their maximum at pH 7.0 and 4.4, respectively, before decreasing signiicantly. The probable reason is the protonation of
EP (pKa = 8.88) and UA (pKa1 = 5.40)17 when the pH is
below 8.88 for EP and 5.40 for UA. Another reason is the maximum interaction between the polySFR ilm and both EP and UA when pH rises to 7.0 and 4.4. To obtain a good response signal from both EP and UA, pH 5.4 was selected as the condition for measurement.
DPV of EP and UA in the presence of AA
AA exists in human fluids. Thus, simultaneous determination of EP and UA in the presence of AA is important. Figure 9 shows the DPV curves of 1.3×10⁻⁴ mol L-1 EP and 9.0×10⁻⁵ mol L-1 UA solutions
containing 1.0×10⁻³ mol L-1 AA using the bare (dashed line)
and polySFR ilm-modiied electrodes (solid line). A broad oxidation peak is present when the bare GCE is used, and the peak potentials of EP, UA, and AA are indistinguishable. In contrast, the polySFR ilm on the GCE resolves the mixed
voltammetric response into three well-deined voltammetric peaks at 0.0, 0.3 and 0.4 V, corresponding to the oxidations of AA, EP, and UA, respectively. A substantial increase in peak current is also observed. This indicates the suitability of the modiied electrode for the determination of EP and UA in the presence of AA.
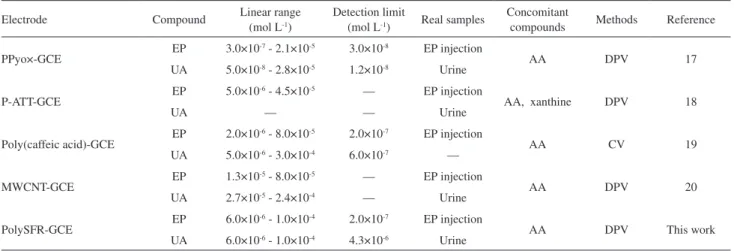
Table 1 shows a comparison for the determination of EP and UA at polySFR modiied electrode with various polymer electrodes. The comparison shows that the suggested electrode can be used for the determination of EP and UA in biological luids and pharmaceutical products over a wide range of concentrations with low detection limits.
Stability of the polySFR-modiied electrode
In order to evaluate the stability of the modified electrode, a series of repetitive measurements were carried
out in solutions containing 1.0×10⁻⁵ mol L-1 EP and UA.
The peak current variations are 4 and 3% for an average
Figure 8. Effect of pH on the oxidation of EP and UA using polySFR-modified electrode measured by cyclic voltammetry.
CEP: 1.0×10⁻⁴ mol L-1; C UA: 1.0×10
-3 mol L-1.
Table 1. Comparison of different modiied GC electrode for the determination of EP and UA with polySFR modiied electrode
Electrode Compound Linear range (mol L-1)
Detection limit
(mol L-1) Real samples
Concomitant
compounds Methods Reference
PPyo×-GCE EP 3.0×10
-7 - 2.1×10⁻⁵ 3.0×10⁻⁸ EP injection
AA DPV 17
UA 5.0×10⁻⁸ - 2.8×10⁻⁵ 1.2×10⁻⁸ Urine
P-ATT-GCE EP 5.0×10
-6 - 4.5×10⁻⁵ — EP injection
AA, xanthine DPV 18
UA — — Urine
Poly(caffeic acid)-GCE EP 2.0×10
-6 - 8.0×10⁻⁵ 2.0×10⁻⁷ EP injection
AA CV 19
UA 5.0×10⁻⁶ - 3.0×10⁻⁴ 6.0×10⁻⁷ —
MWCNT-GCE EP 1.3×10
-5 - 8.0×10⁻⁵ — EP injection
AA DPV 20
UA 2.7×10⁻⁵ - 2.4×10⁻⁴ — Urine
PolySFR-GCE EP 6.0×10
-6 - 1.0×10⁻⁴ 2.0×10⁻⁷ EP injection
AA DPV This work
UA 6.0×10⁻⁶ - 1.0×10⁻⁴ 4.3×10⁻⁶ Urine
Figure 9. DPVs of the mixture containing (a) AA (1.0×10⁻³ mol L-1),
(b) EP (1.3×10⁻⁴ mol L-1), and (c) UA (9.0×10⁻⁵ mol L-1) at the
of 30 determinations of EP and UA, respectively. This indicates that the modiied electrode has an excellent ability to prevent fouling due to the oxidation products. No
apparent decrease is observed after storing in 0.1 mol L-1
PB (pH 7.0) at 4 °C for 30 days. This is conirmed by the retention of 87% current response to EP and UA.
Interference study
The influence of various foreign species on the
determination of 1.0×10⁻⁵ mol L-1 EP and UA was
investigated. The tolerance limit was taken as the maximum concentration of the foreign substances that can cause approximately ± 5% relative error in determination. The tolerated ratio of foreign substances is 100 for Na+, Cl–, K+,
Mg2+, and Ca2+; 50 for L-lysine, glucose, and L-asparagines;
30 for glutamic acid, glycine, L-cystine and L-cysteine; and 10 for acetaminophen and NADH.
Sample analysis
The epinephrine hydrochloride injection solution
(speciied content of EP is 1.00 mg mL-1) was diluted
to 2.0×10⁻⁵ mol L-1 with distilled water. The diluted EP
injection solutions and standard EP, UA and AA solutions were added to a series of 10 mL measuring flasks and diluted to the mark with 0.1 mol L-1 PB (pH 5.4).
Differential pulse voltammograms were recorded, and the anodic peak currents were measured. The standard addition method was used to calculate the concentrations of EP, UA, and AA. The results are satisfactory (Table 2).
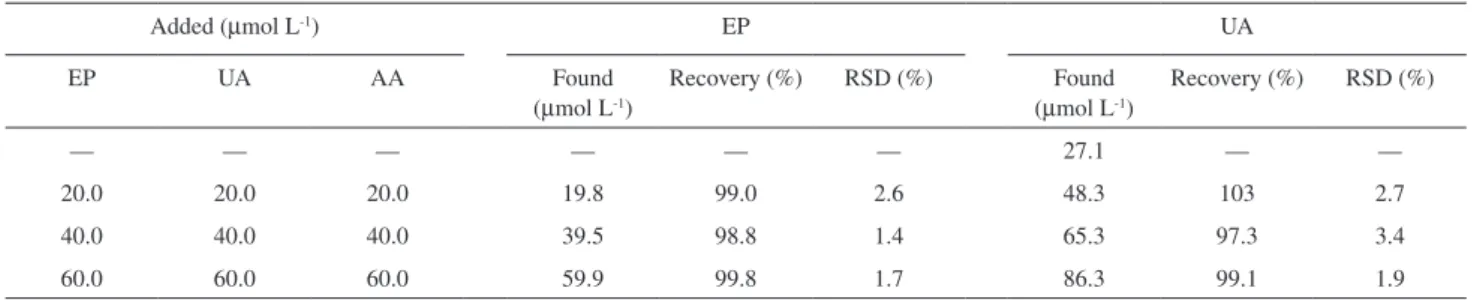
Human urine samples were also tested. Four samples were analyzed using the proposed method, and all the samples were diluted 100 times. The results are shown in Table 3. The total value of uric acid in urine samples is
2.71×10⁻³ mol L-1. This was obtained by multiplying the
detected value with the dilution factor.
Conclusions
PolySFR was used to modify a GCE, and the polymeric conditions were investigated. The polySFR-modified electrode not only separated the voltammetric peaks of EP, UA, and AA well but also showed that these species had a good electrocatalytic activity. The anodic peak currents of EP and UA were linear to the corresponding concentrations. Satisfactory results were also obtained in the analysis of real samples using the polySFR-modiied electrode.
Acknowledgments
The project was supported by the Natural Science Foundation of Hebei Province (No. C2007000813).
References
1. Thiagarajan, S.; Chen, S. M.; Talanta 2007, 74, 212. 2. Behera, S.; Raj, R.; Biosens.Bioelectron. 2007, 23, 556. 3. Liu, A. H.; Honma, I.; Zhou, H. S.; Biosens. Bioelectron. 2007,
23, 74.
4. Wang, G. F.; Meng, J.; Fang, B.; Electrochim.Acta 2008, 53, 2837.
Table 2. Determination of EP and UA in mixtures (n = 5)
Added (µmol L-1) EP UA
EP AA UA Found
(µmol L-1)
Recovery (%) RSD (%) Found (µmol L-1)
Recovery (%) RSD (%)
— — — 19.4 97.0 3.2 — — —
20.0 20.0 20.0 39.7 99.2 1.6 19.7 98.5 1.5
40.0 40.0 20.0 60.1 100 1.8 20.3 102 2.3
60.0 60.0 40.0 78.8 98.5 2.2 40.9 102 1.6
Table 3. Determination of EP and UA in human urine samples (n = 5)
Added (µmol L-1) EP UA
EP UA AA Found
(µmol L-1)
Recovery (%) RSD (%) Found (µmol L-1)
Recovery (%) RSD (%)
— — — — — — 27.1 — —
20.0 20.0 20.0 19.8 99.0 2.6 48.3 103 2.7
40.0 40.0 40.0 39.5 98.8 1.4 65.3 97.3 3.4
5. Wang, P.; Li, Y. X.; Talanta 2007, 73, 431. 6. Li, Y.; Chen, S. M.; Anal.Biochem. 2009, 388, 288.
7. Bouhouti, H. E.; Naranjo-Rodriguez, I.; Talanta 2009, 79, 22. 8. Ly, S. Y.; Kim, M. H.; Microchem.J. 2006, 82, 113. 9. Zhou, M.; Guo, L. P.; Electrochim.Acta 2008, 53, 4176. 10. Zeng, Y. H.; Yang, J. Q.; Wu, K. B.; Electrochim.Acta 2008,
53, 4615.
11. Gong, J. M.; Lin, X. Q.; Electrochim.Acta 2004, 49, 4351. 12. Hason, S.; Vetterl, V.; Electrochim.Acta 2009, 54, 1864. 13. Miah, M. R.; Ohsaka, T.; Electrochim.Acta 2008, 54, 316. 14. Lu, L. P.; Lin, X. Q.; Electrochem.Commun. 2008, 10, 704. 15. Ndamanisha, C. J.; Guo, L. P.; Biosens.Bioelectron. 2008, 23,
1680.
16. Beitollahi, H.; Ardakani, M. M.; Biosens.Bioelectron. 2008,
24, 362.
17. Li, J.; Lin, X. Q.; Anal. Chim.Acta 2007, 596, 222. 18. Palraj, K.; John, S. A.; Anal. Chim. Acta 2009, 647, 97.
19. Ren, W.; Luo, H. Q.; Li, N. B.; Biosens. Bioelectron. 2006, 21, 1086.
20. Hamid, R. Z.; Navid, N.; Sens. Actuators, B 2010, 143, 666. 21. Nada, F. A.; Maher, F. E.; Ahmed, G.; Anal. Biochem. 2010,
400, 78.
22. Komura, T.; Ishihara, M.; J.Electroanal.Chem. 2000, 493, 84. 23. Selvaraju, T.; Ramaraj, R.; Electrochem.Commun. 2003, 5, 667. 24. Rasa, P.; Ausra, S.; Albertas, M.; Christopher, M. A. B.; Thin
Solid Films 2009, 517, 5435.
25. Herrero, R.; Guidelli, R.; J.Electroanal.Chem. 1997, 425, 87. 26. Ohsaka, T.; Tanaka, K.; J. Chem.Soc. Chem. 1993, 3, 222. 27. Zhou, D. M.; Sun, J. J.; Electrochim.Acta 1998, 43, 1803. 28. Li, N. B.; Kwak, J. Y.; Biosens. Bioelectron. 2008, 23, 1519. 29. Li, N. B.; Niu, L. M.; Luo, H. Q.; Microchim. Acta 2006, 153, 37. 30. Kearney, P. C.; Mizoue, L. S.; J. Am. Chem. Soc. 1993, 115,
9907.