Article
, Vol. 29, No. 10, 2096-2103, 2018Printed in Brazil - ©2018 Sociedade Brasileira de Química
*e-mail: [email protected]
Amperometric Electrochemical Platform for Hydrazine Determination Exploiting
Reduced Graphene Oxide, Co(Salophen) and DNA: Application in Pharmaceutical
Formulations Samples
Ludymila V. Freitas,a Kayni C. M. S. Lima,b Saimon M. Silva,c Fernando R. F. Leite,a
Ridvan N. Fernandes,b Wallans T. P. Santos,d Flavio S. Damosb and Rita C. S. Luz*,b
aDepartamento de Química, Universidade Federal dos Vales do Jequitinhonha e Mucuri,
39100-000 Diamantina-MG, Brazil
bDepartamento de Química, Universidade Federal do Maranhão, 65080-805 São Luís-MA, Brazil
cSchool of Chemistry, University of New South Wales, 2052 Sydney, Australia
dDepartamento de Farmácia, Universidade Federal dos Vales do Jequitinhonha e Mucuri,
39100-000 Diamantina-MG, Brazil
The present work presents the development of a sensitive and selective amperometric sensor for the determination of hydrazine (HZ) in pharmaceutical formulations using a glassy carbon electrode (GCE) modified with a composite based on Co(Salophen), reduced graphene oxide (rGO) and deoxyribonucleic acid (DNA). The rGO/Co(Salophen)/DNA composite was characterized by using Fourier-transform infrared spectroscopy (FTIR), cyclic voltammetry, and amperometry. The proposed platform presented a well-defined voltammetric profile with a redox couple around 0.32 V vs. Ag/AgCl which showed excellent catalytic activity towards HZ oxidation. The peak current of HZ electrochemical oxidation on the proposed electrochemical platform have changed linearly with the HZ concentration in the range from 2 to 364 µmol L-1. The proposed platform presented sensitivity, limit of detection, and limit of quantification of 0.056 µA L µmol-1, 0.54 µmol L-1, and 1.64 µmol L-1 to HZ, respectively. The relative standard deviation for eight determinations using a solution of 50 µmol L-1 HZ was 0.85%. The proposed sensor was successfully applied for the determination of HZ in pharmaceutical formulations, and the recovery tests showed a good accuracy with recovery percentage between 99 and 101%.
Keywords: sensor, Co(Salophen), reduced graphene oxide, DNA, hydrazine, pharmaceutical formulations
Introduction
Nowadays, the interest on hydrazine (HZ) has been increasing due to its high reactivity, which has been exploited in the production of a number of materials including insecticides and pesticides, as well as it has been employed in the preparation of some pharmaceutical formulations such as nifuroxazide, carbidopa, hydralazine, dihydralazine, isoniazid and iproniazide.1-4 On the other
hand, the HZ is an extremely toxic compound as stated by some regulatory agencies such as the United States Environmental Protection Agency and the European Medicines Agency.5,6
According to regulatory agencies, the recommended levels of HZ in medicinal products such as isoniazid based drugs is of 125 ppm5,6 since the exposition to high levels
of hydrazine can be harmful to human life because of its potential carcinogenic and mutagenic effects.5-7 In this
sense, the monitoring of HZ in pharmaceutical formulations is of high importance to ensure the quality of the medicines released for consumption by the population.
The high importance of HZ in industrial, environmental and pharmaceutical fields have motivated the development of several analytical methodologies for HZ determination, such as spectrophotometry,8 injection analysis based
systems,9 chromatographic methods,10,11 and electrochemical
methods.12-15 The electrochemical methods present some
presented non-electrochemical methods, since they do not require long preparing steps, analytical grade reagents or skilled operators for the analysis. In this sense, the electrochemical methods show excellent performance for the determination of electroactive species in biological and environmental samples with good sensitivity, selectivity, low cost and high throughput. In addition, the electrochemical methods are portable, which facilitates the monitoring of molecules and the acquisition of information
in situ and online.16-22
However, the main limitation related to the electrochemical determination of HZ with conventional electrodes is the exigence of a high overpotential to be applied in order to promote the electrochemical oxidation of HZ. A common strategy to detect HZ using electrochemical methods is the employment of chemically modified electrodes, which can improve the sensitivity and selectivity of the sensing device, improving the electrocatalytic activities for the electrochemical oxidation of HZ.23,24
Among the most promising nanomaterials, reduced graphene oxide (rGO) have been recognized as an excellent platform for the development of electrochemical sensors since they present exquisite properties including high electrical conductivity, excellent thermal and mechanical properties, large surface to volume ratio, and they show high susceptibility to chemical modification.25-28 However, many
forms of graphene present low processability in a number of solvents as well as they require high electrochemical overpotentials to promote oxidation or reduction of many molecules.29 In this sense, the chemical functionalization of
graphene with Schiff-base metal complexes and the use of dispersing agents have been performed in order to improve its processability.29,30
On the one hand, deoxyribonucleic acid (DNA) is an interesting alternative to improve the application of graphene as platform to the development of sensors since DNA can act as a dispersing agent by improving the dispersion of the graphene in aqueous medium.31,32
On the other hand, Schiff-bases based transition metals complexes present excellent versatility between electronic properties, stereo-chemical and high electrocatalytic activity for many molecules, which can be exploited by combining to graphene to give novel composite materials with high conductivity, good stability and catalytic activity.33,34
Herein, we report the development of a sensitive and selective sensor for the amperometric determination of HZ in pharmaceutical formulations using a composite based on Co(Salophen) modified rGO dispersed in DNA. The proposed rGO/Co(Salophen)/DNA/glassy carbon electrode
(GCE) sensor presents low cost and can be applied for determination of HZ with high selectivity, precision, accuracy, and low response time.
Experimental
Reagents and chemicals
The graphite powder, hydrazine sulfate, double-stranded DNA (ds-DNA), boric acid, citric acid, disod ium and monosod ium p hosphates, PIPES [piperazine-N-N-bis(2-ethanesulfonic acid)], HEPES [N-(2-hydroxyethyl)piperazine-N-(2-ethanesulfonic acid)] and tris(hydroxymethyl) aminomethane were acquired from Sigma-Aldrich (São Paulo, Brazil).
Co(Salophen) complex (N,N
’-bis(salicylidene)-1,2-phenylenediaminocobalt(II)) was prepared according to methods previously published.35,36
The standard solutions were prepared previously for each experiment by appropriate dilution of the stock solutions. All solutions were prepared with water purified in a Purelab Classic System from ELGA (Buckinghamshire, USA) and the actual pH of each solution was determined with a pH meter model Digimed DM-20 (São Paulo, Brazil). The pH of the solutions was adjusted adding 0.1 mol L-1 HCl and 0.2 mol L-1 NaOH.
Spectroscopic and electrochemical measurements
Fourier-transform infrared (FTIR) spectra were obtained using a Shimadzu FTIR 8.400 (Tokyo, Japan). The samples were prepared at 1% in KBr tablets (rGO, Co/(Salophen), rGO/Co(Salophen)). All electrochemical measurements were performed with an Autolab® PGSTAT
128N potentiostat/galvanostat from Metrohm Autolab (Utrecht, Netherlands) coupled to a microcomputer and controlled by GPES 4.9 software.
Preparation of reduced graphene oxide (rGO)
Sensor construction
A dispersion was prepared by mixing 3 mg of the reduced graphene oxide modified with Co(Salophen) complex with 1 mL of 2 mg mL-1 DNA dispersion. In order
to modify the GCE with the composite, the surface of the GCE was polished with alumina slurry and, subsequently, it was copiously washed with water to remove any previously adsorbed material. 10 µL of the dispersion was dropped on the surface of the electrode and the set was left to dry at 60 °C for 10 min to obtain the rGO/Co(Salophen)/DNA modified electrode.
Preparation of the samples and electrochemical determination of HZ
Drugs samples containing isoniazid (INH) from two different laboratories were purchased at local drugstores. The nominal values of INH and rifampicin (RF), for each capsule, were 200 and 300 mg, respectively. The content of 5 capsules was macerated and 500.4 mg of the powder was weighed and dispersed in water. The dispersion was filtered, transferred to a volumetric flask, and the volume was adjusted with water to 100 mL. The electrochemical analysis of each sample was performed by mixing an aliquot of 500 µL of the sample to 9.5 mL of the PBS (phosphate-buffered saline) buffer solution in the electrochemical cell.
Results and Discussion
Composite characterization
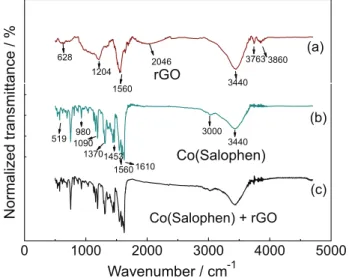
The Fourier transformed infrared spectrum of rGO presented two peaks at 3500 and 1600 cm−1 corresponding
to the stretching and bending vibration of OH groups of water molecules adsorbed on rGO (Figure 1a). The symmetric and anti-symmetric stretching vibrations of CH2 of the rGO were verified at 2930 and 2859 cm−1,
respectively. The stretching vibration of C=O of carboxylic acid and carbonyl groups present at the edges of graphene were verified at 1630 and 740 cm−1,
respectively.37 Although the graphite oxide had been
reduced by hydrazine route, peaks at 1385 and 1110 cm−1
corresponding to the stretching vibration of C−C of carboxylic acid and C−OH of alcohol were observed in FTIR spectrum of rGO, justifying the hydrophilic nature of obtained reduced graphene oxide.38 On the
other hand, the FTIR spectrum of the Co(Salophen) (Figure 1b) presented vibrations of specific groups verified in molecular structure of the Co(Salophen) complex.39
The spectrum c in Figure 1 obtained for the rGO/Co(Salophen) composite indicates that the interaction between reduced graphene oxide and Co(Salophen) occurred through a physical adsorption. As can be seen, the characteristic bands of compounds observed in spectra 1a and 1b were observed in spectrum 1c.
Electrochemical behavior of hydrazine on rGO/Co(Salophen)/ DNA/GCE
Firstly, cyclic voltammograms (CV) for HZ oxidation were performed with different electrodes in 0.1 mol L-1
PBS (pH 7) as supporting electrolyte in order to evaluate the electrocatalytic behavior of the rGO/ Co(Salophen)/DNA modified electrode to HZ. Figure 2 shows CV obtained in the absence (Figure 2, curve d) and presence (Figure 2, curve e) of 0.3 mmol L-1 HZ
for the rGO/Co(Salophen)/DNA/GCE, which were compared to CV of the bare GCE (Figure 2, curve a), rGO/DNA/GCE (Figure 2, curve b) and Co(Salophen)/ DNA/GCE (Figure 2, curve c) in presence of HZ.
In Figure 2 (curve a), the anodic peak potential for oxidation of HZ at bare electrode occurs in an overpotential of between 700 and 800 mV, suggesting that the electron transfer between the surface of the bare electrode and the HZ is kinetically slow. On the other hand, the electrocatalytic oxidation of HZ occurred at about 490 mV (Figure 2, curve b) when the electrode surface was modified with rGO/DNA film, which is shifted about
300 mV vs. Ag/AgCl toward less positive values in
comparison to the bare electrode.
The curve c in Figure 2 presents the cyclic voltammogram referring to HZ oxidation on the Co(Salophen)/DNA electrode. It was observed a significant
increase of the anodic peak current of HZ with a shift of the anodic peak of HZ to about 280 mV vs. Ag/AgCl, which can be attributed to the electrocatalytic activity of Co(Salophen) complex.
The CV of the rGO/Co(Salophen)/DNA modified electrode in the absence (Figure 2, curve d) showed a redox couple indicating the process of oxidation and reduction of cobalt complex CoII/CoI on the electrode surface. Upon
addition of 0.3 mmol L−1 HZ (curve e), there is a dramatic
enhancement of the anodic peak current and the cathodic peak current disappeared completely as expected from an electrocatalytic process.40
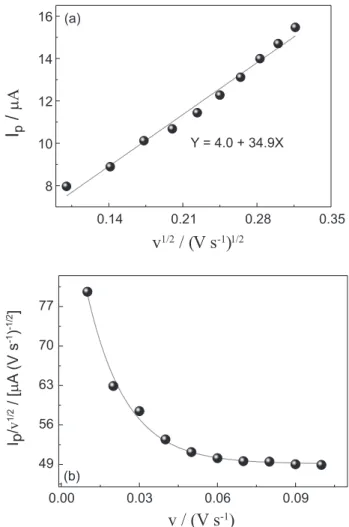
In order to investigate the nature of the electrocatalytic oxidation of hydrazine on the rGO/Co(Salophen)/DNA modified electrode, it was carried out CV at several scan rates. The plot of Ip vs. v1/2 (Figure 3a) shows a linear
relationship, suggesting that the process is controlled by mass transport and indicating that the system is an irreversible process controlled by diffusion.
Assuming an irreversible oxidation, the following equation was employed to calculate the number of electrons (n) involved in the overall reaction from the slope of the plot of Ipversus v1/2:41,42
(1)
where Ip is the peak current (A), na represents the number
of electrons involved in the rate-determining step (in this case the na value used was 1), n the number of total
electrons involved in the reaction of the electroactive specie (cm2 s-1), A the area (cm2), C (0.3 × 10⁻⁶ mol cm-3)
is the concentration of the electroactive species, and v is the potential scan rate (V s-1). The diffusion coefficient of
HZ used was 5.9 × 10⁻⁶ cm2 s-1.43
The approach utilized to get the value of α for HZ
oxidation was based on the difference between the peak potential (Ep) and the potential where the current is half
the peak current value (Ep/2), according to the following
equation:42
(2)
In this sense, the value calculated for α was 0.32 and
the value of n determined was 4.04 suggesting an electron transfer mechanism of four electrons for the electrocatalytic oxidation of HZ. Additionally, the plot of Ip/v1/2 vs. scan
rate (Figure 3b) shows a typical electrocatalytic-catalytic behavior to the oxidation process of the HZ on the rGO/ Co(Salophen)/DNA/GCE.
Figure 3. (a) Plot of peak current (Ip) versus the square root of scan
rate for the rGO/Co(Salophen)/DNA modified electrode; (b) plot of (Ip/v1/2) versus the scan rate. Date obtained from the Figure 3a: v = 0.01,
0.02, 0.03, 0.04, 0.05, 0.06, 0.07, 0.08, 0.09 and 0.1 V s-1.
Figure 2. CVs of the bare (a) GCE; (b) rGO/DNA/GCE; and (c) Co(Salophen)/DNA/GCE in the presence of HZ. CVs of the rGO/Co(Salophen)/DNA/GCE: in (d) absence (voltammogram insert) and (e) presence of the HZ. Measurements were carried out in 0.1 mol L-1
PBS; pH 7; [HZ] = 0.3 mmol L-1; [Co(Salophen)] = 1 mmol L-1;
Effects of the concentrations of rGO, Co(Salophen), and pH on the electrocatalytic oxidation of HZ
The response of the rGO/Co(Salophen)/DNA/GCE to HZ can be affected by rGO and Co(Salophen) concentrations. The concentration of DNA film was kept constant at 2 mg mL-1 for all experiments. CV of the
electrode modified with several concentrations of rGO and Co(Salophen) were performed in the presence of 0.3 mmol L-1 HZ, to obtain the optimal concentrations of
rGO and Co(Salophen) for the electrochemical oxidation of HZ on rGO/Co(Salophen)/DNA/GCE.
The amount of immobilized rGO on the surface of electrode was controlled by using the same volume of the suspension at different concentrations of rGO (2.0; 2.5; 3.0; 3.5 and 4.0 mg mL-1) maintaining fixed concentrations
of Co(Salophen) (1 mmol L-1) and DNA (2 mg mL-1).
The effect of the rGO amount on the sensor response is shown in Table S1 (Supplementary Information (SI) section). As can be seen, the peak current for HZ oxidation increased when the rGO concentration increased from 2.5 to 3.0 mg mL-1. In this sense, the rGO concentration was
kept at 3.0 mg mL-1 for all subsequent measurements in
order to find the better stability of the film and response toward HZ oxidation.
The Co(Salophen) concentration also affects the sensor response (Table S1, SI section). As can be observed in Table S1, the anodic peak current toward HZ oxidation increased when the complex concentration increased from 0.01 to 1.0 mmol L-1. Sensors constructed from solutions
with Co(Salophen) concentrations lower than 1.0 mmol L-1
showed low peak currents toward HZ oxidation. In addition, sensors prepared with Co(Salophen) concentrations higher than 1.0 mmol L-1 were also inefficient to provoke the
electrocatalysis of the HZ oxidation. Then, all subsequent sensors were prepared with 1.0 mmol L-1 of Co(Salophen),
2 mg mL-1 of DNA, and 3.0 mg mL-1 of rGO.
The influence of the solution pH on the electrochemical response of HZ was also investigated for 0.1 mol L-1
PBS with pH values between 6.5 and 8.5 (Figure S1a, SI section). The experimental results indicate that pH has a significant influence on the values of the anodic peak current (Figure S1a, SI section) and peak potential (Figure S1b, SI section). According to Figure S1a, the maximum value of peak current was obtained at pH 7.0, probably due to the higher stability of the modifier (rGO/Co(Salophen)/DNA) on the surface of the electrode, thus favoring a greater current for the oxidation of hydrazine. In this sense, the optimum pH for further studies was fixed at 7.0.
The anodic peak potential (Epa) shifted to negative
potentials with an increase of pH values (Figure S1b, SI
section). The Epa values shift linearly with changes in pH
values with a correlation coefficient of 0.999 and a slope of −0.073 V per pH at 25 °C. The obtained slope is close to that expected for an electrode reaction based on one proton/one electron (0.060 V per pH).42
The effect of the buffer solution on the peak current with the sensor for HZ was also investigated. Figure S1c (SI section) shows the response of the rGO/Co(Salophen)/DNA modified electrode in different buffer solutions, such as: PBS, HEPES, Britton-Robinson (BR) and Tris at concentration of 0.1 mol L-1, pH 7. The best response
towards HZ oxidation was obtained using PBS, which may be associated to the high ionic mobility of the phosphate ions, by faciliting the electronic transfer between the electrode and the solution. In this sense, the PBS was chosen for further experiments.
The applied potential (Eappl.) was verified after the
optimization of experimental conditions. Thus, an initial study was performed in order to determine the best potential to be applied to the electrode (0.20; 0.24; 0.30; 0.32; 0.36; 0.40; 0.43 and 0.46 V vs. Ag/AgCl). Figure S1d (SI section) shows the sensor response time (lower than 1 s) and the values of the currents observed for these potentials were, respectively, 7.30 ± 0.12; 8.60 ± 0.10; 9.46 ± 0.09; 9.70 ± 0.05; 9.69 ± 0.04; 8.89 ± 0.11; 8.20 ± 0.02; and 7.30 ± 0.01 µA. According to these results, high current values were obtained between 0.3 and 0.36 V due to total oxidation of HZ in these potentials. In this sense, the chosen potential for the following experiments was 0.32 V.
Analytical characterization of the rGO/Co(Salophen)/DNA modified electrode
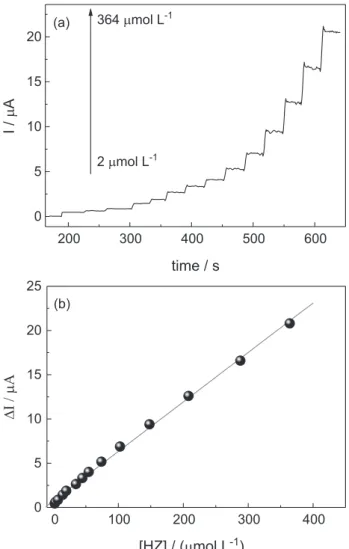
Figure 4 shows the amperometric response and analytical curves recorded for the rGO/Co(Salophen)/DNA modified electrode under optimized conditions for different concentrations of HZ. The proposed sensor showed a linear response range from 2 to 364 µmol L-1 with r2 = 0.999,
which can be expressed in the following equation:
∆I(µA) = (0.752 ± 0.103) + (0.056 ± 0.007)[HZ](µmol L–1) (3)
A limit of detection of 0.54 µmol L-1 was determined
using a 3s/b slope ratio and the limit of quantification was 1.64 µmol L-1 using 10s/b slope, where s is the standard
The relative standard deviation (RSD) for eight determinations of 50 µmol L-1 HZ was 0.8%. Additionally,
a series of eight sensors were prepared and tested under the same conditions, resulting in an RSD of 1.03% of the electrochemical responses. These results indicate that the rGO/Co(Salophen)/DNA modified electrode has good stability and repeatability, probably due to the ability of graphene and DNA in fixing Co(Salophen) compound on the electrode surface in a stable and reproducible way.
The stability of the rGO/Co(Salophen)/DNA modified electrode was checked in the presence of 50 µmol L-1 HZ
performing successive voltammetric measurements in 0.1 mol L-1 PBS (pH 7.0). After 100 voltammetric
measurements no change was observed in the response of the modified electrode. When the modified electrode was stored at room temperature no significant change in the response was observed for more than two months.
Interfering studies
In order to verify the selectivity of the proposed method, rGO/Co(Salophen)/DNA/GCE was used for the determination of impurities of HZ that may be present in the isoniazid based drugs, investigating possible interferences of chemical species that are often found in the analyzed tablet samples. Table S3 (SI section) shows the relative responses for the analytical signal intensities obtained using a solution of 50 µmol L-1 HZ and the same solutions
enriched with the interfering in 1:1 ratio. The study was performed under optimized experimental and operational conditions and the amperograms were obtained in triplicate for greater reliability of the results.
As presented in Table S3 (SI section), the compounds ascorbic acid, isoniazide, thiosulfate, rifampicin and magnesium stearate did not present significant interference on the voltammetric response to HZ, which classifies the proposed sensor as selective for the determination of the analyte mentioned in pharmaceutical samples. This finding might be related to the fact that the analyzed compounds have higher oxidation potentials than HZ.
Determination of HZ in pharmaceutical samples employing rGO/Co(Salophen)/DNA/GCE and addition and recovery tests
The proposed sensor was applied to drugs used in the treatment of tuberculosis (isoniazid) and the results regarding to the found HZ concentrations in laboratory samples A and B are presented in the Table 1. The analytical curve for each sample was obtained by relating the amounts of HZ added to the sample to the respective ∆I
pa determined
by amperometry under optimized experimental and operational conditions. According to the results, it can be observed that the amount of HZ determined in both samples A and B was lower than the maximum allowed HZ value in isoniazid drugs (125 ppm or 3.9 mmol L-1).5,6
The accuracy of the proposed procedure was investigated through the addition and recovery experiments that were performed by adding two known quantities of the analyte in the samples (Table 1). The recovery percentage was given by the ratio of the total HZ concentration (sample + standard added) found and the expected total concentration multiplied by 100. The addition and recovery tests were performed in triplicate for greater reliability of the results. It is suggested, through the presented results, that the sensor allowed a good recovery for the HZ in the samples of the capsules analyzed, with values of recovery between 99 and 101%, suggesting a good accuracy of the proposed method.
Figure 4. (a) Amperometric I-t curve for the determination of HZ at rGO/Co(Salophen)/DNA modified electrode; (b) analytical curve for the oxidation of HZ in 0.1 mol L-1 PBS at pH 7.0 for the concentrations:
2; 3; 7; 14; 20; 35; 45; 54; 74; 103; 148;208; 288 and 364 µmol L-1 of
Conclusions
This work shows that a GCE modified with rGO/ Co(Salophen)/DNA is a feasible alternative for analytical determination of HZ in pharmaceutical samples used in the treatment of tuberculosis. Optimization of the experimental conditions resulted in a limit of detection and sensitivity for HZ better than those described in the literature. This sensor showed good repeatability for both the measurements and electrode preparation, evaluated in terms of relative standard deviations. Moreover, the method showed a good percentage of recovery for the samples; therefore, it can be concluded that the rGO/Co(Salophen)/DNA/GCE is a sensitive, robust, and stable sensor for HZ determination in pharmaceutical samples.
Supplementary Information
Supplementary data are available free of charge at http://jbcs.sbq.org.br as PDF file.
Acknowledgments
The authors are grateful to Conselho Nacional de Desenvolvimento Científico e Tecnológico (CNPq) and Instituto Nacional de Ciência e Tecnologia (INCT) - Bioanalítica.
References
1. Elder, D. P.; Snodin, D.; Teasdale, A.; J. Pharm. Biomed.2011, 54, 900.
2. Goswami, S.; Das, S.; Aich, K.; Sarkar, D.; Mondal, T. K.; Tetrahedron Lett.2014, 55, 2695.
3. Khan, M.; Kumar, S.; Jayasree, K.; Reddy, K. V. S. R. K.; Dubey, P. K.; Chromatographia2013, 76, 801.
4. Shukla, S.; Chaudhary, S.; Umar, A.; Chaudhary, G. R.; Mehta, S. K.; Sens. Actuators, B2014, 196, 231.
5. Kean, T.; Miller, J. H.; Skellern, G. G.; Snodin, D.; Pharmeur. Sci. Notes2006, 2006, 23.
6. Mehta, S. K.; Singh, K.; Umar, A.; Chaudhary, G. R.; Singh, S.; Electrochim. Acta2012, 69, 128.
7. Zhang, Y.; Han, T. Y.; Wang, Z. Y.; Zhao, C.; Li, J. N.; Fei, T.; Liu, S.; Lu, G. Y.; Zhang, T.; Sens. Actuators, B2017, 243, 1231. 8. Mitic, V. D.; Nikolic, S. D.; Stankov-Jovanovic, V. P.; Cent.
Eur. J. Chem.2010, 8, 559.
9. Yu, L.; Zhang, X. S.; Yu, L.Y.; Adv. Mater. Res.2012, 130, 396. 10. Oh, J. A.; Park, J. H.; Shin, H. S.; Anal. Chim. Acta2013, 769,
79.
11. Smolenkov, A. D.; Chernobrovkina, A. V.; Smirnov, R. S.; Shpigun, O. A.; J. Anal. Chem.2012, 67, 360.
12. Kocak, S.; Altin, A.; Kocak, C. C.; Anal. Lett.2016, 49, 1015.
13. Lee, J. Y.; Nguyen, T. L.; Park, J. H.; Kim, B. K.; Sensors2016, 16, 647.
14. Mohammadi, S. Z.; Beitollahi, H.; Asadi, E. B.; Environ. Monit. Assess.2015, 187, 122.
15. Mozloum-Ardakani, M.; Karimi, M. A.; Zare, M. M.; Mirdehghan, S. M.; Int. J. Electrochem. Sci.2008, 3, 246. 16. Beitollahi, H.; Tajik, S.; Parvan, H.; Soltani, H.; Akbari, A.;
Asadi, M. H.; Anal. Bioanal. Electrochem. 2014, 6, 54. 17. Moghaddam, H. M.; Beitollahi, H.; Tajik, S.; Malakootian, M.;
Karimi-Maleh, H.; Environ. Monit. Assess. 2014, 186, 7431. 18. Beitollahi, H.; Tajik, S.; Mohammadi, S. Z.; Baghayeri, M.;
Ionics2014, 20, 571.
19. Tajik, S.; Taher, M. A.; Beitollahi, H.; Ionics2014, 20, 1155. 20. Baghbamidi, S. E.; Beitollahi, H.; Mohammadi, S. Z.; Tajik,
S.; Soltani-Nejad, S.; Soltani-Nejad, V.; Chin. J. Catal. 2013, 34, 1869.
21. Beitollahi, H.; Tajik, S.; Karimi-Maleh, H.; Hosseinzadeh, R.; Appl. Organomet. Chem. 2013, 27, 444.
22. Beitollahi, H.; Karimi-Maleh, H.; Khabazzadeh, H.; Anal. Chem. 2008, 80, 9848.
23. Kim, S. P.; Choi, H. C.; Sens. Actuators, B2015, 207, 424. 24. Prathap, M. U. A.; Anuraj, V.; Satpati, B.; Srivastava, R.;
J. Hazard. Mater.2013, 262, 766.
Table 1. Recovery values of HZ obtained for 2 pharmaceutical samples
Sample (n = 2) [HZ] added / (µmol L-1) [HZ] expected / (µmol L-1) [HZ] found / (µmol L-1) Recoverya / %
A
0.00 – 5.00 ± 0.10 –
10.00 15.00 15.10 ± 0.10 101
100.00 105.00 104.80 ± 0.50 100
B
0.00 – 7.00 ± 0.30 –
10.00 17.00 16.90 ± 0.20 99
100.00 107.00 106.90 ± 0.10 100
25. Silva, S. M.; Aguiar, L. F.; Carvalho, R. M. S.; Tanaka, A. A.; Damos, F. S.; Luz, R. C. S.; Microchim. Acta2016, 183, 1251. 26. Huang, Y.; Liang, J. J.; Chen, Y. S.; Small2012, 8, 1805. 27. Novoselov, K. S.; Geim, A. K.; Morozov, S. V.; Jiang, D.; Zhang,
Y.; Dubonos, S. V.; Grigorieva, I. V.; Firsov, A. A.; Science2004, 306, 666.
28. Ratinac, K. R.; Yang, W. R.; Gooding, J. J.; Thordarson, P.; Braet, F.; Electroanalysis2011, 23, 803.
29. Ribeiro, I. A. L.; Yotsumoto-Neto, S.; dos Santos, W. T. P.; Fernandes, R. N.; Goulart, M. O. F.; Damos, F. S.; Luz, R. C. S.; J. Braz. Chem. Soc.2017, 28, 1768.
30. Sarvestani, A. H.; Mohebbi, S.; J. Chem. Res.2006, 4, 257. 31. Premkumar, T.; Geckeler, K. E.; Prog. Polym. Sci.2012, 37,
515.
32. Zhang, Q. A.; Qiao, Y.; Hao, F.; Zhang, L.; Wu, S. Y.; Li, Y.; Li, J. H.; Song, X. M.; Chem. - Eur. J.2010, 16, 8133.
33. Dong, Y. W.; Fan, R. Q.; Wang, P.; Wei, L. G.; Wang, X. M.; Zhang, H. J.; Gao, S.; Yang, Y. L.; Wang, Y. L.; Dalton Trans. 2015, 44, 5306.
34. Kostova, I.; Saso, L.; Curr. Med. Chem.2013, 20, 4609. 35. Smith, C. W.; Loon, G. W. V.; Baird, M. C.; Can. J. Chem.1976,
54, 1875.
36. Tauzher, G.; Mestroni, G.; Puxeddu, A.; Costanzo, R.; Costa, G.; J. Chem. Soc. A1971, 2504.
37. Lima, K. C. M. S.; Santos, A. C. F.; Fernandes, R. N.; Damos, F. S.; Luz, R. C. S.; Microchem. J.2016, 128, 226.
38. Chai, P. J.; Li, Y. S.; Tan, C. X.; Chin. Chem. Lett.2011, 22, 1403.
39. Zhu, D. J.; Mei, F. M.; Chen, L. J.; Mo, W. L.; Li, T.; Li, G. X.; Fuel2011, 90, 2098.
40. Luz, R. D. S.; Damos, F. S.; Tanaka, A. A.; Kubota, L. T.; Gushikem, Y.; Electrochim. Acta2008, 53, 4706.
41. Andrieux, C. P.; Saveant, J. M.; J. Electroanal. Chem.1978, 93, 163.
42. Bard, A. J.; Faulkner, L. R.; Electrochemical Methods: Fundamentals and Applications, 2nd ed.; Wiley: New York,
2001.
43. Duarte, J. C.; Luz, R. D. C. S.; Damos, F. S.; de Oliveira, A. B.; Kubota, L. T.; J. Solid State Electrochem.2007, 11, 631.
44. Benvidi, A.; Jahanbani, S.; Mirjalili, B. F.; Zare, R.; Chin. J. Catal.2016, 37, 549.
45. Luo, X.; Pan, J.; Yu, Y.; Zhong, A.; Wei, S.; Li, J.; Shi, J.; Li, X.; J. Electroanal. Chem. 2015, 745, 80.
46. Ensafi, A. A.; Abarghoui, M. M.; Rezaei, B.; Electrochim. Acta 2016, 190, 199.
47. Liu, Y.; Chen, S. S.; Wang, A. J.; Feng, J. J.; Wu, X.; Weng, X.; Electrochim. Acta 2016, 195, 68.
48. Zhao, Z.; Sun, Y.; Li, P.; Zhang, W.; Lian, K.; Hu, J.; Chen, Y.; Talanta2016, 158, 283.
49. Bansal, P.; Bhanjana, G.; Prabhakar, N.; Dhau, J. S.; Chaudhary, G. R.; J. Mol. Liq.2017, 248, 651.
50. Samanta, S.; Srivastava, R.; J. Electroanal. Chem. 2016, 777, 48.
51. Gao, F.; Wang, Q.; Gao, N.; Yang, Y.; Cai, F.; Yamane, M.; Gao, F.; Tanaka, H.; Biosens. Bioelectron.2017, 15, 238.
52. Gillani, N. S.; Zizi, S. N.; Ghasemi, S.; Bull. Mater. Sci.2017, 40, 177.
53. Conceição, C. D. C.; Faria, R. C.; Fatibello-Filho, O.; Tanaka, A. A.; Anal. Lett. 2008, 41, 1010.
54. Ahmad, K.; Mohammad, A.; Rajak, R.; Mobin, S. M.; Mater. Res. Express2016, 3, 074005.
55. Siangproh, W.; Chailapakul, O.; Laocharoensuk, R.; Wang, J.; Talanta2005, 67, 903.
56. Deroco, P. B.; Melo, I. G.; Silva, L. S. R.; Eguiluz, K. I. B.; Salazar-Banda, G. R.; Fatibello-Filho, O.; Sens. Actuators, B 2018, 256, 535.
57. Malik, P.; Srivastava, M.; Verma, R.; Kumar, M.; Kumar, D.; Singh, J.; Mater. Sci. Eng., C 2016, 58, 432.
58. Wu, M.; Ding, W.; Meng, J. L.; Ni, H. M.; Li, Y.; Ma, Q. H.; Anal. Sci.2015, 31, 1027.
59. Lee, K. K.; Loh, P. Y.; Sow, C. H.; Chin, W. S.; Biosens. Bioelectron.2013, 39, 255.
60. Canales, C.; Gidi, L.; Arce, R.; Ramirez, G.; New J. Chem. 2016, 40, 2806.
Submitted: January 15, 2018
Published online: April 18, 2018