Article
Printed in Brazil - ©2012 Sociedade Brasileira de Química0103 - 5053 $6.00+0.00A
*e-mail: [email protected]
Influence of Spatial, Edaphic and Genetic Factors on Phenols and
Essential Oils of
Myrciaria cauliflora
Fruits
Alessandra R. Duarte,a Suzana C. Santos,a José C. Seraphinb and Pedro H. Ferri*,a
aLaboratório de Bioatividade Molecular, Instituto de Química and bNúcleo de Estatística Aplicada, Instituto de Matemática e Estatística, Universidade Federal de Goiás, CP 131,
74001-970 Goiânia-GO, Brazil
A composição química dos óleos essenciais e o conteúdo em fenóis (fenóis totais, taninos e antocianinas) bem como os teores de açúcares redutores e da acidez dos frutos de M. cauliflora foram
obtidos de plantas cultivadas sob seis tipos de solo. As análises de redundância canônica (RDA) e de discriminante indicaram a presença de quatro grupos de amostras, tendo o α-copaeno e os teores de taninos, açúcares redutores e da acidez do fruto como variáveis preditoras. O particionamento da variância, conduzida por meio de RDAs parciais, revelou uma forte influência de fatores edáficos sobre o conteúdo dos fenólicos, açúcares redutores e da acidez dos frutos, enquanto que o polimorfismo nos óleos essenciais foi atribuído majoritariamente a fatores genéticos. Para todos os constituintes a influência espacial na variabilidade química foi significativa, embora menos pronunciada para os óleos essenciais.
Essential oil chemical composition and phenolics (total phenols, tannins and anthocyanins), reducing sugar and fruit acidity contents of Myrciaria cauliflora were obtained from cultivated populations in six sampling sites. Canonical redundancy (RDA) and discriminant analyses revealed four clusters of samples based on contents of α-copaene, tannins, reducing sugar and fruit acidity as predictor variables. The total variation partition performed by partial RDAs showed a strong influence of edaphic factors on phenolics, reducing sugar and fruit acidity data set. However, the polymorphism of essential oils may be genetically determined. Spatial influence on chemovariations was significant for all constituents, but less pronounced for essential oil data.
Keywords: Myrciaria cauliflora, essential oil, chemical variability, environmental influence,
spatial pattern
Introduction
The Jaboticaba tree, also known as Brazilian grape tree (Myrciaria cauliflora (Mart.) O. Berg., Myrtaceae), can be wild-grown or cultivated. Its berries are consumed in natura, thus offering an economic alternative for improving management of the remaining Brazilian Cerrado areas.1 In the last decade, commercial products derived from
Jaboticaba have increased in number and producers aim to improve the quality of different kinds of jams, ice creams, vinegar, liquor and wines.2 Several reports have described
the antioxidant activity of fruits, which is mostly attributed to the high content of anthocyanins and flavonoids in skins.3,4 Two depsides were identified in a bioactivity-guided
fractionation, both of which exhibited antiradical activity
in DPPH (1,1-diphenyl-2-picrylhydrazyl) assay, colon cancer cell cytotoxicity and inhibition of interleukin IL-8 production, suggesting anti-inflammatory activity.3 Leaf
essential oils were recently described and showed mainly sesquiterpenes,5 a trend that has been observed in other
Myrtaceae genera such as Myrcia, Eugenia and Psidium.6
However, the major constituent in the leaf essential oil was
γ-eudesmol, which is an unusual oil constituent for the Myrtaceae family. Essential oil constituents and phenolic contents from leaves showed high chemical polymorphism according to sampling sites.5
Phenotypic variations in essential oils and phenolics are well known among species and within individuals of the same species. The levels as well as the quality of both chemical classes can be modified by genetic or environmental factors.7 Although the influences of soil and
the spatial influence is scarcely known, despite strong evidence pointing to the importance of spatial distributions in pollination, competition, herbivory, nutrient cycling and other ecological process.8 The detection and measurement
of spatial pattern are relevant to the understanding of plant-herbivore interactions, decomposition and nutrient mineralization in soils. This spatial structure may, thus, affect nutrient availability for plants in different neighborhoods and consequently the content and quality of secondary metabolites along a geographical gradient within a community or population.8,9
We now report the results obtained for the chemical composition of essential oils, phenolics, reducing sugar and acidity of M. cauliflora fruits collected from populations growing on six soils of Jaboticabal Winery, located in central Brazilian Cerrado. This work complements the one performed on essential oils and phenols of Jaboticaba leaves for the detection of interesting phenotypes for agro-industrial use.5 Phenolics and volatile compounds have been
described as responsible for some organoleptic properties of the Jaboticaba wine, such as color, astringent taste and aroma.2 Indeed, the use of chemical markers together
with genetic or adaptative traits should lead to improved fruit cultivars and to a more effective process of rational economic exploitation of native fructiferous species from the Brazilian Cerrado.
For this purpose, total phenols, tannins, anthocyanins, reducing sugars and fruit acidity contents, as well as essential oil constituents of representative population samples from each soil origin, were analyzed by colorimetric assays and GC-MS (gas chromatography-mass spectrometry). Soil parameters from each site origin were also determined and regarded as environmental variables. To study the environmental influence on chemical variability, chemical constituents were submitted to canonical redundancy (RDA) and linear discriminant (LDA) analyses. These analyses were made in order to detect sample distribution pattern and to identify which chemical constituents are able to distinguish these groups of individuals. In addition, we employed spatial statistical methods to detect and describe spatial patterns in sampling sites, as well as chemical variations partitioning among different sources of assumed influence, i.e. edaphic, spatial and genetic factors.
Results and Discussion
There are few reports in the literature regarding essential oils from Myrtaceae fruits (only 12 species). These mainly focus on Eugenia (4), Campomanesia (2) and Psidium (2) genera.6 Unlike the M. dubia (Kunth) McVaugh fruit
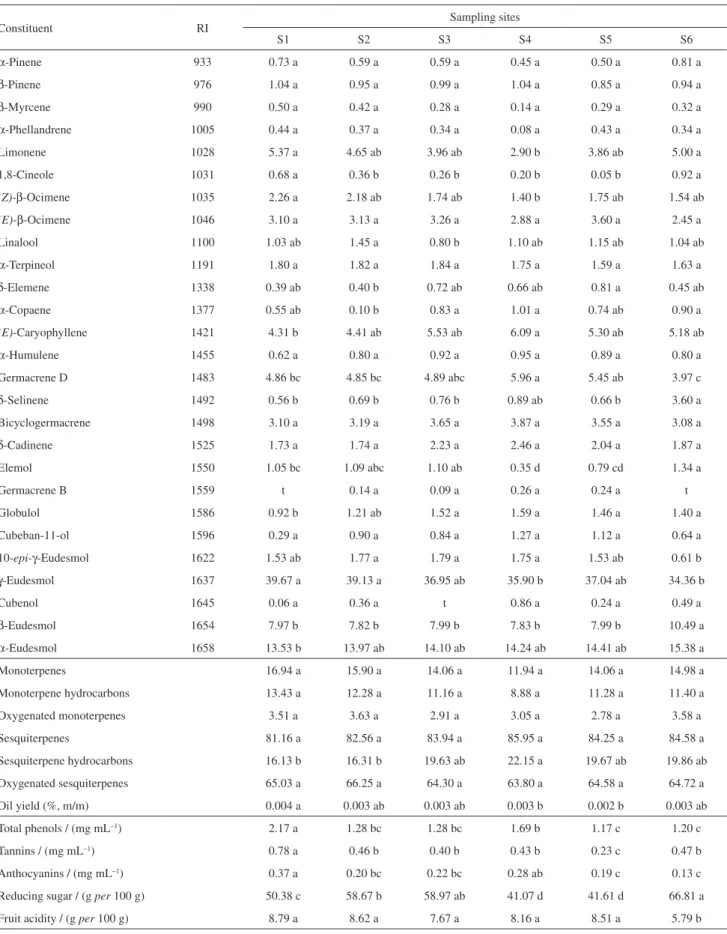
(Amazonian camu-camu), whose essential oils did not markedly differ from leaf oils,10 M. cauliflora fruit (Table 1)
showed higher relative abundances in γ-eudesmol (average range of 34.4-39.7%; leaf oil,5 8-12%), total monoterpenes
(11.9-16.9%; leaf oil, 2-4%) and α-eudesmol (13.5-15.4%; leaf oil, 10-13%), but lower germacrene D content (4.0-6.0%; leaf oil, 20-27%). However, nearly half of the abundances in β-eudesmol (7.8-10.5%), (E)-caryophyllene (4.4-6.1%) and bicyclogermacrene (3.1-5.6%) was observed in fruit oils in comparison to leaf ones. Further twenty minor constituents (< 5%) were only identified in fruits or in leaf essential oils. All fruit oils predominantly reveal oxygenated sesquiterpene compositions (63.8-66.3%), with high amounts of eudesmol isomers (minimum of 50.8% to 71.4%), whereas sesquiterpene hydrocarbons were the most biosynthetic class in the leaf (48-58%).
Eudesmols play potential roles in plant defense, including resistance to attack from ants, seasonal pathogens and insects, as well as show antifungal activity.11
They are also known to have various beneficial effects on human health and are regarded as lead compounds for treating epileptic seizures, angiogenic diseases, migraine headache and dementia.12β-Eudesmol has proved to be an
antidote for organophosphorus poisoning and markedly relieves spasms, tremors and convulsions. 13 It has been the
target of production by metabolically modified E. coli.13
The analysis of variance (ANOVA) showed that fruit samples from soils of lower nutrient balance (S1) had the lowest percentage of (E)-caryophyllene, α-eudesmol and total sesquiterpene hydrocarbons, despite showing the highest contents of total phenols, tannins and anthocyanins and moderate reducing sugar content (Table 1). As regards fruit samples from fertilized soils (S4 and S5), these showed the lowest amount in reducing sugar, limonene, 1,8-cineole and elemol, despite revealing the highest amounts of (E)-caryophyllene and germacrene D. Differences in the amounts of sesquiterpene hydrocarbons, phenolics (total phenol, tannins and anthocyanins), reducing sugar and fruit acidity were observed, whereas other terpene biosynthetic classes failed to reveal significant differences between fruit samples growing on different sites. Oil constituents were also grouped according to their carbon skeletons on each sampling site. Data were standardized in accordance with the total percentage identified on each site. Similar chemical variations were observed in the ANOVA as regards oil constituents (Table S1 in the Supplementary Information (SI) section).
Table 1. Percentages and yields in essential oils, phenolics, reducing sugar and fruit acidity from M. cauliflora according to sampling sites
Constituent RI Sampling sites
S1 S2 S3 S4 S5 S6
α-Pinene 933 0.73 a 0.59 a 0.59 a 0.45 a 0.50 a 0.81 a
β-Pinene 976 1.04 a 0.95 a 0.99 a 1.04 a 0.85 a 0.94 a
β-Myrcene 990 0.50 a 0.42 a 0.28 a 0.14 a 0.29 a 0.32 a
α-Phellandrene 1005 0.44 a 0.37 a 0.34 a 0.08 a 0.43 a 0.34 a
Limonene 1028 5.37 a 4.65 ab 3.96 ab 2.90 b 3.86 ab 5.00 a
1,8-Cineole 1031 0.68 a 0.36 b 0.26 b 0.20 b 0.05 b 0.92 a
(Z)-β-Ocimene 1035 2.26 a 2.18 ab 1.74 ab 1.40 b 1.75 ab 1.54 ab
(E)-β-Ocimene 1046 3.10 a 3.13 a 3.26 a 2.88 a 3.60 a 2.45 a
Linalool 1100 1.03 ab 1.45 a 0.80 b 1.10 ab 1.15 ab 1.04 ab
α-Terpineol 1191 1.80 a 1.82 a 1.84 a 1.75 a 1.59 a 1.63 a
δ-Elemene 1338 0.39 ab 0.40 b 0.72 ab 0.66 ab 0.81 a 0.45 ab
α-Copaene 1377 0.55 ab 0.10 b 0.83 a 1.01 a 0.74 ab 0.90 a
(E)-Caryophyllene 1421 4.31 b 4.41 ab 5.53 ab 6.09 a 5.30 ab 5.18 ab
α-Humulene 1455 0.62 a 0.80 a 0.92 a 0.95 a 0.89 a 0.80 a
Germacrene D 1483 4.86 bc 4.85 bc 4.89 abc 5.96 a 5.45 ab 3.97 c
δ-Selinene 1492 0.56 b 0.69 b 0.76 b 0.89 ab 0.66 b 3.60 a
Bicyclogermacrene 1498 3.10 a 3.19 a 3.65 a 3.87 a 3.55 a 3.08 a
δ-Cadinene 1525 1.73 a 1.74 a 2.23 a 2.46 a 2.04 a 1.87 a
Elemol 1550 1.05 bc 1.09 abc 1.10 ab 0.35 d 0.79 cd 1.34 a
Germacrene B 1559 t 0.14 a 0.09 a 0.26 a 0.24 a t
Globulol 1586 0.92 b 1.21 ab 1.52 a 1.59 a 1.46 a 1.40 a
Cubeban-11-ol 1596 0.29 a 0.90 a 0.84 a 1.27 a 1.12 a 0.64 a
10-epi-γ-Eudesmol 1622 1.53 ab 1.77 a 1.79 a 1.75 a 1.53 ab 0.61 b
γ-Eudesmol 1637 39.67 a 39.13 a 36.95 ab 35.90 b 37.04 ab 34.36 b
Cubenol 1645 0.06 a 0.36 a t 0.86 a 0.24 a 0.49 a
β-Eudesmol 1654 7.97 b 7.82 b 7.99 b 7.83 b 7.99 b 10.49 a
α-Eudesmol 1658 13.53 b 13.97 ab 14.10 ab 14.24 ab 14.41 ab 15.38 a
Monoterpenes 16.94 a 15.90 a 14.06 a 11.94 a 14.06 a 14.98 a
Monoterpene hydrocarbons 13.43 a 12.28 a 11.16 a 8.88 a 11.28 a 11.40 a
Oxygenated monoterpenes 3.51 a 3.63 a 2.91 a 3.05 a 2.78 a 3.58 a
Sesquiterpenes 81.16 a 82.56 a 83.94 a 85.95 a 84.25 a 84.58 a
Sesquiterpene hydrocarbons 16.13 b 16.31 b 19.63 ab 22.15 a 19.67 ab 19.86 ab
Oxygenated sesquiterpenes 65.03 a 66.25 a 64.30 a 63.80 a 64.58 a 64.72 a
Oil yield (%, m/m) 0.004 a 0.003 ab 0.003 ab 0.003 b 0.002 b 0.003 ab
Total phenols / (mg mL−1) 2.17 a 1.28 bc 1.28 bc 1.69 b 1.17 c 1.20 c
Tannins / (mg mL−1) 0.78 a 0.46 b 0.40 b 0.43 b 0.23 c 0.47 b
Anthocyanins / (mg mL−1) 0.37 a 0.20 bc 0.22 bc 0.28 ab 0.19 c 0.13 c
Reducing sugar / (g per 100 g) 50.38 c 58.67 b 58.97 ab 41.07 d 41.61 d 66.81 a
Fruit acidity / (g per 100 g) 8.79 a 8.62 a 7.67 a 8.16 a 8.51 a 5.79 b
treated as species data set (42 samples × 38 variables), whereas textures and physicochemical soil parameters formed the environmental data set (42 samples × 18 variables). These two matrices were jointly analyzed by canonical redundancy analysis, which assesses the way environmental variables may account for species data set.14 In RDA, the
species-environmental correlation equals the correlation between sampled site scores that are weighted sums of species and site scores, which in turn are a linear combination of environmental variables.15 RDA canonical
axis is similar to principal component analysis (PCA), but it has a restriction on sampled site scores.
Figure 1 shows RDA ordination results of species data set, whose soil parameters were treated as environmental variables [42 samples in 6 sites × 38 species variables ×
18 environmental variables]. Species-environmental correlations were higher for the first two canonical axes (0.774 and 0.911). All canonical eigenvalues accounted for 34.2% of total variance in species data set, with ca. 80% of cumulative variance of the species-environmental relation retained in the first factorial plane. A statistical test with an unrestricted Monte Carlo permutation (9999 permutations) found significant Fischer’s F-ratio for the eigenvalues of RDA axes 1 (F-value = 6.300; p < 0.0002) and 2 (F = 6.123; p < 0.0002). Trace statistics (i.e. the sum of all canonical eigenvalues) were highly significant (traces = 0.324 and 0.179; F-values = 4.434 and 3.257; p < 0.0001), giving signs that patterns in the RDA plane did not arise by
chance.14,15 These results suggest a moderate but significant
association between oil composition/phenolics/reducing sugar/fruit acidity contents and the measured texture and nutritional soil parameters (environmental factors) shown in the data sets.
According to the triplot shown in Figure 1, RDA axis 1 clearly correlated to nutrient balance in fertilized clayey soils S4 and S5 (Mg2+, Ca2+, K+, Mn2+, Zn2+, P, pH, organic
matter and cationic change capacity), which shows a strong relationship with total sesquiterpenes, sesquiterpene hydrocarbons, (E)-caryophyllene, δ-cadinene and germacrene group (germacrene B, germacrene D and bicyclogermacrene) of fruit samples. An increase in the value of RDA axis 2 is associated with an increase in Al3+ and potential acidity (H + Al3+) of clay sand loam S6
soil, whose fruit samples showed high contents of reducing sugar, α- and β-eudesmols. In addition, the value increase of axis 2 is also highly linked to a reduction in silt texture, Fe3+
and Cu2+ levels of S1 soil, whose samples show high fruit
acidity, total phenols and tannins, and γ-eudesmol contents. Thus, whereas axis 1 shows changes in soil fertility, axis 2 mainly describes a differential soil texture from different sites. Similar results were obtained from constituents of essential oils, which were grouped according to the carbon skeleton (Figure S1 in the SI section).
The positive correlation observed between S6 soil acidity and the content of β-eudesmol (p < 0.05) is consistent with that described for the accumulation of β-eudesmol in roots of Atractylodes lancea Thunb. (Asteraceae) in a more acidic medium.16 Similarly to described correlations
in essential oils of M. cauliflora leaves,5 sesquiterpene
hydrocarbons showed a divalent metal ion requirement (especially Mg2+) as a cofactor of sesquiterpene synthases.
In peppermint, δ-cadinene is produced by (E)-β-farnesene synthase in the presence of Mg2+ ions.17 In addition, the
formation of germacrenes D and B and bicyclogermacrene in ginger (Zingiber officinale Roscoe; Zingiberaceae) by germacrene D synthase is favored with Mg2+ as a cofactor,
but it is inactive in the presence of Cu2+ ions.18 Similar
positive and negative effects of Mg2+ and Cu2+ in the
germacrene group, respectively, are in agreement with the correlations observed in this study.
As regards the fruit phenolic distribution, we found significant amounts of these constituents in samples from low fertilized sand soil (S1). This finding may be accounted by the fact that phenolics were protecting fruits by acting as antioxidants, thus a higher concentration was required to protect fruits from abiotic stresses.19
Phenolic contents in plant tissues have been related to light and nutrient availabilities. In most studies, phenolic production decreases at high nitrogen availability and
Figure 1. RDA ordination of the first two axes showing the distribution
of M. cauliflora sampling sites (S1: , S2: , S3: , S4: £, S5: , S6: ). Soil parameters were treated as environmental variables and are represented by long arrows from the origin. Oil constituents, phenolics, reducing sugar and fruit acidity contents are represented by triangles instead of arrows and the triangle position is multiplied by 10 for clear visualization. Fitted variables whose values were < 30% are not shown.
aAxes refer to scores from samples; baxes refer to loadings from variables
increases under nitrogen deficiency,20 whereas positive
correlation between phenolics and light availability has been observed by several authors.21 This trend was
followed by M. cauliflora fruits, which showed the lowest phenolic levels in fertilized soils (S4 and S5). However, the expected high reducing sugar contents in fertile S4 and S5 soils were not observed. Our personal repeated field work in sampling sites revealed that S4 and S5 fruits receive less light. Trees from these sites have a closed canopy and their fruits grow on lower solar luminosity, which may act as a limiting factor in the biosynthesis of both metabolites, sugars and phenolics.
When the LDA analysis was applied to the data set, samples from the six soils were grouped in four classes, with α-copaene, fruit acidity, tannins and reducing sugar acting as predictor variables (Figure 2). The fitted model showed high canonical correlation (0.956) and significant Wilks’ lambda (0.026; p < 0.00001), which accounts for a multivariate measure of group differences over several variables. The first discriminant function (F1) accounts for ca. 85% of total variability and distinguishes (F-value = 23.05; degree of freedom, DF = 12 and 92; p < 0.00001) cluster II (S4 and S5) from IV (S6) due to high negative and positive scores of fruit acidity and reducing sugar, respectively. The second discriminant function (F2) highlights (F = 9.79; DF = 6 and 72; p < 0.0001) cluster I (S1 and S2) as a result of tannin high negative scores and
α-copaene positive scores.
Furthermore, the two discriminant functions make it possible to correctly classify 93% of samples in the original
clusters by means of cross-validation. The only mismatched classification was a sample from S2 soil (cluster I) which had been classified as belonging to cluster III (S3). Such misclassification could be caused by a lower tannin level in the sample. Percentages of oil constituents (or according to carbon skeletons), phenolics, reducing sugar and fruit acidity contents in clustered samples are shown in the SI section (Tables S2 and S3).
The importance of environmental factors suggests that food and agro-industries that promote fruit exploitation should concentrate their efforts on local environmental conditions, which themselves are spatially structured,15,22
to distinguish the performance of fruit chemicals. The spatial structure of a data set is usually described by an empirical variogram, a plot of the variance or the difference between pairs of observations against their distance in geographical space.15 Alternatively, this type of covariation
may be effectively approached by constraining ordinations considering the spatial location of each individual as a variable upon which multivariate statistical analyses are performed. The procedures assess the relative importance of constraining matrix (edaphic and spatial data set) after adjusting the variability of other data sets which are regarded as covariate.22 In this study, variation partitioning
was performed on two separate sets, one containing essential oil data (set 1) and the other containing total phenols, tannins, anthocyanins, reducing sugar and fruit acidity contents (called phenolics, set 2) as response matrices (Table 2).
Results of the variation partitioning performed by partial redundancy analysis (pRDA) on each response matrix showed that the variation explained by edaphic factors ([A] in Table 2) is similar for both data sets (23.6 and 21.4% for oils and phenolic data, respectively), whereas only 8.6 and 54.4% of variation in oils and phenolics, respectively, has been explained by spatial variables ([B + C]). In the analysis of relationships between response matrices and spatial variables, a new consensus x and y coordinates has been completed by adding all terms for a cubic trend surface regression (see Experimental section). This ensures not only the linear gradient pattern in each response data to be extracted, but also more complex features such as patches or gaps, which require the quadratic and cubic terms of coordinates and their interactions to be correctly described.15,22 In order to avoid
multicolinearity, significant monomials were selected by the multivariate stepwise regression method, which retained the following terms: x2 and y2 (oil data), and x, y, y2 and y3 (phenolic data). A Monte Carlo permutation test of the trace statistics (sum of all canonical eigenvalues) confirmed the significance of the canonical relationship between each
Figure 2. Canonical discriminant scatter plot of M. cauliflora from six sampling sites, according to the clusters they belong to: I (S1, ; S2, ), II (S4, £; S5, ), III (S3, ), and IV (S6, ). aAxes refer to scores from
samples. bAxes refer to loadings from discriminant variables represented
response matrix and spatial variables (p < 0.037). Fraction [C], which represents ca. 7% in each data set, corresponds to variation accounted by spatial matrix regardless of edaphic factors, whereas ca. 20% of the variation explained by edaphic factors in each data set is only local ([A]). Venn diagrams illustrating the variation partitioning are shown in the SI section (Figure S2).
As concerns fraction [B] (found by subtracting [A] from [A + B] (Table 2)), it represents 47.4% in phenolics and only 1.3% in oil variations. This fraction represents the spatial variation which has been accounted for edaphic factors.15,22
Therefore, nearly the entire variation explained in the phenolic data set should be modeled by edaphic variables, i.e. variations in total phenols, tannins, anthocyanins, reducing sugar and fruit acidity are environmentally determined (spatial and edaphic). In contrast, the high unexplained variation in the oil data set (see residuals, [D]) suggested that essential oil chemovariations should be mainly determined by genetic factors. After removing the effect of spatial structure, the correlations of clay soil with the first axis greatly increase, whereas silt maintains a strong but negative correlation with the first axis (Table 3). In fact, the variance explained by these two variables (55.2%) considerably contributes (p < 0.001) to determining local variation in the phenolic data set, although spatial data structure should be mainly determined by clay soil content in sampling sites.
The squared Euclidean distances (DE
2) among phenolic data in sampling site pairs (data not shown) ranged from 4.5 between S2 and S3 (368 m) to 66.6 between S1 and S6 (1398.7 m). Globally, the lowest DE2 values were observed among samples with small geographical distances, whereas
the highest ones were noted between geographically distant samples. The Mantel test performed among Euclidean distance matrices of geographical and phenolic pairs showed a highly significant correlation (r = 0.21, p = 0.0001; 999 permutations, p = 0.003).15,23 A similar spatial autocorrelation
was also observed on essential oils and geographical data sets (r = 0.12, p = 0.006; 999 permutations, p = 0.013), confirming that the spatial distribution of both essential oil and phenolic data sets did not arise by chance.
In our study, the high chemical divergence among sampling sites was correlated with the geographical distance, and chemovariations occurred at a local scale, thus suggesting different ecotypes. However, chemical differentiation among samples could not be explained by isolation due to geographical distance, low-level gene flow among subpopulations. Whereas edaphic factors and geographical distance were determinant for phenolic divergence, these factors appear to be less important, but involved in the chemical polymorphism revealed in essential oils.
Table 2. Summary of variation partitioning using partial RDA of M. cauliflora fruit constituents, with soil and spatial data as predictors
Effect and main variables
Variation fraction
Variation explaineda P (sum λ)b λ
1c P (λ1)
Set 1d Set 2 Set 1 Set 2 Set 1 Set 2 Set 1 Set 2
Total effect
Soil, spatial [A + B + C] 32.6 75.9 0.001 0.001 0.152 0.445 0.001 0.001
Partial effects
Soil [A + B] 24.9 68.8 0.001 0.001 0.154 0.432 0.001 0.001
Soil (spatial)e [A] 23.6 21.4 0.001 0.001 0.118 0.182 0.002 0.001
Spatial [B + C] 8.6 54.4 0.037 0.001 0.430 0.430 0.001 0.001
Spatial (soil) [C] 7.5 7.1 0.018 0.005 0.059 0.043 0.076 0.031
Joint effect
Soil, spatial [B] 1.3 47.4
Residuals [D] 67.4 24.1
aSum of canonical eigenvalues (λ) divided by total inertia (1.0) × 100; bprobability based on Monte Carlo test (999 permutations); cfirst autovalue; dset 1:
essential oil data; set 2: phenolics, reducing sugar and fruit acidity data; edata set as covariate; spatial data are significant monomial terms (set 1: x2, y2;
set 2: x, y, y2, y3) of third-order polynomial trend surface originated by first two PCA axes of UTM geographical coordinates of sampling sites (northing,
easting and altitude).
Table 3. Inter set correlations of selected edaphic factors with partial
RDA axes
Edaphic factor
Variation partitioning fraction
[A + B] [A]
RDA1 RDA2 RDA1 RDA2
Clay −0.0849 0.8372 −0.9218 −0.0169
Silt 0.8136 0.0646 −0.8689 0.0344
Fe3+ −0.0804 −0.1455 0.2628 0.1802
Some authors have proposed microenvironmental selection as a factor that generates spatial chemical structure,9 for instance, light availability showed spatial
autocorrelation and may induce a spatial pattern in phenolic contents.21 This suggests that spatial chemical
structure does not originate from a single factor. On the contrary, several biotic or abiotic factors could operate simultaneously in favor of or against chemical divergence.
Conclusions
Chemical variability in M. cauliflora fruits determined by multivariate chemometric techniques in addition to spatial statistics may reflect an environmental influence on total phenols, tannins, anthocyanins, reducing sugar and fruit acidity contents. Their spatial distribution appeared to be linked to edaphic selective forces acting on the chemical polymorphism, although it may also have been caused by genetic factors, especially on essential oil chemovariations in cultivated samples. The cultivation of populations under uniform environmental conditions and the assessment of the stability of their chemical profiles could provide a selection of interesting ecotypes or chemotypes to a most effective use of M. cauliflora subpopulations.
Experimental
Plant material
M. cauliflora var. pingo de mel fruits were collected between September and November 2009 at Jaboticabal Winery, located in Hidrolândia City, Goiás State, Brazil. Fruit samples were obtained from seven trees grown in six different soils (sampling sites): S1 (S 16° 55' 23'', W 49° 21' 50", 728 m), S2 (S 16° 55' 25", W 49° 21' 53", 730 m), S3 (S 16° 55' 26", W 49° 21' 41", 732 m), S4 (S 16° 55' 24", W 49° 21' 36", 735 m), S5 (S 16° 54' 41", W 49° 21' 26", 758 m) and S6 (S 16° 54' 44", W 49° 21' 25", 761 m). The 42 sampled trees were aged between 10 and 40 years old and originated from seeds of the same progenies. Soil characteristics in sampling sites were previously described.5
Oil analyses
To assess essential oils, frozen berries (0.5 kg) were crushed in small pieces and submitted to hydrodistillation (2 h) by means of a modified Clevenger-type apparatus. At the end of each distillation, oils were collected, dried with anhydrous Na2SO4, transferred to glass flasks and kept at a
temperature of −18 °C until analysis. Oil yields (%) were based on the fresh weight of fruit samples.
Oil sample analyses were performed on a GC-MS Shimadzu QP5050A instrument under the following conditions: a CBP-5 (Shimadzu) fused silica capillary column (30 m × 0.25 mm i.d., 0.25 µm film thickness) connected to a quadrupole detector operating in the EI mode at 70 eV with a scan mass range of 40-400 m/z at a sampling rate of 1.0 scan s−1, carrier gas of He (1 mL min−1),
injector and interface temperatures of 220 and 240 °C, respectively, with a split ratio of 1:20. The injection volume was 0.4 µL (ca. 10% in hexane) and the oven temperature was raised from 60 to 246 °C with an increase of 3 °C min−1,
then 10 °C min−1 to 270 °C, holding the final temperature
for 5 min. Individual components were identified by comparing their linear retention indices,24 which were
determined by co-injection with a C8−C32 n-alkanes
series,25 mass spectra with those of the literature5,24 and a
computerized MS-database using NIST libraries.24 Total ion
chromatograms (TIC) of fruit essential oils from sampling sites are shown in the SI section (Figures S3 to S8).
Total phenolic content
The amount of 1 g of freeze-dried berries was homogenized with 10 mL of MeOH-formic acid (9:1) in a test tube and sonicated for 30 min. The extract was centrifuged, filtered and the marc extracted three more times for 15 min. Extracts were combined and concentrated under reduced pressure at 35 °C and brought up to 25 mL in a volumetric flask.
Total phenolic analysis was performed by the Folin-Ciocalteu method.26 An aliquot (0.5 mL) of
the diluted extract (10 fold) and 0.5 mL of 2 mol L−1
Folin-Ciocalteu reagent (Sigma, St. Louis, MO, USA) were mixed in a 25 mL volumetric flask. After 5 min, 10 mL of 20% Na2CO3 solution were added and the
volume reached 25 mL of distilled water. This mixture was then allowed to stand for 60 min at room temperature and the absorbance was determined at 750 nm. The standard curve was constructed with tannic acid (Merck) at the following dilutions: 0.02, 0.1, 0.2, 0.3, 0.4, 0.5 and 0.6 mg mL−1. The correlation coefficient was r = 0.9987.
Total phenolic content was calculated as tannic acid equivalents (TAE) per g of dry weight. All solutions were analyzed in triplicate.
Tannin content
Sigma) solution (1.0 mg mL−1) in 0.2 mol L–1 acetate buffer
(pH 4.9).27 After centrifugation, the precipitate was dissolved
in sodium dodecyl sulfate (Sigma)/triethanolamine (Merck) solution (4.0 mL) and tannins were complexed with 1.0 mL of FeCl3 solution. The colored complex
was then read at 510 nm. Measurements were made in the range 0.2 < A < 0.9. All solutions were analyzed in triplicate. The standard curve was constructed with tannic acid at the following dilutions: 0.2, 0.3, 0.4, 0.5, 0.6, 0.8 and 1.0 mg mL−1. The linearity range went from 0.2
to 0.6 mg mL−1. The correlation coefficient for this range
was r = 0.9964.
Anthocyanin content
Anthocyanin content was determined by the pH-differential method.28 Pigment concentration was
calculated and expressed as cyanidin 3-glucoside equivalents per g of dry weight (DW) using following equation:
(1)
where
A = (A520 nm – A700 nm)pH 1.0 – (A520 nm – A700 nm)pH 4.5 (2)
and MW (molecular weight) = 449 g mol−1, DF = dilution
factor (50), l = 1 the cuvette pathlength in cm and
ε = 26900 L mol−1 cm−1 molar extinction coefficient for
cyanidin 3-glucoside. Measurements were performed in triplicate.
Determination of reducing sugar
Freeze-dried berries (0.2 g) were extracted at 50 °C with 10 mL of distilled water in an ultrasonic bath for 30 min. The extract was separated from the solid residue by centrifuging at 4000 rpm for 15 min. The same procedure was repeated twice with 10 and 5 mL of water for 15 min each. The extracts were combined to a final 25 mL volume.
Reducing sugar content was determined by the 3,5-dinitrosalicylic acid (DNSA) method.29 An aliquot
(3.0 mL) of the diluted extract (5:100) was mixed with 3.0 mL of DNSA reagent and left for 15 min in a boiling water bath. After the color development, 1.0 mL of 40% Rochelle salt solution was added. Absorbance was measured at 540 nm using a spectrophotometer (Beckman DU-70). Results were expressed as g glucose equivalent per 100 g dried fruit. Measurements were performed in triplicate.
Determination of fruit acidity
Total acidity was measured by titrating an aliquot (5.0 mL) of the extract mentioned in the previous section with 0.01 mol L–1 of NaOH to pH 8.2. Results
were expressed as g citric acid per 100 g dried fruit.30
Measurements were performed in triplicate.
Chemical variability
A multivariate analysis was performed in CANOCO (Canonical Community Ordination) version 4.5 together with CanoDraw 4.1 packages.14 Oil compositions (27 oil
constituents in addition to 6 biosynthetic classes), total phenols, tannins, anthocyanins, reducing sugar and fruit acidity contents were ordered in a species data matrix with rows (42) = localities (seven samples from each of the six sites) and columns (38) = variables. Soil parameters were ordered in an environmental data matrix with rows (42) = localities (seven samples from each of the six sites) and columns (18) = edaphic variables.
Initial detrended canonical analysis (DCA) was applied to check the magnitude of change in species composition among sites along the first ordination axis (i.e. gradient length in standard deviation units, SD). In this study, DCA estimated the compositional gradient in the species data to be shorter than 0.8 SD units, thus RDA was the appropriate ordination method to perform linear direct gradient analysis.14,15 RDA revealed an ordination of the species data
constrained by edaphic variables, which accounts for the patterns of the only explained variation between data sets. Monte Carlo permutation tests (999 permutations) were performed to assess the significance of canonical axes, showing the relationships between species variables and the selected edaphic factors.
LDA via CANOCO was used to differentiate samples based on environmental single nominal variables defining a priori recognized clusters.14 Thus, clusters were coded as
dummy environmental variables according to RDA results. Forward stepwise procedure on the species data set was used as variable selection. Partial Monte Carlo permutation tests (999 permutations) adjusted by Bonferroni’s corrections were used to calculate the statistical significance of variable effects. The predictive ability of discriminant functions was assessed by a cross-validation approach.31
Partial RDA produced constrained ordinations while controlling the effect of a number of significant edaphic variables. Total variation partitioning of species data between edaphic and spatial components was obtained by partial RDA.15,22 Spatial data consisted of
geographical coordinates of plant individuals (northing, easting and altitude), which were summarized by the first two extracted axis (new x and y coordinates) of a PCA. The new consensus x and y coordinates has been completed by adding all terms of a third-degree surface trend polynomial equation. Significant monomials were selected using the forward selection procedure available in CANOCO, with Bonferroni’s adjustment and the variance inflation factor acting to decrease error type I and to assess the multicolinearity in the regression.14
The variation partitioning yielded four fractions of species data variation: [A] local species variation, explained by edaphic factors regardless of any spatial structure, [B] spatial structure in the species data which is shared by edaphic factors, [C] spatial structure in the species data which is not shared by edaphic factors, and [D] unexplained variation by predictor data sets.15,22 In
addition, the Mantel test was used to test the significance of the relationship between the species similarity matrix and the geographical distance matrix.23 Euclidean distance
was used to compute these similarity matrices. Prior to the multivariate analysis, the data were preprocessed by auto-scaling and mean centering. All soil chemical variables, except pH, phenolics, reducing sugar and fruit acidity were log(x + 0.5)-transformed. Oil constituents, texture and organic matter in soils were submitted to the following
angular transformation:
In all tables, average multiple comparisons were established by ANOVA using SAS GLM analyses (Statistical Analysis System, SAS Institute Inc., Cary, NC, 1996). All data were checked for homoscedasticity with Hartley’s test. Whenever heteroscedasticity was observed, the variable was angular or rank-transformed. Whenever a difference was established in ANOVA, a post-hoc Tukey test was performed. p-Values below 0.05 were regarded as significant.
Supplementary Information
Supplementary data (Figures S1-S8, Tables S1-S3) are available free of charge at http://jbcs.sbq.org.br as a PDF file.
Acknowledgements
The authors are indebted to Conselho Nacional de Desenvolvimento Científico e Tecnológico (CNPq), Programa de Apoio ao Desenvolvimento Científico e Tecnológico (PADCT III) and Fundação de Apoio à Pesquisa/UFG (FUNAPE/UFG) for financial support,
as well as to Conselho de Aperfeiçoamento do Ensino Superior (CAPES) for granting A. R. D. a fellowship. We also acknowledge Dr. Paulo Antônio Silva of Jaboticabal Winery for providing valuable plant information and for helping with data collection.
References
1. Sato, A. C. K.; Cunha, R. L.; J. Food Eng.2009, 91, 566; Lima, A. J. B.; Corrêa, A. D.; Alves, A. P. C.; Abreu, C. M. P.; Dantas-Barros, A. M.; Arch. Latinoam. Nutr.2008, 58, 416. 2. Duarte, W. F.; Dias, D. R.; Oliveira, J. M.; Teixeira, J. A.; Silva,
J. B. A.; Schwan, R. F.; LWT Food Sci. Technol. 2010, 43, 1564; Silva, P. H. A.; Faria, F. C.; Tonon, B.; Mota, S. J. D.; Pinto, V. T.;
Quim. Nova 2008, 31, 595; Ascheri, J. L. R.; Cienc. Tecnol.
Aliment.2006, 26, 325; Asquieri, E. R.; Damiani, C.; Candido,
M. A.; Assis, E. M.; Alimentaria2004, 355, 111.
3. Reynertson, K. A.; Yang, H.; Jiang, B.; Basile M. J.; Kennelly, E. J.; Food Chem.2008, 109, 883.
4. Santos, D. T.; Veggi, P. C.; Meireles, M. A. A.; J. Food Eng. 2010, 101, 23; Rufino, M. S. M.; Alves, R. E.; Brito, E. S.; Pérez-Jiménez, J.; Saura-Calixto, F.; Mancini-Filho J.; Food Chem.2010, 121, 996; Einbond, L. S.; Reynertson, K. A.; Luo, X.-D.; Basile, M. J.; Kennelly, E. J.; Food Chem.2004, 84, 23.
5. Duarte, A. R.; Santos, S. C.; Seraphin, J. C.; Ferri, P. H.; J. Braz. Chem. Soc.2010, 21, 1672.
6. Stefanello, M. E. A.; Pascoal, A. C. R. F.; Salvador, M. J.; Chem. Biodiversity2011, 8, 73.
7. Hosni, K.; Msaada, K.; Taârit, M. B.; Marzouk, B.; Biochem. Syst. Ecol.2011, 39, 43; Duarte, A. R.; Naves, R. R.; Santos, S. C.;
Seraphin, J. C.; Ferri, P. H.; J. Braz. Chem. Soc.2010, 21, 1459; Costa, D. P.; Santos, S. C.; Seraphin, J. C.; Ferri, P. H.;
J. Braz. Chem. Soc.2009, 20, 1287.
8. Lenardis, A. E.; Van Baren, C.; Lira, P. D. L.; Ghersa, C.; Eur. J. Agron.2007, 26, 410; Moore, B. D.; Wallis, I. R.; Wood, J. T.; Foley, W. J.; Ecol. Monogr.2004, 74, 553; Klinkhamer, P. G. L.;
Jong, T. J.; Linnebank, L. A.; Ecol. Lett. 2001, 4, 559. 9. Broz, A. K.; Broeckling, C. D.; De La Peña, C.; Lewis, M. R.;
Greene, E.; Callaway, R. M.; Sumner, L. W.; Vivanco, J. M.;
BMC Plant Biol.2010, 10, 115; Ali, I. B. E.; Zaouali, Y.;
Bejaoui, A.; Boussaid, M.; Chem. Biodiversity2010, 7, 1276; Covelo, F.; Gallardo, A.; Forest Ecol. Manage.2009, 258, 2511;
Andrew, R. L.; Peakall, R.; Wallis, I. R.; Foley, W. J.; Ecology 2007, 88, 716;Brenes-Arguedas, T.; Coley, P. D.; Oikos2005,
108, 410; Covelo, F.; Gallardo, A.; Plant Soil2004, 259, 267. 10. Quijano, C. E.; Pino, J. A.; J. Essent. Oil Res.2008, 20, 205;
Quijano, C. E.; Pino, J. A.; J. Essent. Oil Res.2007, 19, 527. 11. Marinho, C. G .S.; Della Lucia, T. M. C.; Ribeiro, M. M. R.;
Magalhães, S. T. V.; Guedes, R. N. C.; Jham, G. N.; Bull. Entomol. Res. 2008, 98, 467; Abdulkhader, H.; Nirmal, P.;
Marsaro, A. L.; Souza, R. C.; Lucia, T. M. C. D.; Fernandes, J. B.; Silva, M. F. G. F.; Vieira, P. C.; J. Chem. Ecol.2004, 30, 1771; Kusuma, I. K.; Ogawa, T.; Itoh, K.; Tachibana, S.;
Pakistan J. Biol. Sci.2004, 7, 1735.
12. Horak, S.; Koschak, A.; Stuppner, H.; Striessnig, J.;
J. Pharmacol. Exp. Ther.2009, 330, 220; Obara, Y.; Yakugaku
Zasshi2006, 126, 747; Tsuneki, H.; Ma, E.-L.; Kobayashi, S.; Sekizaki, N.; Maekawa, K.; Sasaoka, T.; Wang, M.-W.; Kimura, I.;
Eur. J. Pharmacol.2005, 512, 105; Chiou, L.-C.; Ling, J.-Y.; Chang, C.-C.; Neurosci. Lett.1997, 231, 171.
13. Yu, F.; Harada, H.; Yamasaki, K.; Okamoto, S.; Hirase, S.; Tanaka, Y.; Misawa, N.; Utsumi, R.; FEBS Lett.2008, 582,
565; Chiou, L.-C.; Ling, J.-Y.; Chang, C.-C.; Eur. J. Pharmacol. 1995, 13, 151; Kimura, M.; Nojima, H.; Muroi, M.; Kimura, I.;
Neuropharmacology1991, 30, 835.
14. Lepš, J.; Šmilauer, P.; Multivariate Analysis of Ecological Data Using CANOCO; Cambridge University Press: Cambridge, 2007; Ter Braak, C. J. F.; Šmilauer, P.; CANOCO Reference Manual and CanoDraw for Windows User’s Guide: Software for
Canonical Community Ordination (version 4.5); Microcomputer
Power: New York, 2002; Šmilauer, P.; CanoDraw for Windows 4.1; Microcomputer Power: New York, 2003; Jongman, R. H. G.;
Ter Braak, C. J. F.; Van Tongeren, O. F. R.; Data Analysis in Community and Landscape Ecology; Cambridge University
Press: Cambridge, 2002.
15. Legendre, P.; Legendre, L.; Numerical Ecology, 2nd ed.; Elsevier
Science: Amsterdam, 2003.
16. Yuan, Y.; Liu, Y. J.; Huang, L. Q.; Cui, G. H.; Fu, G. F.; Russ. J. Plant Physiol.2009, 56, 133.
17. Picaud, S.; Olofsson, L.; Brodelius, M.; Brodelius, P. E.; Arch. Biochem. Biophys. 2005, 436, 215; Crock, J.; Wildung, M.; Croteau, R.; Proc. Natl. Acad. Sci. U. S. A.1997, 94, 12833.
18. Picaud, S.; Olsson, M. E.; Brodelius, M.; Brodelius, P. E.; Arch. Biochem. Biophys. 2006, 452, 17.
19. Close, D. C.; McArthur, C.; Hagerman, A. E.; Fitzgerald, H.;
Phytochemistry2005, 66, 215.
20. Haukioja, E.; Ossipov, V.; Koricheva, J.; Honkanen, T.; Larsson, S.; Lempa, K.; Chemoecology1998, 8, 133.
21. Ingersoll, C. M.; Niesenbaum, R. A.; Weigle, C. E.; Lehman, J. H.; Botany2010, 88, 1007; Montanaro, G.; Treutter, D.;
Xiloyannis, C.; J. Plant Interact.2007, 2, 63; Hagen, S. F.; Borge, G. I. A.; Bengtsson, G. B.; Bilger, W.; Berge, A.; Haffner, K.; Solhaug, K. A.; Postharvest Biol. Technol.2007, 45, 1; Cordell, J. M.; Kennedy, J. A.; J. Agric. Food Chem.2006, 54, 8510.
22. Wagner, H.; Fortin, M.-J.; Ecology2005, 86, 1975; Méot, A.; Legendre, P.; Borcard, D.; Environ. Ecol. Stat. 1998, 5, 1;
Borcard, D.; Legendre, P.; Drapeau, P.; Ecology1992, 73, 1045. 23. Mantel, N.; Cancer Res.1967, 27, 209.
24. Adams, R. P.; Identification of Essential Oil Components by Gas Chromatography/Mass Spectrometry, 4th ed.; Allured: Illinois,
2007; National Institute of Standards and Technology (NIST);
PC version of the NIST/EPA/NIH Mass Spectral Database; U.S.
Department of Commerce: Gaithersburg, 1998.
25. Dool, H. V. D.; Kratz, P. D.; J. Chromatogr.1963, 11, 463.
26. Singleton, V. L.; Rossi Jr., J. A.; Am. J. Enol. Vitic.1965, 16, 144.
27. Hagerman, A. E.; Butler, L. G.; J. Agric. Food Chem.1978, 26, 809.
28. Wrolstad, R. E.; Durst, R. W.; Lee, J.; Trends Food Sci. Technol. 2005, 16, 423.
29. Miller, G. L.; Anal. Chem. 1959, 31, 426.
30. Kabasakalis, V.; Siopidou, D.; Moshatou, E.; Food Chem. 2000, 70, 325.
31. Wold, A.; Eriksson, L. In Chemometric Methods in Molecular Design, vol. 2; Waterbeemd, H., ed.; VCH Weinheim: Germany, 1995, ch. 5.
Submitted: September 27, 2011
![Figure 1 shows RDA ordination results of species data set, whose soil parameters were treated as environmental variables [42 samples in 6 sites × 38 species variables × 18 environmental variables]](https://thumb-eu.123doks.com/thumbv2/123dok_br/18996586.462393/4.892.68.411.677.939/figure-ordination-parameters-environmental-variables-variables-environmental-variables.webp)


