http://dx.doi.org/10.1590/s2175-97902017000216033
A
r
*Correspondence: E. Ricci Junior. Faculdade de Farmácia. Universidade Fed-eral do Rio de Janeiro. Av. Carlos Chagas Filho - Ilha do Fundão - 21941-590 - Rio de Janeiro – RJ, Brasil. E-mail: [email protected]
Development and validation of an analytical method using High
Performance Liquid Chromatography (HPLC) to determine ethyl
butylacetylaminopropionate in topical repellent formulations
Isadora Cabral Pinto
1, Cristal Cerqueira-Coutinho
2, Zaida Maria Faria de Freitas
1, Elisabete
Pereira dos Santos
1, Flávia Almada do Carmo
1, Eduardo Ricci Junior
1,*
1Faculty of Pharmacy, Galenic Development Laboratory, LADEG, Department of Medicine, Federal University of Rio de Janeiro, Rio de Janeiro, Brazil, 2Technology Center, Institute of Macromolecules, Federal University of Rio de Janeiro, Rio de
Janeiro, Brazil
Diseases caused by insects are frequent in poor countries, leading to epidemic scenarios in urban areas; e.g., Dengue, Zika and Chikungunya. For this reason, the development of a safe and eicient topical formulation is essential. Ethyl butylacetylaminopropionate (EB) is a mosquito repellent developed by Merck, which is used in products for adults, children and especially babies, due to its low allergenic potential. The aim of this work was to validate an analytical methodology to quantify EB in a new poloxamer-based formulation by high-performance liquid chromatography (HPLC). The quantiication methodology was performed at 40 ºC using a Kromasil reverse-phase column (C18), with the dimensions of 250 x 4.6 mm. The mobile phase was acetonitrile:water (1:1) at a 1.0 mL/min low-rate. The detector wavelength was set at 218 nm to detect EB. The methodology was considered validated since the results indicated linearity (R2>0.99), speciicity, selectivity, precision and accuracy (active recovery between
98% and 102%). It also presented limits of detection and quantiication of 0.255 µg/mL and 0.849 µg/ mL, respectively. The present study demonstrated the EB vehiculated in poloxamer gel is promising as a new insect repellent formulation, since it could be quantiied and quality control evaluated.
Uniterms: Ethyl butylacetylaminopropionate (EB)/quantiication. Ethyl butylacetylaminopropionate
(EB)/topical formulations. Analytical method. Validation. Repellents. Prophylaxis.High Performance Liquid Chromatography.
INTRODUCTION
In tropical countries, especially the underdeveloped and undeveloped ones, diseases caused by mosquito bites are frequent and could cause epidemics (Katz, Miller, Heber, 2008). Among diseases spread by mosquito bites, one of the most well-known is Dengue,
however, Chikungunya fever and the Zika virus are being
thoroughly studied. Currently, researchers all over the
world are trying to discover if non-speciic pathologies
such as microcephaly could be associated with the Zika virus (ZIKV), for example. All the diseases previously
mentioned have one thing in common: the mosquito Aedes
aegypti. Therefore, the use of repellent is a recommended prophylaxis, which increases the interest in developing
new long-lasting repellent formulations (Goorhuis et al.,
2016; Moulin et al., 2016; Petersen et al., 2016).
To be considered an ideal repellent, the formulation should present the following characteristics: extended
eicacy against a wide variety of arthropods, no irritation
potential to the skin after direct application or when applied to fabrics that will be in contact with the skin, no interaction with packaging, water resistant, has good sensorial properties and with no oily residue on the skin, nontoxic to humans and the environment and low cost stimulating a purchase decision (Frederiksen, Guy,
Petersson, 2015; Wang et al., 2014; Marcus et al., 2014).
preventing its permeation. In addition, it is important that the formulation form a homogeneous film on the skin,
ofering resistance to excessive sweating (Frederiksen,
Guy, Petersson, 2015; Wang et al., 2014; Marcus et al.,
2014).
Essential oil-based formulations are environmentally friendly since the active ingredient is collected from plant species found in nature. They could also provide protection against mosquito bites and have been described in the
scientiic literature as efective and safe (Chattopadhyay et al., 2015; Reegan et al., 2014; Tisgratog et al., 2015; Diaz, 2016). However, the pharmaceutical industry invests large amounts of money in safer synthetic repellent ingredients since its most famous repellent, diethyltoluamide (DEET), is considered by many to be relatively toxic and is not
recommended for use by pregnant women (Campos et al.,
2016; Wille, Thiermann, Worek, 2011).
One of these non-toxic synthetic repellents is the ethyl butylacetylaminopropionate (EB), launched by Merck in the global market in 1999. It is an oily, liquid, colorless organic substance, volatile under atmospheric pressure and at room temperature, slightly soluble in water, but soluble in organic solvents. EB action varies according to its concentration: 10 wt% in the formulation provides
eicacy against mosquitoes and its concentration could be
gradually increased by up to 30 wt%, which will provide
protection against bees, lies and ticks. Its mechanism of
action is directly related to its volatility, EB forms a vapor barrier that prevents the contact of mosquitoes with the skin due to its unpleasant odor, despite being odorless to human beings (WHO, 2006).
C o p o l y m e r s o f p o l y ( e t h y l e n e o x i d e ) c o -poly(propylene oxide) could be used to develop topical formulations. When it contains 70:30 poly(ethylene oxide) (PEO) and poly(propylene oxide) (PPO), respectively, it is commercially called Poloxamer 407. This designation
comes with the two irst digits (40) multiplied by 100,
which represent the variation in the molar weight portion of PEO and the third digit (7) when multiplied by 10, represents the percentage of the same block in the copolymer. Thus, Poloxamer 407 is composed of 70% of PEO and consequently 30% of PPO. Since the copolymer presents portions with different polarities it could be
classiied as a surfactant, and, for this reason, the hydrogel
formed is suitable to vehiculate lipophilic molecules, such
as EB (Devi, Sandhya, Hari, 2013; Almeida et al., 2012;
Dumortier et al., 2006; Alexandridis, Hatton, 1995).
In this respect, the objective of this study was to develop and to validate a methodology to quantify EB in repellent formulations. The repellent formulation developed in this work aims to better assist the patients
of the University Pharmacy of UFRJ, namely pregnant women and children. Due to its low toxicity, EB is recommended for these specific patients. On the other hand, DEET has been avoided since it presents a strong odor and a potential toxicity. High-performance liquid chromatography (HPLC) with UV-vis detection was used to quantify EB in the Poloxamer 407 gel formulation containing 12.5 and 25% of the repellent.
MATERIAL AND METHODS
Material
EB was purchased from Merck (Germany); the preservative used in the formulations was a mixture of methylisothiazolinone and phenoxyethanol purchased from IPEL (Brazil) and acetonitrile HPLC grade was purchased from Tedia (Brazil). For the gel preparation, Poloxamer 407 was purchased from Sigma-Aldrich (USA).
Equipment
HPLC equipment used was a Gilson with a 321 model pump, a 152 model ultraviolet-visible detector, a 7725i model injector (Shimadzu, Canby, OR, USA) with
a 50 μL loop, a 506C model system interface module, and
a Gilson Unipoint 3.0 software system controller (Gilson, Bedfordshire, UK). A Kromasil reverse-phase column (C18) was used with the dimensions of 250 x 4.6 mm and 5 µm particle size; ultrasound machine Thornton, T14 model; analytical balance Bioprecisa, FA2104N model and spectrophotometer UV / VIS Jasco V-630 model.
Determination of the maximum absorbance wavelength
Firstly, a wavelength scan from 190 to 800 nm was performed to determine the maximal absorption
wavelength of EB (λmáx) using a UV-vis V-630 (Jasco)
spectrophotometer. A methanol solution of EB in the
concentration of 300 µg.mL-1 was prepared for the
analysis.
Analysis by HPLC
flow rate of 1 mL.min-1 at a temperature of 40 °C. The retention time was 6.3 minutes and EB was detected at the wavelength of 218 nm.
Validation of the analytical method
The parameters used for the validation followed the recommendations of the ICH (1996) (International Council on Harmonization of Technical Requirements for Registration of Pharmaceuticals for Human Use) and RDC 899 (2003). According to the ICH (1996) guidelines and RDC 899 (ANVISA, 2003), the following parameters should be assessed: specificity, linearity, interval, precision, intermediate precision (inter-day precision), accuracy and robustness. Limits of quantification and detection were also assessed.
Specificity and selectivity
These parameters have the ability to be evaluated if the substances analyzed could be detected in a complex mixture, such as the components of a formulation. If the selectivity is not assured, linearity, precision and accuracy will be compromised. Selectivity was assessed by injections of acetonitrile and injections of the placebo (the formulation that was developed but without EB).
Linearity
Such a parameter is related to the ability of an analytical method to produce results which are directly proportional to the concentration of the drug in the samples in a determined range of concentration. In order to check the linearity, three analytical curves (n=3 analytical curves) with five different concentrations
were determined. A stock solution containing 1 mg.ml-1
of EB was prepared with acetonitrile and water in the ratio of 1:1. Then five solutions were prepared in the concentrations of 2.5, 5.0, 10.0, 12.5, 15.0 and 20.0
µg.mL-1. The coefficients of determination (R2) were
obtained. The linearity results were analyzed by the test
one-way ANOVA with post test Tukey and signiicance level of α=0.05 (95% of confidence interval). The
analysis of variance (ANOVA) allowed evaluating the linearity of the method and the validity of the linear regression. Residue analysis and normal distribution were made for evaluation of the homoscedasticity and normality, respectively.
Intra-assay precision (repeatability) and inter-assay accuracy (intermediate precision)
A measurement is precise if it obtains similar results with repeated measurements. For the analysis of
intra-assay precision (intra-day) a triplicate of the analytical
curve was assessed and the midpoint (10 mg L-1) was
evaluated 6 times (n= 6 determinations) on the same day. The inter-assay precision was performed on two following days using the same equipment. To analyze the inter-assay precision, a triplicate of the analytical curve
was assessed and the midpoint (10 mg L-1) was evaluated
6 times (n= 6 determinations) in the two days generating twelve replicates (n= 12 determinations). The accuracy assessment was performed by the relative standard deviation value (RSD) (Equation 1)
(1)
where RSD is the relative standard deviation, SD is the standard deviation. The intra-assay (repeatability) and inter-assay (intermediate precision) should not exceed 5%. These analyses were performed according to the ICH “Validation of Analytical Procedures” guidelines (ICH, 1996).
Robustness
To be robust, an analytical method should show reliability with respect to deliberate variations in method parameters. Thus, a solution of EB in the concentration of
10 mg.L-1 was evaluated in sextuplicate being submitted to
diferent conditions. Flow, temperature and composition of
the mobile were varied. The method is considered robust when changes are within the limits of acceptable precision and accuracy: precision expressed in RSD should be less than 5%, and accuracy should remain in the range of ± 5%. The robustness results were analyzed by the test one-way
ANOVA with post test Tukey and signiicance level of α=0.05 (95% of conidence interval).
Detection and quantification limits
The detection limit (DL) is the lowest amount of analyte that could be detected in the sample. The
quantiication limit (QL) is the lowest amount of analyte
in the sample, which could be determined by precision and accuracy (Equations 2 and 3) using the data from the three curves obtained in the linearity analysis.
(2)
where SD is the standard deviation of the y intercept of three curves and S is the mean of the slope of the three curves.
Accuracy based on the analyte recovery from a contaminated placebo
Three amounts of EB (40, 50 and 60 mg) corresponding to 80, 100 and 120% of the analyte were added to the vehicle (Poloxamer 407 gel with preservative), described in Table I. The mobile phase was used to extract EB. An analytical curve was set in order to assess the concentration of the EB extracted from the contaminated placebo. Accuracy was assessed according to Equation 4,
(4)
where AR% is the accuracy based on the analyte recovery from the developed formulation (contaminated placebo), AC is the average concentration obtained and TC is the theoretical concentration. This study was performed in triplicate (n= 3 determinations). Accuracy of the analyte should be within the range of 98-102%.
Formulation development
Our research group has developed two formulations based on Poloxamer 407 gel, containing 12.5% and 25% of EB to be used by children and adults, respectively. Table I shows the composition of the developed formulations. Firstly, Poloxamer 407 was previously dispersed in cold water at 5°C. At low temperatures, water is a good solvent for poly(propylene oxide) and poly(ethylene oxide) (Pinto
et al., 2017). The dispersion was manually mixed and refrigerated for 24 h for complete dispersion, hydration, and dissolution of Poloxamer 407. The preservative was added to the gel with 30 % of Poloxamer 407.
The gel formulations containing 12.5% and 25% of EB were prepared by adding EB in the Poloxamer 407 gel (containing the preservative) under continuous stirring with ultra-turrax (at 6,000 RPM) for 10 minutes. During the processing, the temperature was kept at 5°C by ice bath and the total amount obtained for each formulation was 10 g. After being prepared, all formulations were stored at 25°C.
EB quantification in the formulations
After the method validation EB concentration was determined in both formulations. Six solutions of
10 µg.mL-1 were prepared for each formulation and an
analytical curve was also obtained in order to assess the amount of EB extracted from the gel formulations.
Statistical analysis
The experimental results were expressed as mean ± standard deviation (SD) or relative standard deviation (RSD) using Origin Pro 8 (OriginLab, USA) software
and P value<0.05 was considered statistically signiicant.
RESULTS AND DISCUSSION
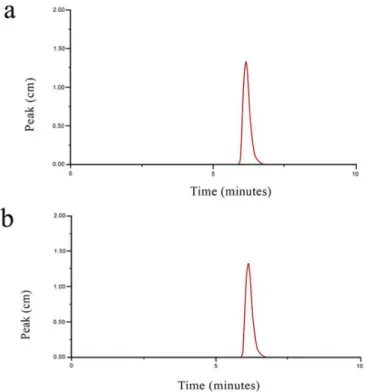
Selectivity and specificity were analyzed by injecting of acetonitrile (constituent of the mobile phase), gel without EB, EB standard solution in the concentration
10 µg.mL-1 using the mobile phase (Figure 1A) and EB in
the concentration of 10 µg.mL-1 obtained after dilution of
the gel containing 25% of EB in mobile phase (Figure 1B). In Figures 1A and 1B, EB presented the same retention time of 6.5 minutes, with a peak area corresponding to the
concentration of 10 µg.mL-1, indicating no interference
with the mobile phase. There were no peaks of interfering materials from the mobile phase and the gel, showing that the developed method is selective.
The three analytical curves showed R2 close to
1, which indicates excellent linearity (Figure 2A). The analysis of variance (ANOVA) allowed evaluating the linearity of the method and the validity of the regression (Table II). The peak area was divided by the corresponding concentration, and then the values obtained were analyzed by the test one-way ANOVA
with post test Tukey using a signiicant level of α=0.05 (95% of conidence interval). As shown in Table II, the
value obtained for the F(calculated) is lower than the F(tabulated),
indicating no signiicant diference between the values
obtained (peak area/corresponding concentration) from the calibration curves.
Furthermore, it was observed that the diferences
between the slopes of the analytical curves were not
TABLE I - Composition of the developed formulation
Ingredient Concentration (%)
EB 12.5 or 25
Phenoxyethanol/Methylisothiazolinone (preservative)
0.1
Poloxamer 407 30
Water Qsa) 100
signiicant (p>0.05). The value of F(calculated) (0.649) is lower than the F(tabulated) (3.89), indicating no signiicant diference between the slopes of the three analytical curves.
The residue analysis is showed in the Figure 2B. The residue analysis exhibited a random pattern, thus, the
homoscedasticity assumption is satisied indicating a good it for the linear model. The Figure 2C exhibits the normal
distribution. The graph is a straight line (Figure 2C), thus,
the normality assumption is satisied. Homoscedasticity
and normality indicated satisfactory adjustment of the linear model.
The detection limit (LD) and the quantiication limit (LQ) were calculated from the three analytical curves
which are shown in Table III. The values were 0.255 and
0.849 mg L-1, respectively.
FIGURE 1 - a) Chromatogram showing the peak related to EB in a standard solution of 10 µg.mL-1 in mobile phase; b) Chromatogram showing the peak related to EB in the concentration of 10 µg.mL-1 (also prepared with the mobile phase) for the gel formulation containing 25% of EB. No interfering materials were detected.
TABLE II - Analysis of variance (ANOVA) for linearity
Source of variation DF SS MS F calculated P-value* F tabulated
Between groups 2 5081 2540
0.633 0.5293 3.68
Within groups 15 57450 3830
Total 17 62530
DF-degrees of freedom; SS-Sum of squares; MS-Mean square; * p>0.05
For the correct analysis of an analyte the method must be precise, providing lower differences among data results for the same concentration. Results obtained for the intra-assay precision (repeatability) and for the inter-assay accuracy (intermediate precision) were excellent since, in both, RSD was lower than 5.0% (Table III) as recommended by ICH (1996) “Validation of Analytical Procedures” guidelines (ICH, 1996). Thus, the chromatographic method presented precision.
For the correct analysis of an analyte the method must be accurate, there must be a correlation between the concentration value obtained and the real or accepted concentration value. The results of the intra-assay and inter-assay accuracy were also lower 5.0% (Table III). Thus, the chromatographic method presented accuracy.
Robustness results are presented in Table IV. Precision expressed in RSD should be less than 5%, and accuracy should remain in the range of ± 5%. We provide a statistical analysis to the robustness results. The robustness results, 4 columns with 6 determinations for each column,
were analyzed by the test one-way ANOVA with post
test Tukey using the signiicance level of α=0.05 (95% of conidence interval). As shown in Table V, the value for
F(calculated) is lower than the F(tabulated), indicating no signiicant
diference between the robustness values. Changes in low,
temperature or mobile phase composition were within the range of variation of the precision and accuracy. Thus, the chromatographic method presented robustness.
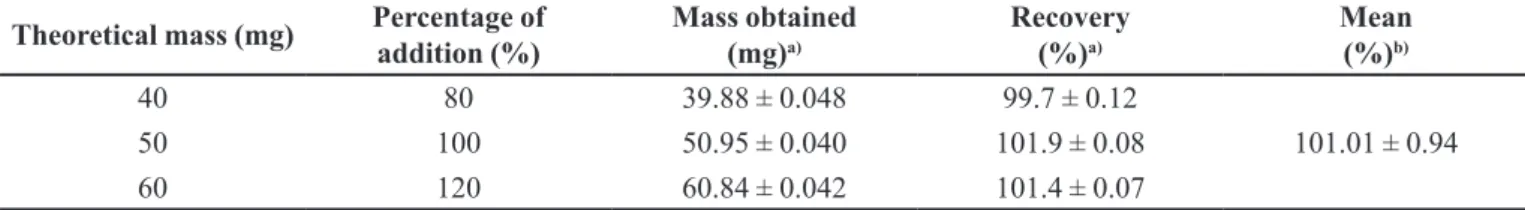
Accuracy based on studies of analyte recovery from the contaminated placebo was made by adding three
diferent percentages of EB in the vehicle. The average
recovery ranged from 99.7 to 101.9% (Table VI). In addition, the recovery of EB from the developed gel formulations was successfully performed and this method showed to be exact and suitable for the repellent quantification in the new formulations. Table VII shows EB was recovered from the gel formulations in a percentage of 103.04% (gel with 12.5% of EB) and 100.30% (gel with 25% of EB). The values were in agreement with the percentage limits from 80 to 120%
TABLE III - Results of the validation parameters: precision, accuracy, detection limit and quantiication limit
Validation Parameters Results
Precision intra-assay (Repeatability) (n=6 determinations) RSD= 2.3%
Theoretical concentration (µg.mL-1) Concentration obtained (µg.mL-1) Accuracy intra-assay (n = 6 determinations)
10 10.45 4.5%
Precision inter-assay (n=12 determinations) RSD= 2.5%
Theoretical concentration (µg.mL-1) Concentration obtained (µg.mL-1) Accuracy inter-assay (n = 12 determinations)
10 10.46 4.6%
DL (µg.mL-1) 0.281
QL (µg.mL-1) 0.849
RSD= Relative Standard Deviation; DL= Detection Limit; QL= Quantiication limit
TABLE IV - Robustness results
Parameter
Theoretical concentration (µg.
mL-1)
Concentration obtained (µg.mL-1)b
Accuracy (%)b Precisionb
Flux (mL.min-1) 0.9 10 9.72 -2.83 4.31
Flux (mL.min-1) 1.1 10 10.06 0.61 0.79
Temperature (˚C) 40˚C 10 9.74 -2.61 3.23
Mobile phase 40:60 (Water:ACNa) 10 10.21 2.12 2.51
Mean ± SDc 9.93±0.36
RSD (%)c 3.67
a ACN= Acetonitrile; b Mean of 6 determinations; c Mean and RDS of 24 determinations; SD-Standard deviation; RSD-Relative
of the analyte recovery in pharmaceutical formulations (ICH, 1996).
CONCLUSION
The methodology was successfully validated and applied to insect repellent gel. The chromatographic method presented optimal selectivity, linearity higher
than 0.99, detection and quantiication limits lower than
1 µg.mL-1, relative standard deviation lower than 5% for
precision, and recovery higher than 90%. Thus, the method
was suitable for the quantiication of EB in the two insect
repellent gels developed in this work.
ACKNOWLEDGEMENTS
We would like to thank the National Scientiic and Technological Research Council (CNPQ) and the Rio de
Janeiro State Research Foundation (FAPERJ) for funding.
The authors have declared no conlict of interest.
REFERENCES
AGÊNCIA NACIONAL DE VIGILÂNCIA SANITÁRIA. ANVISA. RDC 899. Resolução Diretoria Colegiada 899. RE nº 899, de 29/05/2003. Guia para validação de métodos analíticos e bioanalíticos. Brasília: Ministério da Saúde, 2003.
A L E X A N D R I D I S, P.; H AT TO N, T.A. Poly(ethylene oxide)-poly(propylene oxide)-poly (ethylene oxide) block copolymer surfactants in aqueous solutions and at interfaces: thermodynamics, structure, dynamics, and modeling. Coll. Surf. A: Physicochem. Eng. Aspects. v.96, n.1-2, p.1-46, 1995.
ALMEIDA, H.; AMARAL, M.H.; LOBÃO, P.; LOBO, J.M.S. Pluronic(R) F-127 and Pluronic Lecithin Organogel (PLO): main features and their applications in topical and transdermal administration of drugs. J. Pharm. Pharm. Sci., v.15, n.4, p.592-605, 2012.
TABLE V - Analysis of variance (ANOVA) for Robustness
Source of variation DF SS MS F calculated P-value* F tabulated
Between groups 3 0.7688 0.2563
2.12 0.1300 3.10
Within groups 20 2.421 0.1210
Total 23 3.190
DF-degrees of freedom; SS-Sum of squares; MS-Mean square; * p>0.05
TABLE VI - Recovery results
Theoretical mass (mg) Percentage of addition (%)
Mass obtained (mg)a)
Recovery (%)a)
Mean (%)b)
40 80 39.88 ± 0.048 99.7 ± 0.12
101.01 ± 0.94
50 100 50.95 ± 0.040 101.9 ± 0.08
60 120 60.84 ± 0.042 101.4 ± 0.07
a) Mean ± SD of 6 determinations;b) Mean ± SD of 3 determinations.
TABLE VII - Content of EB (%) in the formulations
Formulation Content of EB in the Gel (%)a) Content (%)b)
Gel containing 12.5% of EB 12.88 ± 0.28 103.04 %
Gel containing 25% of EB 25.08 ± 0.53 100.32 %
CAMPOS, D. GRAVATO, C.; QUINTANEIRO, C.; KOBA,
O.; RANDAK, T.; SOARES, A.M.; PESTANA, J.L. Are insect repellents toxic to freshwater insects? A case study
using caddislies exposed to DEET. Chemosphere, v.149,
p.177-182, 2016.
C H AT TO PA D H YAY, P.; D H I M A N, S.; B O R A H, S.; RABHA, B.; CHAURASIA, A.K.; Veer, V. Essential oil based polymeric patch development and evaluating its repellent activity against mosquitoes. Acta Tropica, v.147, p.45-53, 2015.
DEVI, D.R.; SANDHYA, P.; HARI, B.N.V. Poloxamer: A novel functional molecule for drug delivery and gene therapy. J. Pharm. Sci. Res., v.8, n.5, p.159-165, 2013.
DIAZ, J.H. Chemical and plant-based insect repellents: eicacy,
safety, and toxicity. Wilderness Environm. Med., v.27, n.1, p.153-165, 2016.
D U M O RT I E R , G . ; G R O S S I O R D , J . L . ; A G N E LY, F.; C H A U M E I L, J.C. A review of poloxamer 407 pharmaceutical and pharmacological characteristics.
Pharm. Res., v.23, n.12, p.2709-28, 2006.
F R E D E R I K S E N , K .; G U Y, R . H .; P E T E R S S O N , K. Formulation considerations in the design of topical,
polymeric ilm-forming systems for sustained drug delivery
to the skin. Eur. J. Pharm. Biopharm., v.91, p.9-15, 2015.
G O O R H U I S , A .; V O N E I J E , K . J .; D O U M A , R . A .; R I J N B E R G , N .; VA N V U G T, M .; S T I J N I S , C .; GROBUSCH, M.P. Zika virus and the risk of imported infection in returned travelers: Implications for clinical care.
Travel Med. Infect. Dis., v.14, n.1, p.13-15, 2016.
INTERNATIONAL CONFERENCE ON HARMONISATION. ICH. International Council on Harmonization of Technical Requirements for Registration of Pharmaceuticals for Human Use. Guidance for industry: Q2B validation of analytical procedures: methodology. Geneva: ICH, 1996.
KATZ, T.M.; MILLER, J.H.; HEBERT, A.A. Insect repellents: historical perspectives and new developments. J. Am. Acad. Dermatol., v.58, n.5, p.865-71, 2008.
MARCUS, J.; MÜLLER, M.; NISTLER, J.; TOURAUD, D.; KUNZ, W. Nano-droplet formation in water/ethanol or isopropanol/mosquito repellent formulations. Coll. Surf. A: Physicochem. Eng. Aspects., v.458, p.3-9, 2014.
MOULIN, E.; SELBY, K.; CHERPILLOD, P.; KAISER, L.; BOILLAT-BLANCO, N. Simultaneous outbreaks of Dengue, Chikungunya and Zika virus infections: diagnosis
challenge in the returning traveler with non-speciic febrile
illness. New Microbes New Infect., v.11, p.6-7, 2016.
PETERSEN, E.; WILSON, M.E.; TOUCH, S.; MCCLOSKEY, B.; MWABA, P.; BATES, M.; DAR, O.; MATTES, F.; KIDD, M.; IPPOLITO, G.; AZHAR, E.; ZUMLA, A. Unexpected and rapid spread of Zika virus in the Americas - implications for public health preparedness for mass gatherings at the 2016 Brazil Olympic Games. Int. J. Infect. Dis., v.44, p.11-15, 2016.
PINTO, I.C.; CERQUEIRA-COUTINHO, C.; SANTOS,
E.P.; CARMO, F.A.; RICCI-JUNIOR, E. Development and characterization of repellent formulations based on nanostructured hydrogels. Drug Dev. Ind. Pharm., v.43, n.1, p.67-73, 2017.
R E E G A N, A.D.; K A N N A N, R.V.; PA U L R A J, M.G.; IGNACIMUTHU, S. Synergistic efects of oil-based cream formulations against Culex quinquefasciatus Say and Aedes aegypti L. (Diptera: Culicidae). J. Asia-Paciic Entomol., v.17, n.3, p.327-331, 2014.
TISGRATOG, R.; SANGUANPONG, U.; GRIECO, J.P.; NGOEN-KLUAN, R.; CHAREONVIRIYAPHAP, T. Plants traditionally used as mosquito repellents and the implication for their use in vector control. Acta Trop., v.157, p.136-144, 2015.
WANG, T.; MILLERB, D.; BURCZYNSKIA, F.; GUA, X. Evaluation of percutaneous permeation of repellent DEET and sunscreen oxybenzone from emulsion-based
formulations in artiicial membrane and human skin. Acta. Pharm. Sinica B, v.4, n.1, p.43-51, 2014.
W I L L E, T.; T H I E R M A N N, H.; W O R E K, F. In vitro kinetic interactions of DEET, pyridostigmine and organophosphorus pesticides with human cholinesterases.
Chem-Biol. Interactions.,v.190, n.2-3, p.79-83, 2011.
W O R L D H E A LT H O R G A N I Z AT I O N . W H O . W H O
speciications and evaluations for public health pesticides:
ethyl butylacetylaminopropionate., Switzerland: WHO, 2006. 25p.