Printed in Brazil - ©2007 Sociedade Brasileira de Química 0103 - 5053 $6.00+0.00
A
r
t
ic
le
A
r
t
ic
le
A
r
t
ic
le
A
r
t
ic
le
A
r
t
ic
le
*e-mail: [email protected]
Fe(III) Hepthyldithocarbamate as a New Collector for Flotation Separation and
Preconcentration of Cr, Cu, and Pb from Fresh Waters before their
Determination by ETAAS
Katarina
j
undeva,* Gorica Pavlovska and Traj
e Stafilov
Institute of Chemistry, Faculty of Science, Sts. Cyril and Methodius University, P.O. Box 162, MK-1001 Skopje, Republic of Macedonia
Desenvolveu-se um método para determinação de Cr, Cu e Pb em água após separação por flotação e pré-concentração usando-se espectrometria de absorção atômica com atomização eletrotérmica (ETAAS). A possibilidade da aplicação de heptilditiocarbamato de ferro(III),
Fe(HpDTC)3, como coletor foi estudada. Os parâmetros experimentais que influenciam a
eficiência da flotação do coletor foram otimizados. Constatou-se que Cr(III), Cr(VI), Cu(II) e
Pb(II) podem ser separados simultaneamente pela adição de 20 mg de Fe(III) e 6 mL de HpDTC–
0,1 mol L-1 a 1 L de uma amostra teste, em pH 6,5. O fator de preconcentração do método é 40.
A aplicabilidade do novo procedimento proposto foi verificada pelo método de adições padrão e por espectrometria de emissão óptica com plasma indutivamente acoplado (ICP OES) como um método comparativo independente. O limite de detecção para Cu pelo método de flotação/
ETAAS é 0,015 µg L-1, 0,011 µg L-1 para Cr e 0,025 µg L-1 para Pb. Determinou-se que para
concentrações baixas (de 0,025 a 0,2 µg L-1), o RSD para Cu é 1,5%; para Cr, 4,2% e para Pb é
7,8%; enquanto que para níveis de concentração mais altos (de 0,2 a 4,5 µg L-1), RSD para Cu
é 1,7%, para Cr 2,8% e para Pb é 3,7%.
A method for determination of Cr, Cu and Pb in fresh waters, after flotation separation and preconcentration step, by using electrothermal atomic absorption spectrometry (ETAAS) is
presented. The possibility of applying iron(III) hepthyldithiocarbamate, Fe(HpDTC)3, as a collector
is studied. The experimental parameters affecting the flotation efficiency by a new collector were optimized. It is ascertained that Cr(III), Cr(VI), Cu(II) and Pb(II) can be separated simultaneously
from matrix by addition of 20 mg Fe(III) and 6 mL 0.1 mol L-1 HpDTC- to a test sample of 1 L at
pH 6.5. The preconcentration factor of the method is 40. The applicability of the new proposed procedure was verified by the method of standard additions and by inductively coupled plasma optical emission spectrometry (ICP OES), as an independent comparative method. The limit of
detection for Cu by flotation/ETAAS method is 0.015 µg L-1, for Cr is 0.011 µg L-1, and for Pb
0.025µg L-1. It was found that for low concentrations (from 0.025-0.2 µg L-1) RSD for Cu is 1.5%,
for Cr 4.2% and for Pb is 7.8%, while for the higher concentration level (from 0.2-4.5 µg L-1) RSD
for Cu is 1.7%, for Cr 2.8% and for Pb is 3.7%.
Keywords: water, chromium, copper, lead, flotation, ETAAS
Introduction
Lakes, rivers, streams and others natural fresh aquatic systems are very important for the life on our planet. Unfortunately, these water supplies often suffer contamination due to uncontrolled discharges from industrial chemical production, runoff from agricultural land
etc.1-3 Cr(VI), Cr(III), Cu(II) and Pb(II) are species of particular concern because of their toxicities for living
mechanisms for toxicity involve fundamental biochemical processes. All these effects cause many disturbances and serious unbalances in human, animal and plants organisms. For this reason it is necessary to monitor species as Cr(III), Cr(VI), Cu(II) and Pb(II) in environmental aquatic systems. Commonly the determination of traces of chromium, copper and lead in waters is performed by analytical methods with very low detection limits as atomic absorption spectrometry (AAS). However, in case of extremely low concentrations, a previous preconcentration step is unavoidable.10,11 Among accurate, fast and inexpensive preconcentration methods, that can be applied for heavy metal preconcentration before AAS is the bubble technique named flotation. This separation method is a well known procedure for enrichment raw mineral material before industrial processing in the smelting plants. However, this technique may apply for analytical purposes to separate and preconcentrate heavy metals in traces from water matrices before instrumental methods.
As an analytical separation method the flotation has shown as very advantageous and helpful due to its rapidity and excellent recoveries of analytes.12-31 Many factors influence to perform a proper flotation, but an important role has the collector with its colloid nature.10-12 In our earlier work lead(II) hepthyldithiocarbamate, Pb(HpDTC)2, and cobalt(III) hepthyldithiocarbamate, Co(HpDTC)3, were used as collectors for copper and cadmium preconcentration.27,28 The idea of this study is to apply iron(III) hepthyl-dithiocarbamate, Fe(HpDTC)3, for flotation separation of chromium, copper and lead traces from water samples prior to ETAAS determination. One of the most important advantage of using Fe(HpDTC)3 instead Co(HpDTC)3 and Pb(HpDTC)2 is the possibility of chromium determination. All our previous attempts with different metal dithio-carbamates as collectors for Cr(III) and Cr(VI) flotation
preconcentration and separation were unsuccessful, except in the case when iron was used as a constituent of the collector.30,32,33 The results of flotation/ETAAS analyses would be compared with those obtained by inductively coupled plasma optical emission spectrometry (ICP OES).
Experimental
Instrumentation
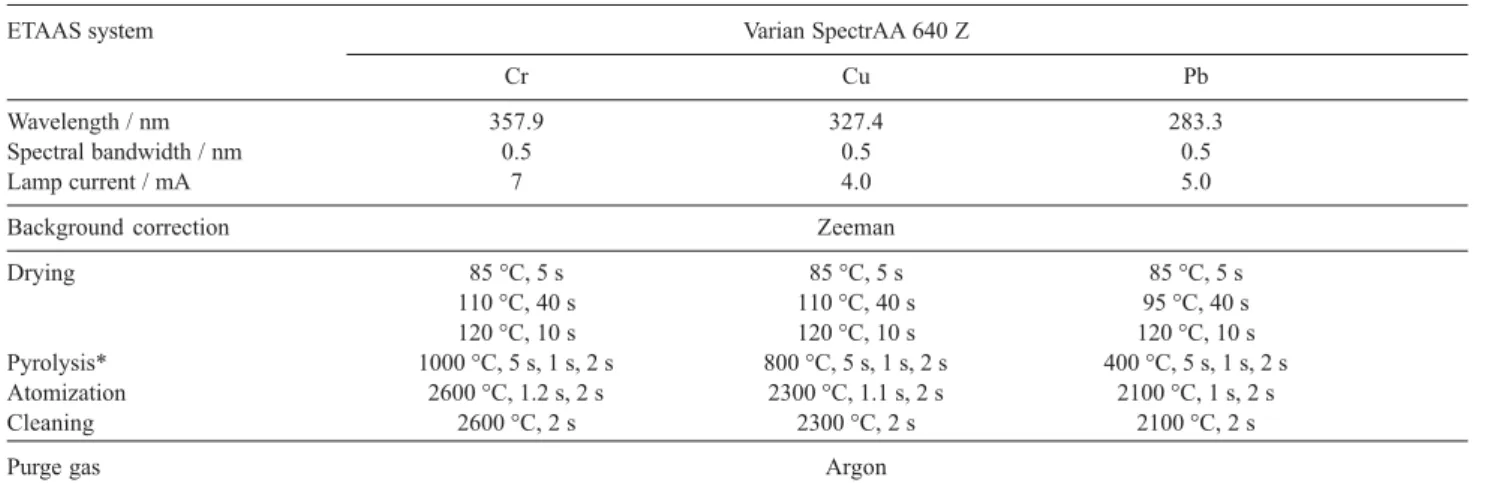
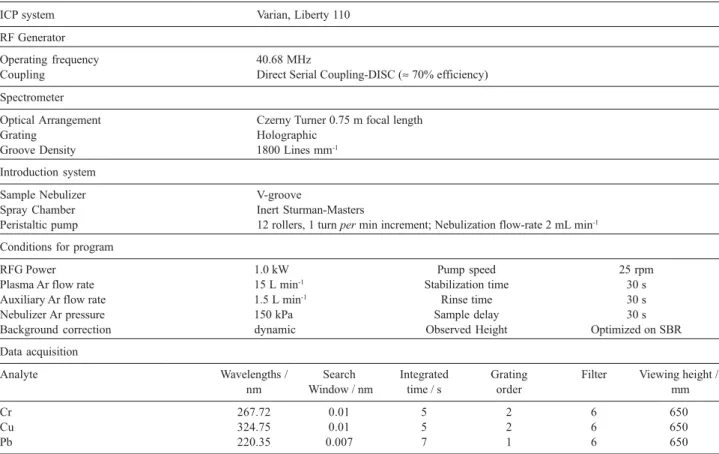
Varian SpectrAA 640Z was used for AAS measure-ments of Cr, Cu and Pb (Table 1). High purity argon was used as a purge gas. The same gas was used for ICP OES measurements by Varian Liberty 110 (Table 2). All pH readings were carried out with Iskra pH-Meter MA 5705. The flotation cell was a glass cylinder (4 × 105 cm) with
a sintered glass disc (porosity No. 4) at the bottom to produce the air bubble stream. The figure of this device is presented in our previously published paper.19
Materials and methods
Deionized redistilled water was used throughout. All chemicals used were of the highest grade available except for surfactants sodium dodecylsulfate (NaDDS), sodium oleate (NaOL), sodium palmitate (NaPL), sodium stearate (NaST), benzethonium chloride (BTC) and cetyltrimethylammonium bromide (CTAB). To prepare a 50 mg mL-1 stock solution of Fe(NO
3)3 an appropriate amount of powdered iron (Merck) was dissolved in concentrated HNO3. Nitrates of Cr(III), Cu(II) and Pb(II) (Merck) were used for preparation of analytes stock solutions (1 mg mL-1). A stock solution of Cr(VI) as 1 mg mL-1 was prepared using K
2CrO4 (Merck). Intermediate standard solutions were suitably
Table 1. Optimal parameters for AAS determination
ETAAS system Varian SpectrAA 640 Z
Cr Cu Pb
Wavelength / nm 357.9 327.4 283.3
Spectral bandwidth / nm 0.5 0.5 0.5
Lamp current / mA 7 4.0 5.0
Background correction Zeeman
Drying 85 °C, 5 s 85 °C, 5 s 85 °C, 5 s
110 °C, 40 s 110 °C, 40 s 95 °C, 40 s
120 °C, 10 s 120 °C, 10 s 120 °C, 10 s
Pyrolysis* 1000 °C, 5 s, 1 s, 2 s 800 °C, 5 s, 1 s, 2 s 400 °C, 5 s, 1 s, 2 s
Atomization 2600 °C, 1.2 s, 2 s 2300 °C, 1.1 s, 2 s 2100 °C, 1 s, 2 s
Cleaning 2600 °C, 2 s 2300 °C, 2 s 2100 °C, 2 s
Purge gas Argon
1209 jundevaet al.
Vol. 18, No. 6, 2007
diluted daily. Sodium hepthyldithiocarbamate, NaHpDTC, was home-synthesized in according the procedure described below. The 0.1 mol L-1 solution of hepthyldithiocarbamate anions, HpDTC–, was prepared daily by dissolving appropriate amount of crystalline NaHpDTC in 96% (v/v) ethanol. The solutions of surfactants were made as 0.5% (m/v) in 95% (v/v) ethanol (NaDDS, NaOL, BTC, CTAB), as well as in 99.7% (v/v) propan-2-ol (NaPL, NaST). The pH was regulated by KOH (2.5% (m/v) and 10% (m/v)) and HNO3 (0.1 mol L-1). Ionic strength (I
c) was adjusted with saturated solution of KNO3. To wash the glass electrode after coprecipitation, as well as to transfer the content of the beaker into the flotation cell a 0.1 mol L-1 NH
4NO3 solution was used.
Synthesis of NaHpDTC
Into 0.1 mol of heptylamine (Merck), 6 g of NaOH (0.15 mol) dissolved in minimal volume of ethanol was introduced. Under continuous stirring 7 mL freshly distilled CS2 (0.11 mol) was introduced drop by drop into the reaction mixture. A yellowish gel was obtained. It was left to sty in a beaker. After 1-2 days light-yellow crystals was formed. They were purified by dissolving
in a minimal amount of acetone or ethanol. The recrystallization was initiated by addition of ether. The pure white crystals were filtered through Büchner funnel and were kept in a hermetically closed glass pot.
Flotation procedure
A suitable ionic strength of the medium was adjusted by addition of 6 mL saturated solution of KNO3 into a sample of acidified water (1 L) in a beaker. After that 20 mg of Fe(III) as nitrate solution were added. By adding KOH solutions (at the beginning by 10% (m/v) and at the end by 2.5% (m/v)) the pH was adjusted to 6.5. A red-brown precipitate of hydrated iron(III) oxide, Fe2O3.xH2O was obtained. It was stirred for 5 min. Then 6 mL 0.1 mol L-1 solution of HpDTC– was introduced. Under continuous stirring Fe(III) reacts with HpDTC– and a black precipitate of Fe(HpDTC)3 was formed. After 5 min of the stirring 1 mL solution of NaDDS was added and the content of the beaker was transferred quantitatively into the flotation cell with aid of small portions of 0.1 mol L-1 NH
4NO3 solution. The separation of the solid phase from water phase was carried out by a stream of air bubbles (50 mL min-1), effluxing from the perforated bottom of the cell for 1 min. The bubbles
Table 2. Instrumentals parameters for ICP OES determination of heavy metals
ICP system Varian, Liberty 110
RF Generator
Operating frequency 40.68 MHz
Coupling Direct Serial Coupling-DISC (≈ 70% efficiency)
Spectrometer
Optical Arrangement Czerny Turner 0.75 m focal length
Grating Holographic
Groove Density 1800 Lines mm-1
Introduction system
Sample Nebulizer V-groove
Spray Chamber Inert Sturman-Masters
Peristaltic pump 12 rollers, 1 turn per min increment; Nebulization flow-rate 2 mL min-1
Conditions for program
RFG Power 1.0 kW Pump speed 25 rpm
Plasma Ar flow rate 15 L min-1 Stabilization time 30 s
Auxiliary Ar flow rate 1.5 L min-1 Rinse time 30 s
Nebulizer Ar pressure 150 kPa Sample delay 30 s
Background correction dynamic Observed Height Optimized on SBR
Data acquisition
Analyte Wavelengths / Search Integrated Grating Filter Viewing height /
nm Window / nm time / s order mm
Cr 267.72 0.01 5 2 6 650
Cu 324.75 0.01 5 2 6 650
raised the precipitate flakes of the system to the water surface. The glass pipette-tube was immersed into the cell through the froth layer on the top of water column and the liquid phase was sucked off. Solid phase left in the cell was decomposed by 2.5 mL hot concentrated HNO3. The yellow solution was drawn out by vacuum through the bottom of the cell into a 25 mL volumetric flask. The flask was filled up with 4 mol L-1 HNO
3 and the sample was ready for AAS.
Results and Discussion
Optimization of pH
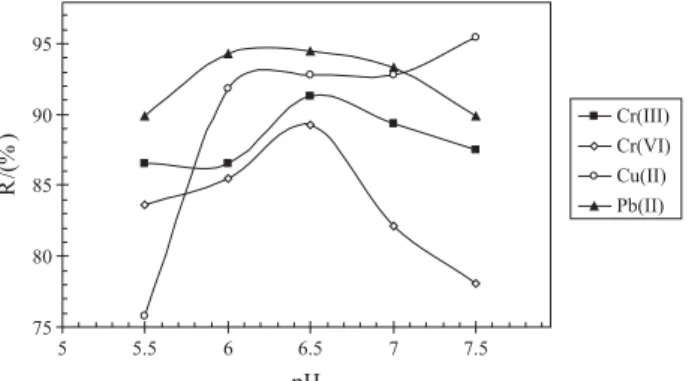
To optimize this important parameter series of model solutions (1 L), containing 25 µg of each analyte, were
floated within a pH range of 5.0 to 7.5. The mass of Fe (10 mg), amount of HpDTC– (0.3 mmol), ionic strength (Ic = 0.02 mol L-1) and volume of NaDDS solution (1 mL) were kept constant. The R/pH curves evidence the highest recoveries for Cr(III) (91.3%), Cr(VI) (89.3%), Cu(II) (92.8%) and Pb (94.3%) were reached at pH 6.5 (Figure 1). Therefore for simultaneously separation of analytes pH 6.5 was selected as the most appropriate for further investigations.
Effect of m(Fe) on analyte recoveries
To perform a proper flotation it is very important to get bulky precipitate able to collect on its surface or into its structure trace analytes of the system. Since the mass of iron effect on the formation of Fe(HpDTC)3 precipitate the affect of m(Fe) on analyte recoveries was studied. Series of model solutions (1 L) containing 25 µg of each
analyte were floated. Mass of Fe varied from 2.5 to 100.0 mgper 1 L at constant pH (6.5) ionic strength (Ic = 0.02 mol L-1) and amount of HpDTC– (0.3 mmol L-1). The data shows that satisfactory recovery for all four species investigated can be reached using 20 mg Fe (Figure 2).
Effect of n(HpDTC-) on analyte recoveries
The model solutions were 1 L redistilled water samples spiked with 25 µg of each analyte. They were floated by
different amounts of HpDTC– (0.3-1.2 mmol) at constant pH (6.5) and Ic (0.02 mol L-1). Each solution contained 20 mg Fe. The experimental results depicted in Figure 3 shown that analyte recoveries increase with rising of
n(HpDTC–). The highest recoveries for all analytes were obtained if 0.6 mmol HpDTC- would be added to 1 L of test solution.
Choice of surfactant
To select the most suitable surface active substance series of flotations under previously optimized conditions (pH = 6.5, Ic = 0.02 mol L-1, 20 mg L-1 Fe, 0.6 mmol L-1 HpDTC–) were carried out. The results of Table 3 evidence that cationic surfactants can not perform flotation. This is the indication that the collector particles are positive charged and consequently can not made micelles with cationic surfactants. The anionic surfactants, having the
Figure 1. Effect of pH on analyte recoveries (10 mg Fe, 0.3 mmol HpDTC–).
75 80 85 90 95
5 5.5 6 6.5 7 7.5
pH
R/
(%
) Cr(III)Cr(VI)
Cu(II) Pb(II)
Figure 2. Effect of iron(III) mass on analyte flotation recoveries. (pH
6.5, 0.3 mmol HpDTC–). 30
40 50 60 70 80 90 100
0 10 20 30 40 50 60 70 80 90 100
(Fe)/(mg L-1)
R/
(%
) Cr(III)
Cr(VI) Cu(II) Pb(II)
Figure 3. Effect of n(HpDTC–) on analyte flotation recoveries (pH 6.5,
20 mg Fe). 80 85 90 95 100
0.20 0.40 0.60 0.80 1.00 1.20
n(HpDTC )/mmol
R/
(%
)
1211 jundevaet al.
Vol. 18, No. 6, 2007
opposite charge of Fe(HpDTC)3 particles, were more effective. The flotation recoveries of Cr(III), Cr(VI), Cu(II) and Pb(II) obtained by NaDDS were the highest, and so it was selected as the most appropriate for the procedure.
Influences of m(Fe) and the matrix elements on absorbance of analytes
At the beginning of the procedure, iron mass added into the reaction mixture is 20 mg per 1 L. However, after 40-fold flotation concentration Fe mass increases 40 times and some possible interference on analyte absorbances could be expected. According our previous data34 it was found that the interferences of Fe are present, when its concentration is higher than 2 mg mL-1. Because Fe concentration in final solution concentrated by flotation is 0.8 mg mL-1, it is impossible to expect any interference on the absorbance of the investigated elements.
The interferences resulting of macroelements (Ca, Mg) present in natural water samples after 40-fold flotation concentration were investigated previously.21,29
Our earlier studies have shown that during the flotation process the major interferent elements (Ca, Mg, Na, K) are not separated from the initial water sample, and the final 40-fold concentrated solutions testing by ETAAS are almost free of macroelements. Thus, the matrix interferences in 40-times concentrated samples are avoided.21,29
Reaction time
An important parameter for flotation procedure using a complexing agent as Fe(HpDTC)3 is the time necessary for complexing and incorporation of traces analytes in collector mass. Therefore, the reaction time for Cr, Cu and Pb flotation was investigated. It was found that the proper flotation consists of two processes: the first by Fe2O3.xH2O, and the second by Fe(HpDTC)3. For that purpose the time of stirring was changed from 3 to 15 min, while all other parameters optimized in the previous sections were kept constant. The first reaction time with Fe2O3.xH2O was selected to be 5 min, as well as that with Fe(HpDTC)3.
Table 3. Selection of surfactant for flotation of Cr(III), Cr(VI), Cu(II) and Pb(II); (pH = 6.5, Ic = 0.02 mol L-1, 20 mg L-1 Fe, 0.6 mmol L-1 HpDTC–)
Cationic surfactant Anionic surfactant
BCT CTAB NaDDS NaOL NaPL NaST
R / (%)
Cr(III) Foam, 95.6 87.7 65.4 92.4
Cr(VI) but there is 93.5 92.1 65.4 72.1
Cu(II) no flotation 94.4 91.1 92.6 67.6
Pb(II) 95.6 92.6 85.4 72.4
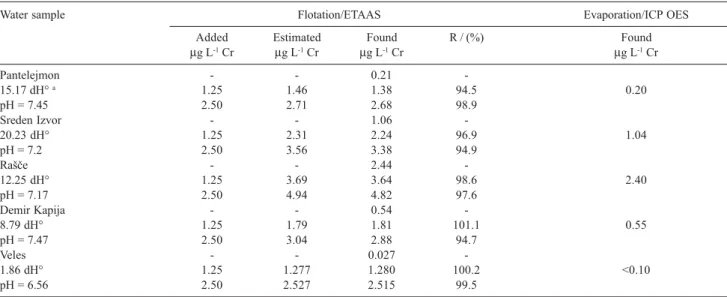
Table 4. ETAAS determinations of total chromium in natural water samples after flotation with Fe(HpDTC)3 verified by the method of standard additions
and ICP OES
Water sample Flotation/ETAAS Evaporation/ICP OES
Added Estimated Found R / (%) Found
µg L-1 Cr µg L-1 Cr µg L-1 Cr µg L-1 Cr
Pantelejmon - - 0.21
-15.17 dH° a 1.25 1.46 1.38 94.5 0.20
pH = 7.45 2.50 2.71 2.68 98.9
Sreden Izvor - - 1.06
-20.23 dH° 1.25 2.31 2.24 96.9 1.04
pH = 7.2 2.50 3.56 3.38 94.9
RaÎe - - 2.44
-12.25 dH° 1.25 3.69 3.64 98.6 2.40
pH = 7.17 2.50 4.94 4.82 97.6
Demir Kapija - - 0.54
-8.79 dH° 1.25 1.79 1.81 101.1 0.55
pH = 7.47 2.50 3.04 2.88 94.7
Veles - - 0.027
-1.86 dH° 1.25 1.277 1.280 100.2 <0.10
pH = 6.56 2.50 2.527 2.515 99.5
Table 5. ETAAS determinations of copper in natural water samples after flotation with Fe(HpDTC)3 verified by the method of standard additions and ICP OES
Water sample Flotation/ETAAS Evaporation/ICP OES
Added Estimated Found R / (%) Found
µg L-1 Cu µg L-1 Cu µg L-1 Cu µg L-1 Cu
Pantelejmon - - 2.84
-15.17 dHo a 1.25 4.09 3.94 96.3
-pH = 7.45 2.50 5.34 5.15 96.4
Sreden Izvor - - 0.43
-20.23 dHo 1.25 1.68 1.60 95.2 0.42
pH = 7.2 2.50 2.93 2.96 101.0
RaÎe - - 2.05
-12.25 dHo 1.25 3.30 3.24 98.2 2.07
pH = 7.17 2.50 4.55 4.38 96.3
Demir Kapija - - 2.49
-8.79 dHo 1.25 3.74 3.69 98.7 2.85
pH = 7.47 2.50 4.99 4.93 98.8
Veles - - 1.61
-1.86 dHo 1.25 2.86 2.87 100.3 1.64
pH = 6.56 2.50 4.11 3.91 95.1
adHo, German degree of water hardness. Limits of detection
To determine the limit of detections, LOD, of analytes, series of blanks (n = 10) were prepared and treated by the new developed flotation method. After that, analytes were determined by ETAAS and LOD of each element was estimated as three-fold of the standard deviation of the blank. LOD for Cu by flotation/ETAAS method is 0.015
µg L-1, for Cr is 0.011 µg L-1, and for Pb 0.025 µg L-1. The
precision of the method was expressed by means of the relative standard deviations, RSD. It was found that in the case of very low concentrations (from 0.025-0.2 µg L-1)
RSD for Cu is 1.5%, for Cr 4.2% and for Pb is 7.8%, while for the higher concentration level (from 0.2-4.5 g L-1) RSD for Cu is 1.7%, for Cr 2.8% and for Pb is 3.7%.
Verification of the method
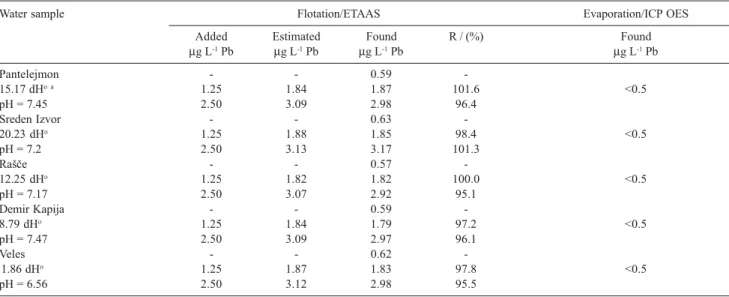
To confirm the new method of separation and preconcentration with Fe(HpDTC)3 a few samples of environmental waters were analyzed. The method of standard additions was applied. For this purpose, known amounts of chromium, copper and lead were added to 1 L aliquots of each water sample. After flotation 40-fold concentrated water samples were analyzed by ETAAS. The results are given in Tables 4-6. It is evident that the proposed flotation method achieves quantitative recoveries of chromium (94.5-101.1%), copper (95.1-101.0%) and lead (95.1-101.6%).
The data show that ETAAS results agree with those obtained by ICP OES as an independent method. The
Table 6. ETAAS determinations of lead in natural water samples after flotation with Fe(HpDTC)3 verified by the method of standard additions and ICP OES
Water sample Flotation/ETAAS Evaporation/ICP OES
Added Estimated Found R / (%) Found
µg L-1 Pb µg L-1 Pb µg L-1 Pb µg L-1 Pb
Pantelejmon - - 0.59
-15.17 dHo a 1.25 1.84 1.87 101.6 <0.5
pH = 7.45 2.50 3.09 2.98 96.4
Sreden Izvor - - 0.63
-20.23 dHo 1.25 1.88 1.85 98.4 <0.5
pH = 7.2 2.50 3.13 3.17 101.3
RaÎe - - 0.57
-12.25 dHo 1.25 1.82 1.82 100.0 <0.5
pH = 7.17 2.50 3.07 2.92 95.1
Demir Kapija - - 0.59
-8.79 dHo 1.25 1.84 1.79 97.2 <0.5
pH = 7.47 2.50 3.09 2.97 96.1
Veles - - 0.62
-1.86 dHo 1.25 1.87 1.83 97.8 <0.5
pH = 6.56 2.50 3.12 2.98 95.5
1213 jundevaet al.
Vol. 18, No. 6, 2007
water samples tested by ICP OES were concentrated by evaporation from 1 L to 25 mL. Our previous inves-tigations31,35-39 show that the interferences of Ca/Mg on the intensities of Cr, Cu and Pb as trace elements are not present in the samples similar to the concentrated water samples by evaporation.
The method was additionally verified by determination of trace elements in the surface water reference material SPS-SW1 Batch 107 (Spectrapure Standards AS), which was diluted for 10 times. Results obtained for Cr, Cu and Pb in reference material (Table 7) agree well with the certified value (Student’s t-test, 95%).
Conclusions
The main conclusion of these investigations confirmed that Fe(HpDTC)3 can be applied as a flotation collector for simultaneous separation and preconcentration of Cr(III), Cr(VI), Cu(II) and Pb(II) by flotation prior to ETAAS. The pH of the medium, as well as the amounts of Fe and HpDTC–, as constituents of the collector investigated, affect the flotation recoveries on analytes present in water system. Fe(HpDTC)3 was shown as a collector with a significant hydrophobility, which is an important criterion for successful flotation. That can be evidenced by the excellent recoveries of analytes (R > 95%). From practical point of view, the recommended preconcentration procedure is inexpensive, rapid (about 25-30 min) and permits determination of micro and nano concentrations of chromium, copper and lead in large volumes of solutions.
References
1. Grushko, Yu. M.; Vrednye Neorganicheskie Soedineniya v
Promyshlennykh Stochnykh Vodakh, Khimiya: Leningrad, 1979,
(in Russian).
2. Manahan, S. E.; Environmental Chemistry, 7th ed., Lewis
Publishers: Boca Raton, 2000.
3. Connell, D. W.; Basic Concepts of Environmental Chemistry, CRC Press: Boca Raton, 1997.
4. Baird, C.; Environmental Chemistry, W. H. Freeman and Company: New York, 1995.
5. Klassen, K. D.; Amdur, M. O.; Doull, J., eds. Casarrett and
Doull’s Toxicology, The Basic Science of Poisons, 5th ed.;
McGraw-Hill, Health Professions Division: New York, 1996. 6. Goyer, R. A.; Toxic Effect of Metals in Casarett and Doull’s
Toxicology. The Basic Science of Poisons, 3rd ed., Macmillan
Publishing Company: New York, 1986.
7. WHO Chromium in Drinking-Water. Background Document for Preparation of WHO Guidelines for Drinking-Water
Quality. World Health Organization: Geneva, 2003.
8. WHO Copper in Drinking-Water. Background Document For Preparation of WHO Guidelines for Drinking-Water Quality.
World Health Organization: Geneva, 2004.
9. WHO Lead in Drinking-Water. Background Document for Preparation of WHO Guidelines for Drinking-Water Quality.
World Health Organization: Geneva, 2003.
10. Mizuike, A.; Flotation,in Enrichment Techniques for Inorganic
Trace Analysis, Springer-Verlag: Heidelberg, 1983.
11. Zolotov, Y. A.; Kuzmin, N. M.; Preconcentration of Trace
Elements, Elsevier: Amsterdam, 1990.
12. Caballero, M.; Cela, R.; Pérez-Bustamante, J. A.; Talanta1990,
37, 275.
13.jundeva, K.; Stafilov, T.; Anal. Lett.1997,30, 833. 14.jundeva, K.; Stafilov, T.; Talanta1997,44, 451.
15.jundeva, K.; Stafilov, T.; Fresenius’ J. Anal. Chem.1997, 358, 818.
16. Pavlovska, G.; Stafilov, T.; jundeva, K.; Fresenius’ J. Anal. Chem.1998,361, 213.
17. Stafilov, T.; jundeva, K.; Talanta1998,46, 1321.
18. Zendelovska, D.; jundeva, K.; Stafilov, T.; Microchim. Acta
2000, 135 , 55.
19. Pavlovska, G.; jundeva K.; Stafilov, T.; Sep. Sci. Technol.2000,
35, 2663.
20. Stafilov, T.; Pavlovska, G.; jundeva, K.; Turk. J. Chem.2000,
24, 303.
21. Stafilov, T.; Pavlovska, G.; jundeva, K.; Zendelovska, D.; Paneva, V.; J. Environ. Sci. Health2001,36, 735.
22.jundeva, K.; Pavlovska, G.; Stafilov, T.; J. Serb. Chem. Soc.
2001,66, 709.
23. Pavlovska, G.; jundeva K.; Stafilov, T.; Croat. Chem. Acta
2001,74, 121.
24. Pavlovska, G.; Stafilov, T.; jundeva, K.; Fresenius’ J. Anal. Chem.2001,369, 670.
25. Stafilov, T.; jundeva K.; Pavlovska, G.; J. Environ. Anal. Chem.
2001,80, 260.
26. Pavlovska, G.; jundeva, K.; Stafilov, T; Anal. Lett.2002,35, 2347. 27.jundeva, K.; Stafilov, T.; Pavlovska, G.; Karadjova, I.;
Arpadjan, S.; Int. J. Environ. Anal. Chem.2003,83, 1009. 28. Ay, Ü.; jundeva, K.; Akçin, G.; Stafilov, T.; Zajkova V. P.;
Pavlovska, G.; Anal. Lett.2004,37, 695.
Table 7. Determination of Cr, Cu and Pb in certified reference material
sample SPS-SW1 Batch 107 by the proposed method (given in µg L-1, n = 3, mean±SD)
Cr Cu Pb
Certified 2.00±0.02 20±1 5.0±0.1
Found 1.95±0.01 20.5±0.85 4.97±0.09
tcalc.,n=5 2.1 1.9 2.5
29. Koyuncu, I.; Bundaleska, J. M.; Ay, Ü.; jundeva, K.; Stafilov, T.; Akçin, G.; Sep. Sci. Technol.2004,39, 2751.
30. Bundalevska, J. M.; Koyuncu, I.; Ay, Ü.; jundeva, K.; Akçin, G.; Stafilov, T.; J. Environ. Sci. Health 2005,40, 1045. 31. Zajkova Paneva, V. Z.; jundeva, K.; Stafilov, T.; Spectrochim.
Acta, Part B 2005,60, 403.
32. Zendelovska, D. ; Stafilov, T.; Turk. J. Chem.2002,26, 271. 33. jundeva, K.; Stafilov, T.; Fresenius’ J. Anal. Chem.1995,352,
354.
34. Stafilov, T.; Pavlovska, G.; jundeva, K.; Microchem. J.1998,
60, 32.
35. Sesi, N. N.; Hieftje, G. M.; Spectrochim. Acta, Part B1996,
51, 1601.
36. Daskalova, N.; Boevski, Iv.; Spectrochim. Acta, Part B1999,
54, 1099.
37. Chan, G. C. -Y.; Chan, W.-T.; Mao, X.; Russo, R. E.;
Spectrochim. Acta, Part B 2001,56, 77.
38. Maestre, S.; Mora, L.; Todolí, J.-L.; Spectrochim. Acta, Part B
2002,57, 1753.
39. Zajkova Paneva, V.; jundeva, K.; Stafilov, T.; Geostand.
Geoanal. Res.2007,31, 51.