Is there correlation between alveolar
and systemic bone density?
Paula Cabrini Scheibel1, Adilson Luiz Ramos2, Lilian Cristina Vessoni Iwaki2
How to cite this article: Scheibel PC, Ramos AL, Iwaki LCV. Is there correla-tion between alveolar and systemic bone density? Dental Press J Orthod. 2013 Sept-Oct;18(5):78-83.
Submitted: June 22, 2011 - Revised and accepted: November 08, 2011
» The authors report no commercial, proprietary or inancial interest in the prod-ucts or companies described in this article.
Contact address: Paula Cabrini Scheibel
Av. Dr Luiz Teixeira Mendes, 2266 – Maringá/PR, Brazil CEP: 87015-001 – E-mail: [email protected] » The patients displayed in this article previously approved the use of their facial
and intraoral photographs.
1 MSc in Integrated Dentistry, State University of Maringá. 2 Associate Professor, State University of Maringá.
Objective: The present study assessed the correlation between maxillomandibular alveolar bone density and systemic bone mineral density (BMD). Methods: Dual-energy X-ray absorptiometry of the anterior and posterior maxillo-mandibular alveolar bone, of the standard sites for the measurement of BMD (lumbar spine and femur) and the third cervical vertebra was performed on 23 middle-aged women. Periapical radiographs were also obtained, with an alumi-num step-wedge as reference for the digital reading of apical bone density of the upper incisors. Results: Spearman’s correlations coefficients revealed that density in the apical region was correlated with that of the femoral neck (r = 0.433; p < 0.05); BMDs of the posterior regions of the mandible and maxilla were significantly correlated with that of the cervical vertebra (r = 0.554, p ≤ 0.01 and r = 0.423, p ≤ 0.05, respectively); and the anterior maxilla was correlated with the posterior mandible (r = 0.488, p ≤ 0.05). Conclusion: Bone density of the maxillary alveolar bone was sig-nificantly correlated with that of the femoral neck. Among the bone densities of the alveolar regions, only the anterior maxilla and the posterior mandible were significantly correlated. The findings suggested that bone densitometry might be individually and locally evaluated.
Keywords:Bone density. Dental radiography. Densitometry.
Objetivo: avaliar a correlação entre a densidade óssea alveolar maxilomandibular e a densidade mineral óssea sistê-mica. Métodos: a absorciometria duoenergética por raios X do osso alveolar maxilomandibular (região anterior e posterior), dos sítios sistêmicos padrões (coluna lombar e fêmur) e da terceira vértebra cervical foi realizada em 23 mulheres de meia idade. Radiografias periapicais dos incisivos superiores também foram obtidas com uma escala de alumínio como referência para a leitura digital da densidade óssea da região apical. Resultados: o teste de correlação de Spearman revelou que a densidade da região apical foi correlacionada com a do colo femoral (r = 0,433; p < 0,05), a densidade óssea da região posterior mandibular e maxilar foram significativamente correlacionadas com a DMO da vértebra cervical (r = 0,554, p ≤ 0,01; e r = 0,423, p ≤ 0,05) e a da região maxilar anterior foi correlacionada com a mandibular posterior (r = 0,488, p ≤ 0,05). Conclusão: a densidade óssea alveolar maxilar foi significativamente cor-relacionada com a do colo femoral. Entre as densidades ósseas das regiões alveolares, somente a anterior maxilar (AMx) e posterior mandibular (PMd) foram significativamente correlacionadas. Esse achado sugere que a densitometria óssea deveria ser individual e localmente avaliada.
INTRODUCTION
In Dentistry, it is necessary to discuss variations in maxillomandibular bone mass and diferent responses to dental procedures, such as tooth movement, implant placement and periodontal treatment.1-13 Research on
this issue has mainly focused on healthy adults as well as on those presenting systemic conditions, such as osteoporosis; because such individuals have increas-ingly sought dental treatment in recent years. Despite the existence of a gold standard for assessing systemic bone loss (densitometry), no normative values have been deined for the maxilla and mandible. Moreover, divergent results have been found regarding correla-tions between systemic (spine, femur and radius) and maxillomandibular bone mass.
A number of studies have concluded that assessing some morphological patterns observed in dental radio-graphs — such as mandibular cortical thickness, trabec-ular pattern, cortical index and optical density — is a promising method that can contribute to the diagnosis of osteoporosis.6,14-19 In a literature review, Hildebolt20
reports a possible association between osteoporosis and maxillary bone loss, although not all studies have found such an association. Tanaka et al.13 conducted
histomor-phometric analyses of trabecular structural changes in the mandibular alveolar bone of ovariectomized rats and concluded that osteoporotic changes caused by estrogen deiciency and the signiicant increase in intratrabecular spaces may accelerate the destruction of alveolar bone, leading to tooth loss, especially in older women afected
by periodontal disease. However, Miyauchi11 found no
statistically signiicant diferences in densities between premenopausal and postmenopausal women afected by periodontal disease.
The orthodontic community is also concerned about probable biological differences in response to tooth movement. A number of studies have ad-dressed the effects of hormonal imbalance on bone metabolism and its influence on tooth movement, while others have investigated the consequences of administrating particular chemical substances.21 The
rate of alveolar bone remodeling increases in rats with induced osteoporosis, which could enhance tooth movement.1,2 These findings corroborate faster tooth
movement found in dogs with high bone turnover in-duced by secondary nutritional hyperparathyroidism, and rabbits submitted to osteoporosis induced by the administration of corticosteroids.22,23
Considering the small number of studies and the divergent results regarding this topic, the aim of the present study was to assess correlations in bone mineral density (BMD) between the maxillomandibular alveo-lar bone and the apical region of the upper central inci-sors, femur, lumbar spine and cervical spine.
MATERIALS AND METHODS
The sample comprised 23 women aged between 32.6 and 48.3 years (mean= 40.2 years). Inclusion cri-teria were: a signed informed consent, presence of most teeth in the dental arch, no previous orthodontic
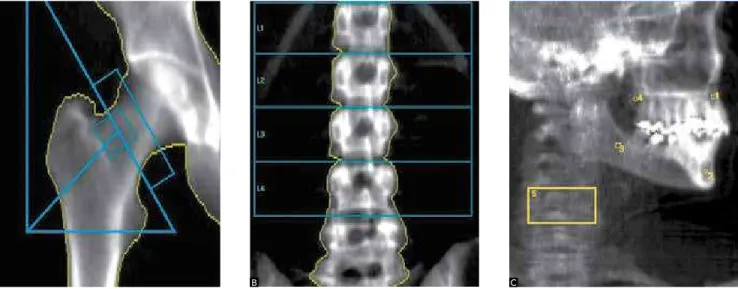
Figure 1 - Regions of interest in: A) femur and B) lumbar spine. C) Regions of interest in alveolar bone apical to upper central incisors (1); alveolar bone between cortical plates of mandibular symphysis (2); alveolar bone distal to mandibular second molar (3); alveolar bone distal to maxillary second molar (4); and third cervical vertebra (5).
treatment, no history of osteoporosis and hyperparathy-roidism. All procedures were approved by the Ethics Committee of the State University of Maringá.
The subjects were submitted to dual-energy X-ray ab-sorptiometry (DXA) performed by a Lunar 2003 X-ray bone densitometer (Prodigy 8743, Lunar, GE Medical Systems). Densitometric readings were obtained for the following regions: total hip (TH), femoral neck (FN), irst to fourth lumbar vertebrae (L1-L4), third cervical verte-bra (C3), alveolar bone distal to the mandibular second molar (PMd), alveolar bone between the cortical plates of the mandibular symphysis (AMd), alveolar bone apical to the upper central incisors (AMx) and alveolar bone distal to the maxillary second molar (PMx) (Fig 1). These val-ues were determined based on the amount of calcium hy-droxyapatite in grams per square centimeter (g/cm2).
The femoral and lumbar exams followed an interna-tionally recognized standard protocol. BMD of the third cervical vertebra and the maxillomandibular regions was determined with the individual in ventral decubitus and the let face over the equipment table, so that the X-ray beam was perpendicular to the sagittal plane.6,24
Periapical radiographs of the upper incisors were tak-en using X-ray equipmtak-ent (RX Timex 70 C, Gnatus, Ribeirão Preto, SP, Brazil) operating with 70 kVp, 7 mA and a 0.25-second exposure time. A ive-step 2 x 20 x 3.5 mm aluminum wedge (Al step-edge) was attached to the apical region perpendicular to the ilm (Agfa Den-tus M2 “Comfort”). Kodak developing and ixing solu-tions (Kodak Brazil, Commerce and Industry Ltda, São
José dos Campos, SP, Brazil) were used to process the radiographs. The radiographic ilm was processed manu-ally using the time-temperature method. Development time was determined by a table ater verifying the liq-uid temperature (2 minutes in developer with tempera-ture between 20 and 26oC). Intermediate washing was
standardized at 30 seconds and ixing time was standard-ized at 10 minutes.25 Radiographic images were digitized
using a scanner with resolution of 400 ppi (ArtixScan 18000F, Microtek, São Paulo, SP, Brazil).
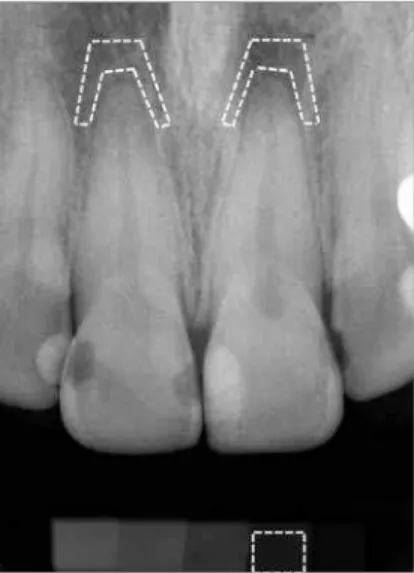
Employing the histogram tool of Photoshop CS3 sotware (Adobe System, California, USA), a trapezoidal region of interest (ROI) was outlined in the alveolar bone surrounding the apical region of the upper central incisors to estimate optical density, expressed in grey level values. The lightest area on the ilm was represented by a pixel intensity value of 256, while the black areas were repre-sented by 0. Each ROI consisted of approximately 2000 pixels. This dimension was used to aid in the selection of the trabecular alveolar bone, avoiding the tooth root, lamina dura, nasal spine and other structures. The digital reading of each step was performed by selecting a rect-angular ROI of approximately 2500 pixels (Fig 2). Us-ing the optical densities of the aluminum steps, the mean optical density of the bone between both central incisors could be transformed into aluminum equivalent milli-meters (mmEq/Al) to obtain an indication of the anterior maxillary alveolar bone mass (UI_mmEq/Al).
All measurements were determined twice by the same examiner with a 15-day interval between read-ings. Intraexaminer reliability was statistically analyzed by establishing the diference between duplicate mea-surements on the densitometric and radiographic im-ages of each patient. The error of the method was calcu-lated using Dahlberg’s formula:
In which d is the diference between pairs of
mea-surements and n is the number of pairs of
measure-ments.15 Student’s t-test was also employed: UI_grey
level (p = 0.96); 1st step grey level (p = 0.92); 2nd step grey
level (p = 0.95); 3rd step grey level (p = 0.94); 4th step grey
level (p = 0.97); and 5th step grey level (p = 0.93).
Al-though no statistically signiicant diferences were found between the irst and second measurements, the mean of each region was used in the subsequent statistical tests in order to minimize the random error. The examiner
DISCUSSION
The present investigation found a correlation be-tween systemic BMD and alveolar bone mass assessed in periapical radiographs and determined in mmEq/Al, which corroborates previous studies.15,19,26,27
As trabecular bone is more susceptible to mineral loss,28 assessing regions with a greater amount of this type
of bone is important to understand the relationship be-tween systemic bone and oral status.26 The mandible is
a predominantly cortical bone and should, therefore, be compared with other cortical bones, such as the femur and forearm bones. Similarly, the maxilla is a predominantly trabecular bone and should be compared to the spine and the femur neck.29 In a 10-year follow-up study, changes
in the mandibular bone were correlated with changes in BMD of the forearm bones.19 Moreover, BMD of the
an-terior region of the maxilla was correlated with that of the lumbar spine (r = 0.6; p < 0.05).30 In the present study,
a signiicant correlation was found between the femoral neck and the alveolar bone of the upper central incisors apical region (r = 0.433; p < 0.05). Klemetti et al 31 found
a correlation between BMD of the layers of the mandib-ular cortex distal to the mental foramen (as determined by quantitative computed tomography) and BMD of the femoral neck and lumbar spine; however, there was no correlation with trabecular portions of the mandible. carrying out the bone measurements was unaware of the
identiication of each volunteer.
Statistical analysis
Spearman’s correlation test was applied to all vari-ables (TH, FN, L1-L4, C3, PMd, AMd, AMx, PMx and UI). This non-parametric test was chosen due to the small sample size and the unusual distribution of data, as determined by the Shapiro-Wilk and Kolmogorov-Smirnov tests. Analyses were carried out using Micro-sot Oice Excel 2007 (MicroMicro-sot, USA) and SPSS 10.0 (SPSS Inc., Chicago, IL, USA) sotwares.
RESULTS
Table 1 displays both mean and standard deviation concerning the participants’ age, densitometry values of the eight regions assessed by DXA (total hip, femoral neck, lumbar spine, cervical vertebra, alveolar bone of posterior and anterior maxilla and mandible regions) and the digital densities of the alveolar process of the upper incisors apical region.
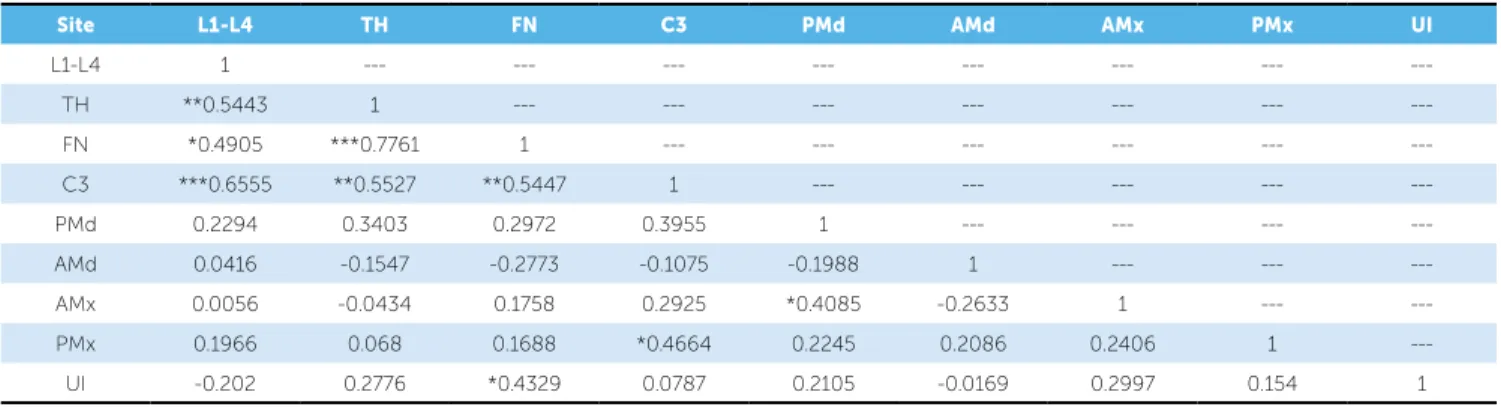
Table 2 displays the correlation matrix for the den-sitometric values of all regions assessed (TH, FN, L1-L4, C3, PMd, AMd, AMx, PMx and UI). Statistically signiicant correlation was found between UI and FN (r = 0.433; p < 0.05).
Table 2 - Correlation matrix of densitometric values of TH, FN, C3, L1-L4, PMd, AMd, PMx, AMx and UI; Spearman’s test (r).
Significant correlation: *P ≤ 0.05, ***P ≤ 0.001.
Site L1-L4 TH FN C3 PMd AMd AMx PMx UI
L1-L4 1 --- --- --- --- --- --- ---
---TH **0.5443 1 --- --- --- --- --- ---
---FN *0.4905 ***0.7761 1 --- --- --- --- ---
---C3 ***0.6555 **0.5527 **0.5447 1 --- --- --- ---
---PMd 0.2294 0.3403 0.2972 0.3955 1 --- --- ---
---AMd 0.0416 -0.1547 -0.2773 -0.1075 -0.1988 1 --- ---
---AMx 0.0056 -0.0434 0.1758 0.2925 *0.4085 -0.2633 1 ---
---PMx 0.1966 0.068 0.1688 *0.4664 0.2245 0.2086 0.2406 1
---UI -0.202 0.2776 *0.4329 0.0787 0.2105 -0.0169 0.2997 0.154 1
Table 1 - Mean and standard deviation of densitometric bone values in assessed regions (L1-L4, TH, FN, C3, PMd, AMd, AMx, PMx and UI)
L1-L4= 1st to 4th lumbar vertebrae. TH = Total hip. FN= Femoral neck. C3= 3rd cervical vertebra. PMd = Alveolar bone distal to mandibular second molar. AMd = Alveolar
bone between cortical plates of mandibular symphysis. PMx = Alveolar bone distal to maxillary second molar. UI = Alveolar bone of upper central incisors apical region.
Subjects
n = 23
Age
(years)
L1-L4
(g/cm2)
TH
(g/cm2)
FN
(g/cm2)
C3
(g/cm2)
PMd
(g/cm2)
AMd
(g/cm2)
AMx
(g/cm2)
PMx
(g/cm2)
UI
(mmEq/AI)
Mean 40.2 1.160 0.966 0.957 0.871 0.958 1.458 1.401 1.009 3.49
precision than DXA, favoring the selection of tra-becular alveolar bone while avoiding the crest, lamina dura, tooth root and other structures. However, neither method enables the distinction between cortical and trabecular bones, which is achieved through computed tomography. Therefore, studies assessing bone density for placing implants8,30 or orthodontic mini-implants35
have used tomography.
Among the maxillomandibular regions, only AMx and PMd were correlated, which corroborates the conclusion that the BMD of one site does not neces-sarily reflect the BMD of another site.6,8,30 The
high-est densitometric value was for AMd (1.458 g/cm2)
followed by AMx (1.401 g/cm2), PMx (1.008 g/cm2)
and PMd (0.958 g/cm2). In a study involving
com-puted tomography, Oliveira et al8 also found higher
BMD measurements for the anterior mandibular region, followed by the anterior maxilla, posterior mandible and posterior maxilla.
A more detailed study concerning computed tomog-raphy35 has demonstrated that bone density tends to
de-crease as depth inde-creases, particularly in the posterior area. Mean bone density demonstrated a progressive in-crease from the posterior to anterior region, except for the mandibular buccal side, for which no signiicant dif-ferences were found. A comparison of mean bone den-sities between buccal and lingual sides revealed that the lingual side of the mandible had higher values in the an-terior area and lower values in the posan-terior area. On the other hand, no distinct diferences were found between buccal and lingual sides of the maxilla. Additionally, a comparison of the mean bone densities between the maxilla and mandible revealed higher values in the lat-ter, with more signiicant diferences on the buccal side of the posterior region. The authors concluded that dif-ferences in bone density, in accordance with depth and area, should be considered when selecting and placing mini-implants for orthodontic anchorage.
Although a number of studies have reported a cor-relation between maxillomandibular alveolar bone mass and systemic BMD (lumbar spine, total femur, femoral neck and radius), differences are found among the methods employed and the specific correlations of the regions assessed. Therefore, further studies are required for establishing a standard method with nor-mative alveolar densitometric values in order to de-termine these correlations.
In the present study, signiicant correlations were found between BMD of the third cervical vertebra, the systemic BMD (total hip, femoral neck and lum-bar spine) and the BMD of the posterior alveolar region of the maxilla (r = 0.466; p ≤ 0.05). These data cor-roborates a previous study carried out by our research group, in which a signiicant correlation was found be-tween the third cervical vertebra and total hip (r = 0.63; p ≤ 0.001).32 The few previous studies that have assessed
BMD of the cervical spine have found either a weak or no correlation with that of the mandible.32,33
Southard et al.26 found that BMD of the maxillary
alveolar process was correlated with that of the lumbar spine (r = 0.53; p ≤ 0.001) and total hip (r = 0.39; p = 0.01). Conversely, in the present study, BMD of the maxillary alveolar process was correlated with that of the femoral neck (r = 0.433; p < 0.05). Neither study found a correlation between mandibular and systemic BMD. The cited authors also report a correlation be-tween BMD of the maxilla and mandible (r = 0.57; p ≤ 0.001). The present study found a correlation between BMD of the anterior maxilla and posterior mandible (r = 0.488; p < 0.05). The divergent results may be partially explained by methodological differ-ences in obtaining maxillary densitometry values. In the present study, periapical radiographs were taken at the upper incisor region, only; while the maxil-lomandibular regions (PMd, AMd, AMx, and PMx) were assessed by DXA. In the study carried out by Southard et al,26 BMD of both the maxilla and
man-dible was assessed using periapical radiographs of the anterior regions and interproximal of the posterior regions. Moreover, the mean values obtained from the available interproximal regions (mesial to second molar) of the maxilla and the mandible were ana-lyzed. According to Lindh et al,30 although anterior
maxillary bone density and systemic bone density may be similar, further studies are required to inves-tigate this relation.
Corten et al24 found a 0.5% and 3% coeicient of
variation for ex vivo and in vivo mandibular
densito-metric measurements, respectively, using DXA.25 The
authors stated that improvements may be obtained by repeating the measurements, as X-ray exposure is low. However, von Wowern34 found high precision using
1. Goldie RS, King GJ. Root resorption and tooth movement in orthodontically treated, calcium-deicient, and lactating rats. Am J Orthod Dentofac Orthop. 1984;85(5):424-30.
2. Verna C, Dalstra M, Melsen B. The rate and the type of orthodontic tooth movement is inluenced by bone turnover in a rat model. Eur J Orthod. 2000;22:343-52.
3. Kaley J, Phillips C. Factors related to root resorption in edgewise practice. Angle Orthod. 1991;61(2):125-32.
4. Horiuchi A, Hotokezaka H, Kobayashi K. Correlation between cortical plate proximity and apical root resorption. Am J Orthod Dentofacial Orthop. 1998;114(3):311-8.
5. Otis LL, Hong JSH, Tuncay OC. Bone structure efect on root resorption. Orthod Craniofacial Res. 2004;7(3):165-77.
6. Devlin H, Horner K, Ledgerton D. A comparison of maxillary and mandibular bone mineral densities. J Prosthet Dent. 1998;79(3):323-27.
7. Choël L, Duboeuf F, Bourgeois D, Briguet A Lissac M. Trabecular alveolar bone in the human mandible: a dual-energy x-ray absorptiometry study. Oral Surg Oral Med Oral Pathol Oral Radiol Endod. 2003;95(3):364-70.
8. Oliveira RCG, Leles CR, Normanha MD, Lindh C, Ribeiro-Rotta RF. Assessments of trabecular bone density at implant sites on CT images. Oral Surg Oral Med Oral Pathol Oral Radiol Endod. 2008;105(2):231-8.
9. Lindh C, Petersson A, Rohlin M. Assessment of the trabecular pattern before endosseous implant treatment: Diagnostic outcome of periapical radiography in the mandible. Oral Surg Oral Med Oral Pathol Oral Radiol Endod. 1996;82(3):335-43.
10. Verhoeven JW, Ruijter J, Cune MS, Terlou M. Oblique lateral cephalometric radiographs of the mandible in implantology: usefulness and reproducibility of the technique in quantitative densitometric measurements of the mandible in vivo. Clin Oral Implants Res. 2000;11(5):476-86.
11. Miyauchi FM. Densidade óssea alveolar em mulheres com periodontite na pré- e pós-menopausa [dissertação]. Piracicaba (SP): Universidade Estadual de Campinas; 2004 [Acesso 27 fev 2009]. Disponível em: http://libdigi.unicamp.br. 12. Jagelaviciene E, Kubilius R. The relationship between general osteoporosis of the
organism and periodontal diseases. Medicina (Kaunas) 2006 [Access 2009 feb 27];42(8):613-8. Available from: http://medicina.kmu.lt.
13. Tanaka M, Ejiri S, Toyooka E, Kohno S, Ozawa H. Efects of ovariectomy on trabecular structures of rat alveolar bone. J Periodont Res. 2002;37(2):161-5. 14. Lee BD, White SC. Age and trabecular features of alveolar bone associated
with osteoporosis. Oral Surg Oral Med Oral Pathol Oral Radiol Endod. 2005;100(1):92-8.
15. Jonasson G, Jonasson L, Kiliaridis S. Changes in radiographic characteristics of the mandibular alveolar process in dentate women with varying bone mineral density: a 5-year prospective study. Bone .2006;38(5):714-21.
16. Tosoni GM, Lurie AG, Cowan AE, Burleson JA, Farmington CT. Pixel intensity and fractal analyses: detecting osteoporosis in perimenopausal and postmenopausal women by using digital panoramic images. Oral Surg Oral Med Oral Pathol Oral Radiol Endod. 2006;102(2):235-41.
17. Yaşar F, Akgünlü F. The diferences in panoramic mandibular indices and fractal dimension between patients with and without spinal osteoporosis. Dentomaxillofac Radiol. 2006;35(1):1-9.
REFERENCES
18. Lindh C, Horner k, Jonasson G, Olsson P, Rohlin M, Jacobs R, et al. The use of visual assessment of dental radiographs for identifying women at risk of having osteoporosis: the OSTEODENT project. Oral Surg Oral Med Oral Pathol Oral Radiol Endod. 2008;106(2):285-93.
19. Jonasson G. Bone mass and trabecular pattern in the mandible as an indicator of skeletal osteopenia: a 10-year follow-up study. Oral Surg Oral Med Oral Pathol Oral Radiol Endod. 2009;108(2):284-91.
20. Hildebolt CF. Osteoporosis and oral bone loss. Dentomaxillofac Radiol 1997;26(1):3-15.
21. Oliveira DD, Bolognese AM, Souza MMG. Selective alveolar corticotomy to assist orthodontic tooth movement. Rev Clín Ortod Dental Press. 2007;6(3):66-72. 22. Midgett RJ, Shaye R, Fruge JF. The efect of altered bone metabolism
on orthodontic tooth movement. Am J Orthod Dentofac Orthop. 1981;80(3):256-62.
23. Ashcraft MB, Southard KA, Tolley EA. The efect of corticosteroid induced osteoporosis on orthodontic tooth movement. Am J Orthod Dentofac Orthop. 1992;102(4):310-9.
24. Corten, FG, van’t Hof MA, Buijs WCAM, Hoppenbrouwers P, Kalk W, Corstens FHM. Measurement of mandibular bone density ex vivo and in vivo by dual-energy X-ray absorptiometry. Arch Oral Biol. 1993;38(3):215-9.
25. Rosa JE. Considerations about radiographic processing. Rev Catar Odont. 1975;2:29-36.
26. Southard KA, Southard TE, Schlechte JA, Meis PA. The relationship between the density of the alveolar processes and that of post-cranial bone. J Dent Res. 2000;79(4):964-9.
27. Jonasson G, Bankvall G, Kiliaridis S. Estimation of skeletal bone mineral density by means of the trabecular pattern of the alveolar bone, its interdental thickness, and the bone mass of the mandible. Oral Surg Oral Med Oral Pathol Oral Radiol Endod. 2001;92(3):346-52.
28. Cummings SR, Bates D, Black DM. Clinical use of bone densitometry: scientiic review. JAMA. 2002;288(15):1889-99.
29. Jonasson G, Kiliaridis S. The association between the masseter muscle, the mandibular alveolar bone mass and thickness in dentate women. Arch Oral Biol. 2004;49(12):1001-6.
30. Lindh C, Obrant K, Petersson A. Maxillary bone mineral density and its relationship to the bone mineral density of the lumbar spine and hip. Oral Surg Oral Med Oral Pathol Oral Radiol Endod. 2004;98(1):102-9.
31. Klemetti E, Vainio P, Lassila V, Alhava E. Cortical bone mineral density in the mandible and osteoporosis status in postmenopausal women. Scand J Dent Res. 1993;101(4):219-23.
32. Scheibel PC, Albino CC, Matheus PD, Ramos AL. Correlação entre a densidade óssea mandibular, femural, lombar e cervical. Dental Press J Orthod. 2009;14(4):111-22.
33. Celenk C, Celenk P. Relationship of mandibular and cervical vertebral bone density using computed tomography. Dentomaxillofac Radiol. 2008;37(1):47-51. 34. von Wowern N. In vivo measurement of bone mineral content of mandibles by
dual-photon absorptiometry. Scand J Dent Res. 1985;93(2):162-8.
35. Choi J, Park C, Yi S, Lim H, Hwang H. Bone density measurement in interdental areas with simulated placement of orthodontic miniscrew implants. Am J Orthod Dentofacial Orthop. 2009;136(6):766.e1-12.
CONCLUSION
Based on the results of the present study, the follow-ing conclusions can be drawn:
» Bone density of the maxillary alveolar bone was correlated with that of the femoral neck.
» Among the bone densities of the alveolar regions, only the anterior maxilla (AMx) and posterior man-dible (PMd) were signiicantly correlated.