Reliability of Brachial Artery Flow-Mediated Dilatation Measurement
Using Ultrasound
Cláudia de Mello Meirelles, Sandra Pereira Leite, Carlos Antonio Barbosa Montenegro, Paulo Sergio Chagas Gomes Centro de Pesquisas Interdisciplinares em Saúde e Programa de Pós-Graduação em Educação Física da Universidade Gama Filho, Departamento de Nutrição do UNIBENNETT; Departamento de Nutrição da Universidade Gama Filho; Ultra-sonografia Botafogo - Rio de Janeiro, RJ - Brazil
Summary
Objective:To determine the reliability of the baseline (BBAB) and post occlusion (POBAD) brachial artery diameters,
brachial artery flow-mediated dilatation (BAFMD) measurements, and to quantify the standard error of these measurements (TEM).
Methods: Internal consistency (2 measurements on the same day) was determined in 10 volunteers, whereas stability
(2 measurements on separate days) was determined in 13 volunteers. All the volunteers were apparently healthy and all were nonsmokers. The brachial artery images were obtained using a two dimensional Doppler ultrasound instrument equipped with a 14 MHz transducer. The distances between the intima-lumen interfaces were measured before and after the blood flow had been stopped by means of a cuff on the arm for five minutes. BAFMD was considered as the percent change of POBAD in relation to BBAD.
Results: ANOVA did not identify any significant differences between the measurements taken on the same and separate days. For BAFMD, the intraclass correlation coefficients between the measurements taken on the same and separate days were: R = 0.7001 and R = 0.8420, respectively (p < 0.05). The coefficients of variation were 5.8% and 12.4% and the relative ETMs were 13.8% and 14.9%, respectively, for the measurements taken on the same and separate days. Analysis of the Bland-Altman graphs indicated that the variables did not present heteroscedastic errors.
Conclusion: The BBAD, POBAD and BAFMD measurements using the manual ultrasound technique were highly
reliable for both the same and separate day measurements and therefore can be used to diagnose and monitor endothelial function. (Arq Bras Cardiol 2007;89(3):160-167)
Key words: Internal consistency, stability, typical error of measurement, vascular reactivity, endothelial function.
Mailing address: Paulo Sergio Chagas Gomes • Departamento de Educação Física, Universidade Gama Filho Rua Manoel Vitorino, 625 - 20748-900 - Rio de Janeiro, RJ - Brazil E-mail: [email protected]
Manuscript received January 19, 2007; revised manuscript received April 11, 2007; accepted April 11, 2007.
Introduction
Brachial artery flow-mediated dilatation (BAFMD) is an indicator of endothelial function that can be obtained using the noninvasive ultrasound (US) technique. The technique, initially described by Celermajer et al1 and recommended by
the International Brachial Artery Reactivity Task Force2, is based
on the percent change of the brachial artery diameter caused by reactive hyperemia, which is observed using high resolution transducers – usually 7 MHz or higher. BAFMD values greater than 10% in males and 15% in females present high sensitivity to identify coronary artery disease3 in both genders.
Chequer et al4 reported significant correlation between
BAFMD and intima media thickness (IMT), also an early indicator of atherosclerosis (Spearman r: -0.315; P = 0.042).
Endothelial function is affected by chronic conditions such as obesity, diabetes, hypercholesterolemia, smoking and hypertension5, and, acutely, by sleeplessness, mental stress,
hormonal changes, physical exercise, menstrual cycle and diet3.
Vascular reactivity changes caused by these conditions can be observed by BAFMD5 and affect its reliability as well.
The reliability of BAFMD also appears to be affected by procedural interferences such as the cuff placement site6,
occlusion duration7, transducer resolution8, sonographer’s
experience and intra-individual variability9.
Among the studies that investigated BAFMD, only a few calculated the intraclass correlation coefficient (ICC)9,10.
Variation coefficients (VC) reported in literature, were extremely inconsistent, with a mean of 1.8% for same and separate day measurements11 and values as high as 84%
between the separate day measurements12. It should be
noted that different measurement techniques were used in the available studies.
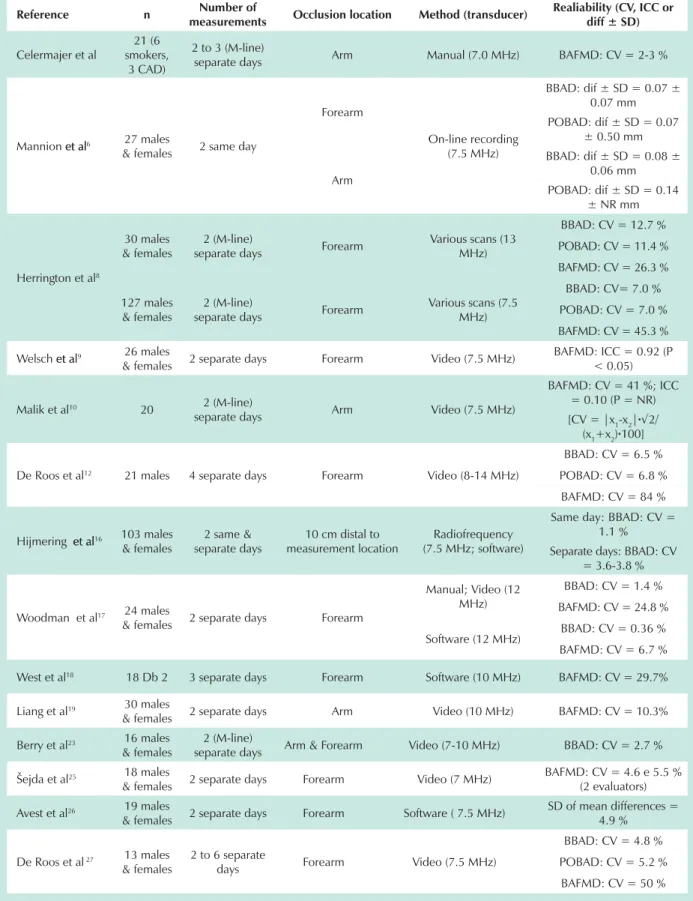
The studies that investigated the reliability of the same and separate day measurements of the baseline (BBAD) and of the post occlusion brachial artery diameter (POBAD) and BAFMD are shown in Table 1.
Table 1 - Summary of studies on the reliability of the baseline and post occlusion brachial artery diameters and BAFMD
Reference n Number of
measurements Occlusion location Method (transducer)
Realiability (CV, ICC or diff ± SD)
Celermajer et al
21 (6 smokers,
3 CAD)
2 to 3 (M-line)
separate days Arm Manual (7.0 MHz) BAFMD: CV = 2-3 %
Mannion et alet al6 27 males
& females 2 same day
Forearm
On-line recording (7.5 MHz)
BBAD: dif ± SD = 0.07 ± 0.07 mm POBAD: dif ± SD = 0.07
± 0.50 mm
Arm
BBAD: dif ± SD = 0.08 ± 0.06 mm POBAD: dif ± SD = 0.14
± NR mm
Herrington et al8
30 males & females
2 (M-line)
separate days Forearm
Various scans (13 MHz)
BBAD: CV = 12.7 %
POBAD: CV = 11.4 %
BAFMD: CV = 26.3 %
127 males & females
2 (M-line)
separate days Forearm
Various scans (7.5 MHz)
BBAD: CV= 7.0 %
POBAD: CV = 7.0 %
BAFMD: CV = 45.3 %
Welsch et alet al9 26 males
& females 2 separate days Forearm Video (7.5 MHz)
BAFMD: ICC = 0.92 (P < 0.05)
Malik et al10 20 2 (M-line)
separate days Arm Video (7.5 MHz)
BAFMD: CV = 41 %; ICC = 0.10 (P = NR) [CV = |x1-x2|·¥
(x1+x2)·100]
De Roos et al12 21 males 4 separate days Forearm Video (8-14 MHz)
BBAD: CV = 6.5 %
POBAD: CV = 6.8 %
BAFMD: CV = 84 %
Hijmering et alet al16 103 males
& females
2 same & separate days
10 cm distal to measurement location
Radiofrequency (7.5 MHz; software)
Same day: BBAD: CV = 1.1 %
Separate days: BBAD: CV = 3.6-3.8 %
Woodman et al17 24 males
& females 2 separate days Forearm
Manual; Video (12 MHz)
BBAD: CV = 1.4 %
BAFMD: CV = 24.8 %
Software (12 MHz) BBAD: CV = 0.36 %
BAFMD: CV = 6.7 %
West et al18 18 Db 2 3 separate days Forearm Software (10 MHz) BAFMD: CV = 29.7%
Liang et al19 30 males
& females 2 separate days Arm Video (10 MHz) BAFMD: CV = 10.3%
Berry et al23 16 males
& females
2 (M-line)
separate days Arm & Forearm Video (7-10 MHz) BBAD: CV = 2.7 %
Šejda et al25 18 males
& females 2 separate days Forearm Video (7 MHz)
BAFMD: CV = 4.6 e 5.5 % (2 evaluators)
Avest et al26 19 males
& females 2 separate days Forearm Software ( 7.5 MHz)
SD of mean differences = 4.9 %
De Roos et al 27 13 males
& females
2 to 6 separate
days Forearm Video (7.5 MHz)
BBAD: CV = 4.8 %
POBAD: CV = 5.2 %
little information is available on brachial artery BAFMD diameter measurements.
The objective of this study was to determine the internal consistency (same day variability) and stability (separate day variability) of the BBAD, POBAD and BAFMD measurements, as well as to quantify the typical error of the measurement (TEM) associated with these measurements.
Methods
Sample - Ten men and women participated in the study to determine internal consistency, and thirteen men and women were used to determine stability. All participants were apparently healthy and all were nonsmokers (33.2 ± 12.1 years; 79.6 ± 20.7 kg; 172.1 ± 9.6 cm). All volunteers were briefed on the experimental procedures and informed that no risks were associated with the study, in accordance with institutional guidelines and Resolution nº 96/196 of the National Health Board.
Experimental procedure - To determine internal consistency, the subjects were submitted to two tests on the same day, with a minimum interval of 1.5 hours between the tests. To determine measurement stability, two tests were conducted with a minimum interval of three days between the tests (mean = 7.2 ± 5.3 days). All tests were conducted at the same time – between 12:30p.m. and 2:30p.m.
In both cases, the subjects fasted for at least three hours before the test and did not perform physical exercise on the day of the measurement.
Brachial artery images - The images were obtained using a two dimensional color spectral Doppler ultrasound equipped with a 14MHz linear transducer (Toshiba Nemium®, Japan).
For the test, each subject laid down comfortably in the supine position with the right arm slightly abduced. After locating the brachial artery, the transducer was placed on the anteromedial face of the right arm, perpendicular to the centerline of the arm, 5-10 cm above the antecubital fossa, over the artery. The Doppler was used to confirm satisfactory placement and artery pulse quality.
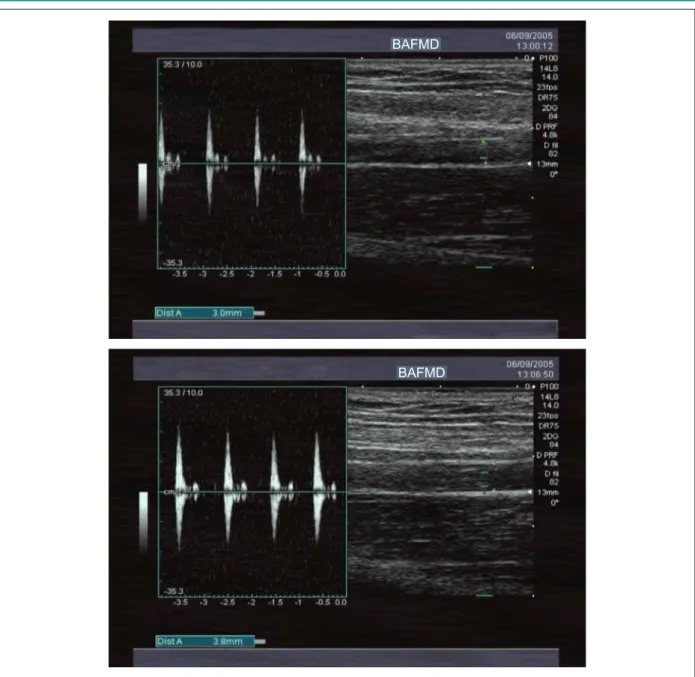
BBAD and POBAD were manually measured between the intima-lumen interfaces at the end of the diastole. After the BBAD measurement, the transducer contact location on the skin was marked so that the POBAD measurement would be taken at the same site. The occlusion was maintained for 5 minutes, using a cuff on the arm to apply pressure slightly above the systolic artery pressure, which was confirmed by the lack of pulse on the Doppler. POBAD was measured 60 to 90 seconds after the blood flow was released. A typical image obtained from the tests is shown in Figure 1.
All tests were performed by the same evaluator, who was not aware of the values observed during the retesting.
BAFMD was calculated as a percentage of the brachial artery post occlusion diameter increase in relation to the baseline values {[BAFMD = (POBAD – BBAD)/BBAD] x 100 %}
Statistical analysis - The Shapiro-Wilk test was used to analyze the normality of the measurement distribution. The correlation between the test and retest values obtained on the same and separate days was determined using the intraclass correlation coefficient (ICC). An ANOVA with repeated measures was used to identify differences between the values obtained during the tests and retests.
The Pearson correlation coefficient, between the mean values for the test and retest results, and the difference between each pair of measurements, was determined to evaluate if the data presented an heteroscedastic error. This coefficient was also used to determine the relationship between BBAD and BAFMD.
The coefficients of variation (CV) was established for every subject by dividing the standard deviation for each pair of measurements by their mean values (CV = [(SD/mean)*100] Next, the mean CV was calculated using the mean of the individual VCs.
Statistical significance was established as p < 0.05. All analyses were conducted using the statistic software package, SPSS 11.0. (SPSS Inc., Chicago, USA)
The method suggested by Bland and Altman14 was used to
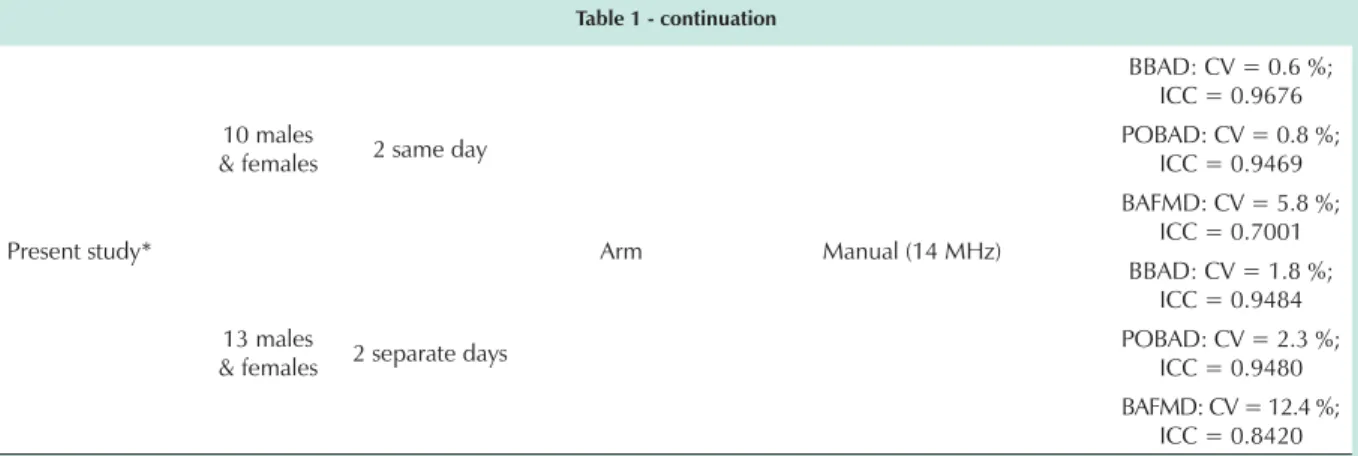
determine the degree of concordance between the pairs of Table 1 - continuation
Present study*
10 males
& females 2 same day
Arm Manual (14 MHz)
BBAD: CV = 0.6 %; ICC = 0.9676 POBAD: CV = 0.8 %;
ICC = 0.9469 BAFMD: CV = 5.8 %;
ICC = 0.7001
13 males
& females 2 separate days
BBAD: CV = 1.8 %; ICC = 0.9484 POBAD: CV = 2.3 %;
ICC = 0.9480 BAFMD: CV = 12.4 %;
ICC = 0.8420
measurements obtained on the same and separate days. The coefficient of repeatability (CR) was obtained by multiplying the standard deviation (SD) of the differences between the test and retest by 1.96.
TEM was established as the result of the ratio between the SD of the differences obtained from the pairs of same day measurements and the square root of 2, (TEM = SD/¥2) as
suggested by Hopkins15.
Results
The Shapiro-Wilk test indicated that the BBAD measurement values presented normal distribution for the tests conducted on the same and separate days. However, the BAFMD values only presented normal distribution for the measurements
taken on separate days (p = 0.001).
The ANOVA results did not identify any significant differences between the pairs of measurements obtained on the same or separate days for any of the variables. The highest CVs were found in the separate day values for both measurements. In relation to ICC, all were statistically significant, however the ICC for the same day measurements was lower than the ICC for the separate day measurements of BAFMD (0.7001 versus 0.8420, respectively) (Tables 2 and 3).
None of the Pearson correlations between the mean values obtained during the tests and retests or the differences between each pair of measurements were statistically significant, indicating that the variables did not present heteroscedastic errors. For the same and separate days BBAD
Fig. 1 -Typical example of baseline (above) and post reactive hyperemia (below) brachial artery ultrasound images.
BAFMD
Table 2 - Decriptive values, mean variation coefficient (VC) and intraclass correlation coefficient (ICC) of the brachial artery baseline (BBAD) and post occlusion (POBAD) diameters taken on the same day and brachial artery flow-mediated dilatation (BAFMD).
Variable Mean ± SD VC ICC
R P
BBAD
Measurement 1 Measurement 2
3.4 ± 0.3 mm
3.6 ± 0.3 mm 0.6% 0.9676 0.0000
POBAD
Measurement 1 Measurement 2
4.1 ± 0.3 mm
4.2 ± 0.4 mm 0.8% 0.9469 0.0000
BAFMD
Measurement 1 Measurement 2
19.9 ± 5.0%
19.6 ± 4.8% 5.8% 0.7001 0.0082
SD - standard deviation.
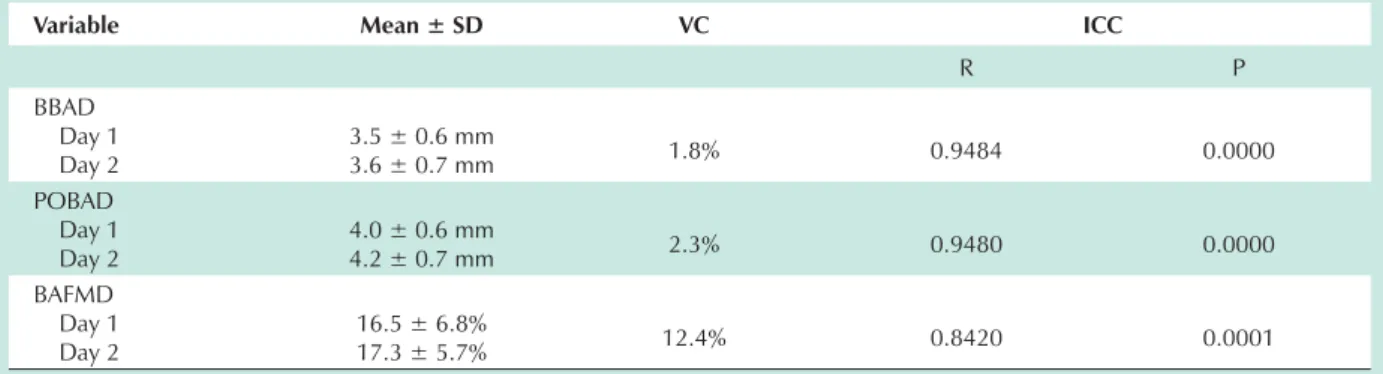
Table 3 - Descriptive values, mean variation coefficient (VC) and intraclass correlation coefficient (ICC) of the brachial artery baseline (BBAD) and post occlusion (POBAD) diameters taken on separate days and brachial artery flow-mediated dilatation (BAFMD).
Variable Mean ± SD VC ICC
R P
BBAD Day 1 Day 2
3.5 ± 0.6 mm
3.6 ± 0.7 mm 1.8% 0.9484 0.0000
POBAD Day 1 Day 2
4.0 ± 0.6 mm
4.2 ± 0.7 mm 2.3% 0.9480 0.0000
BAFMD Day 1 Day 2
16.5 ± 6.8%
17.3 ± 5.7% 12.4% 0.8420 0.0001
SD - standard deviation.
measurements, the respective correlations found were: r = 0.180 and r = -0.517, and for BAFMD, r = 0.540 and r = 0.322 (p > 0.05).
No significant correlation was found between BBAD and BAFMD for the same day measurements (r = -0.247; P = 0.491) or the separate day measurements (r = -0.457; p = 0.116).
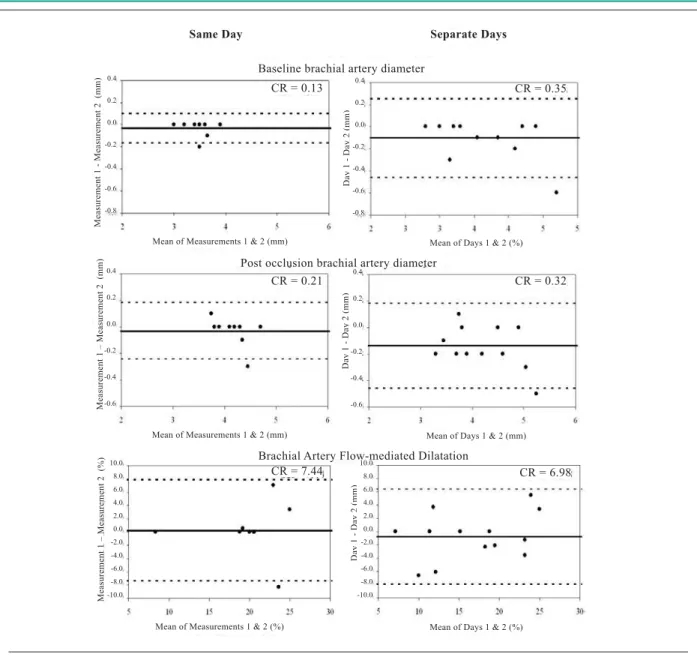
The Bland-Altman graphs demonstrating the degree of concordance between the pairs of measurements obtained on the same and separate days with their respective CRs are shown in Figure 2. The limits of agreement and the mean values for the differences between the tests and retests are shown in Table 4. For each of the same day measurement variables, one subject did not fall within the limits of concordance. The same trend was seen for BBAD and POBAD for the separate day measurements; however, in the case of BAFMD two subjects did not fall within the concordance limits.
TEMs for BBAD, POBAD and BAFMD were, respectively, 0.05 mm (1.4%), 0.07 mm (1.8%) and 2.7% (13.8%) for the same day tests. For the separate day measurements the TEMs were 0.13 mm (3.5%) for BBAD; 0.11 mm (2.7%) for POBAD; and 2.5% (14.9 %) for BAFMD.
Discussion
Little variability was observed for the same and separate day BBAD measurements. For the same day measurements, Mannion et al6 observed a mean test- retest difference similar
to the present study (0.07 ± 0.07 mm versus -0.030 ± 0.067 mm), and Hijmering et al16found a 1.1% CV. In relation to
measurement stability, other authors found CVs ranging from 0.36%17 to 12.7%8.
Little information is available in relation to the reliability of the POBAD measurement. In regard to internal consistency, previous results indicate mean test – retest differences greater than those found in the present study (0.14 mm – SD not reported6 versus -0.030 ± 0.106 mm) as well as higher CVs for
measurement stability (CV = 5.2%18 to 11.4%8 versus 2.3%).
The BAFMD values obtained in the present study were greater than those described in literature for healthy individuals using blood flow occlusion in the arm (9.8%6
and 13.1%19 versus 16.5% to 19.9% in the present study).
In accordance with results of a recent meta analysis20, the
Table 4 - Results of the Bland-Altman analysis (mean of the test-retest differences and concordance limits) of the brachial artery baseline (BBAD) and post occlusion (POBAD) diameters and brachial artery flow-mediated dilatation (BAFMD).
Variable Mean ± SD of the differences Concordance limits
BBAD Same day Separate days
-0.030 ± 0.067 mm 0.100 ± 0.178 mm
-0.165 – 0.105 mm -0.456 – 0.256 mm POBAD
Same day Separate days
-0.030 ± 0.106 mm -0.138 ± 0.161 mm
-0.242 – 0.182 mm -0.460 – 0.183 mm BAFMD
Same day Separate days
0.255 ± 3.79 % 0.803 ± 2.52 %
-7.333 – 7.843 % -4.244 – 5.850 %
SD - standard deviation.
Fig. 2 -Bland-Altman analysis showing the absolute and mean differences between the test and retest. Graphs on the left - Same day measurements. Graphs on the right - Separate day measurements; CR - coefficient of repeatability.
Same Day Separate Days
Baseline brachial artery diameter
Post occlusion brachial artery diameter
Mean of Days 1 & 2 (%) Mean of Measurements 1 & 2 (mm)
D
a
y 1 - D
a
y 2 (m
m ) M e a sure m e nt
1 - M
e a sure m e nt
2 (m
m
)
CR = 0.13
CR = 0.21
CR = 7.44 CR = 6.98
Mean of Measurements 1 & 2 (mm)
Mean of Days 1 & 2 (%) Mean of Measurements 1 & 2 (%)
Mean of Days 1 & 2 (mm)
Brachial Artery Flow-mediated Dilatation
CR = 0.32 CR = 0.35
D
a
y 1 - D
a
y 2 (m
m ) M e a sure m e nt
1 – M
e a sure m e nt
2 (m
m
)
D
a
y 1 - D
a
y 2 (m
m ) M e a sure m e nt
1 – M
e a sure m e nt
2 (%)
The reliability of the BAFMD measurement has also revealed a great deal of discrepancy in the various studies (CV ranging from 1.8%11 to 84%12 – Table 1). The CV values
observed in the present study were 5.8% and 12.4% for the same and separate day measurements, respectively. These values are higher than those found in biochemical analyses of important variables for clinical diagnosis and monitoring such as blood concentrations of total cholesterol and high density lipoprotein (HDL) cholesterol. Pereira et al21 found VC of 3.0% for the separate day measurements
of each of these variables.
The BAFMD measurement, using the noninvasive US technique, originally predicted the onset of reactive hyperemia as a result of the blood flow occlusion caused by positioning the cuff on the arm1. Currently, blood occlusion on the
forearm or wrist is more popular since it appears to express dilatation promoted exclusively by nitric oxide (NO)22. Using
distal occlusion, the BAFMD values are lower than those observed after proximal arm occlusion6(6.8 ± 3.8% versus
9.8 ± 5.7%, respectively.) However, the cuff placement site does not appear to affect BAFMD reliability6.
Apparently, the most important consideration is the time course between the release of the flow and the POBAD reading, that varies according to the technique used. Berry et al23 demonstrated that the highest BAFMD values for a forearm
occlusion were observed roughly 49 ± 3 seconds after the blood flow release, whereas upper arm occlusions produced peak BAFMD values approximately 71 ± 5 seconds after cuff removal (p < 0.01).
According to Doshi et al22, the fact that forearm occlusion
promotes exclusively NO mediated hyperemia is not sufficient to determine the abandon of the upper arm occlusion technique. Since the dilatation provoked by placing the cuff on the forearm is limited, which makes it difficult to identify the discriminatory values to distinguish endothelial dysfunction and modifications induced by diet and/or exercise.
Another important factor is the occlusion duration. Leeson et al7 demonstrated that the maximum artery
responses are obtained after a forearm occlusion period of 4 to 5 minutes and that no additional effects are obtained with longer occlusion timeframes. Bots et al20 demonstrated
that most (~ 51%) of the studies use occlusion durations greater than 4.5 minutes.
Another variable that can affect measurement reliability is the transducer frequency. Herrington et al8 compared BAFMD
stability measured in the M line (interface between the media and adventitia artery layers) and observed significantly better measurement results using 13 MHz transducers (CV = 26.3%) in comparison to 7.5 MHz transducers (CV = 45.3%).
In the present study, the occlusion was maintained for 5 minutes, the POBAD measurement was taken 60 to 90 seconds after releasing the flow and a 14MHz transducer was used, therefore demonstrating that sufficient care was taken to obtain the desired response.
Siber et al24 demonstrated that BAFMD is proportional
to the postischemic hyperemia response; however, the hyperemic stimulus is greater in smaller arteries due to the
smaller radius. Therefore, depending on the BBAD, higher BAFMD values can be found, which does not necessarily reflect better artery function. In the present study, no significant correlations were found between BBAD and BAFMD, which agrees with the observations of Šejda et al25 but disagrees with
the results of Herrington et al8.
Analysis of the Bland-Altman graphs indicated that the study variables did not present heteroscedastic or absolute systematic errors, that is, the differences between the test and retest have no significant relation with the measurement magnitude and do not present systematically positive or negative trends. The mean differences between the test and retest were close to zero for all measurements; however, the limits of agreement for the same and separate day BAFMD values were high (Table 4 and Figure 2) demonstrating that in some subjects the differences between the test and retest were high.
This observation, alongside the awareness of TEM (2.5 percent points in the present study), confirms that clinical significance can only be considered for modifications that are greater than TEM, in order to eliminate interferences caused by evaluator inaccuracy and biological measurement variability when using BAFMD as a dependent variable in surgical studies. However, consideration should be given to the fact that hematological variables that could affect BAFMD measurement variability5, such as blood lipid
concentrations and systemic blood pressure, were not controlled in the present study.
For the most part, the studies available in literature obtain the measurements from VHS tape recordings10,12,19,23 or
semi-automatic measurements using computer programs developed for this purpose17,26. These procedures reduce an important
source of measurement error, which is the experience of the ultrasonographer9, making comparison with the results of the
present study more difficult.
Woodman et al17, comparing the reliability of manual
and semi-automatic measurements using software, observed significantly better results with the support of a computerized system. The respective CVs for the manual and semi-automatic techniques were: 1.4% and 0.4% for the BBAD measurements (p < 0.05) and 24.8% and 6.7% for BAFMD (p < 0.05).
However, in a clinical setting, manual records of BBAD and POBAD measurements are more feasible than the measurements that depend on VHS tape recordings or software, as they are quicker and easier to obtain.
References
1. Celermajer DS, Sorensen KE, Gooch VM, Spiegelhalter DJ, Miller OI, Sullivan ID, et al. Non-invasive detection of endothelial dysfunction in children and adults at risk of atherosclerosis. Lancet. 1992; 340 (8828): 1111-5.
2. Corretti MC, Anderson TJ, Benjamin EJ, Celermajer D, Charbonneau F, Creager MA, et al. Guidelines for the ultrasound assessment of endothelial-dependent flow-mediated vasodilation of the brachial artery: a report of the International Brachial Artery Reactivity Task Force. J Am Coll Cardiol. 2002; 39: 257-65.
3. Patel AR, Kuvin JT, Sliney KA, Rand WM, Chiang JC, Udelson JE, et al. Gender-based differences in brachial artery flow-mediated vasodilation as an indicator of significant coronary artery disease. Am J Cardiol. 2005; 96: 1223-6.
4. Chequer G, Nascimento BR, Navarro TP, Falqueto EB, Alencar MCN, Miranda MCR, et al. Espessamento médio-intimal da carótida e função endotelial na doença arterial coronariana. Arq Bras Cardiol. 2006; 87 (2): 84-90.
5. Moens AL, Goovaerts I, Claeys MJ, Vrints CJ. Flow-mediated vasodilation: a diagnostic instrument, or an experimental tool? Chest. 2005; 127: 2254-63.
6. Mannion TC, Vita JA, Keaney JF Jr, Benjamin EJ, Hunter L, Polaka JF. Non-invasive assessment of brachial artery endothelial vasomotor function: the effect of cuff position on level of discomfort and vasomotor responses. Vasc Med. 1998; 3: 263-7.
7. Leeson P, Thorne S, Donald A, Mullen M, Clarkson P, Deanfield J. Non-invasive measurement of endothelial function: effect on brachial artery dilatation of graded endothelial dependent and independent stimuli. Heart. 1997; 78: 22-7.
8. Herrington DM, Fana L, Druma M, Riley WA, Pussera BE, Crouse JR, et al. Brachial flow-mediated vasodilator responses in population-based research: methods, reproducibility and effects of age, gender and baseline diameter. Circulation. 2000; 8(5): 319-28.
9. Welsch MA, Allen JD, Geaghan JP. Stability and reproducibility of brachial artery flow-mediated dilation. Med Sci Sports Exerc. 2002; 34(6): 960-5.
10. Malik J, Wichterle D, Haas T, Melenovsky V, Simek J, Stulc T. Repeatability of noninvasive surrogates of endothelial function. Am J Cardiol. 2004; 94: 693-6.
11. Sorensen KE, Celermajer DS, Spiegelhalter DJ, Georgakopoulos D, Robinson J, Thomas O, et al. Non-invasive measurement of human endothelium dependent arterial responses: accuracy and reproducibility. Br Heart J. 1995; 74: 247-53.
12. De Roos NM, Siebelink E, Bots ML, Van Tol A, Schouten EG, Katan MB. Trans monounsaturated fatty acids and saturated fatty acids have similar effects on postprandial flow-mediated vasodilation. Eur J Clin Nutr. 2002; 56: 674-9.
13. Atkinson G, Nevill AM. Statistical methods for assessing measurement error (reliability) in variables relevant to sports medicine. Sports Med. 1998; 26 (4): 217-38.
14. Bland JM, Altman DG. Statistical methods for assessing agreement between two methods of clinical measurement. Lancet. 1986; 8: 307-10.
15. Hopkins WG. Measures of reliability in sports medicine and science. Sports Med. 2000; 30 (1): 1-15.
16. Hijmering ML, Stroes ESG, Pasterkamp G, Sierevogel M, Banga JD, Rabelink TJ. Variability of flow mediated dilation: consequences for clinical application. Atherosclerosis. 2001; 157: 369-73.
17. Woodman RJ, Playford DA, Watts GF, Cheetham C, Reed C, Taylor RR, et al. Improved analysis of brachial artery ultrasound using a novel edge-detection software system. J Appl Physiol. 2001; 91: 929-37.
18. West SG, Wagner P, Schoemer SL, Hecker KD, Hurston KL, Krick AL, et al. Biological correlates of day-to-day variation in flow-mediated dilation in individuals with Type 2 diabetes: a study of test-retest reliability. Diabetologia. 2004; 47: 1625-31.
19. Liang Y, Teede H, Kotsopoulos D, Shiel L, Cameron JD, Dart AM, et al. Non-invasive measurements of arterial structure and function: repeatability, interrelationships and trial sample size. Clin Sci. 1998; 95: 669-79.
20. Bots ML, Westerink J, Rabelink TJ, Koning EJP. Assessment of flow-mediated vasodilatation (FMD) of the brachial artery: effects of technical aspects of the FMD measurement on the FMD response. Eur Heart J. 2005; 26: 363-8.
21. Pereira MA, Weggemans RM, Jacobs DR Jr, Hannan PJ, Zock PL, Ordovas JM, et al. Within-person variation in serum lipids: implications for clinical trials. Int J Epidemiol. 2004; 33: 534-41.
22. Doshi SN, Naka KK, Payne N, Jones CJH, Ashton M, Lewis MJ, et al. Flow-mediated dilatation following wrist and upper arm occlusion in humans: the contribution of nitric oxide. Clin Sci. 2001; 101: 629-35.
23. Berry KL, Skyrme-Jones RAP, Meredith IT. Occlusion cuff position is an important determinant of the time course and magnitude of human brachial artery flow-mediated dilation. Clin Sci. 2000; 99: 261-7.
24. Silber HA, Ouyang P, Bluemke DA, Gupta SN, Foo TK, Lima JAC. Why is flow-mediated dilation dependent on arterial size? Assessment of the shear stimulus using phase-contrast magnetic resonance imaging. Am J Physiol Heart Circ Physiol. 2005; 288: H822–8.
25. Šejda T, Pit’há J, Švandová E, Poledne R. Limitations of non-invasive endothelial function assessment by brachial artery flow-mediated dilatation. Clin Physiol Funct Imaging. 2005; 25: 58-61.
26. Avest E, Holewijn S, Stalenhoef AFH, Graaf J. Variation in non-invasive measurements of vascular function in healthy volunteers during daytime. Clin Sci. 2005; 108: 425-31.