Echocardiographic Reference Values an a Sample of Asymptomatic
Adult Brazilian Population
Lílian Cláudia Souza Ângelo, Marcelo Luiz Campos Vieira, Sérgio Lamêgo Rodrigues, Renato Lírio Morelato, Alexandre
C. Pereira, José Geraldo Mill, José Eduardo Krieger
Instituto do Coração do Hospital das Clínicas - FMUSP, Universidade Federal do Espírito Santo - São Paulo, SP - Espírito Santo, ES - Brazil
Summary
Objective: To determine echocardiographic reference values for cardiac chambers, left ventricular mass, and left ventricular (LV) mass indexes in an asymptomatic adult population sample.
Methods: This was an observational study based on a randomly selected population sample from the city of Vitória, Brazil. Two hundred and ninety-five volunteers (61.7% women) with no past history of cardiovascular disease underwent transthoracic echocardiography. The following M-mode echocardiographic parameters were measured: ventricular diameters, interventricular septal thickness, LV posterior wall thickness, LV mass, left ventricular mass indexes, plus aortic and left atrial diameters. Values were expressed as mean and standard deviation and percentiles, with a 95% confidence interval.
Results: Echocardiographic values were slightly influenced by gender and age. Overall, cardiac measurements were higher in the male gender. LV posterior wall thickness, mass indexes corrected for height and diastolic diameter were influenced by age. The 95% percentiles of interventricular septum and LV posterior wall were 9.9 mm and 9.6 mm for men, respectively, and 9.3 mm for septum and posterior wall for women.
Conclusion: The 95% percentile values of interventricular septum and posterior wall and, therefore, of both absolute and indexed left ventricular mass found in our study conducted in the Vitória population are lower than those reported in previous studies. In this framework, our results will be useful as a reference, since they are consistent with the new limits suggested in the literature for the echocardiographic diagnosis of left ventricular hypertrophy. (Arq Bras Cardiol 2007;89(3):168-173)
Key words: Reference values; echocardiography; population/Brazil; random and systematic sampling.
Mailing address: Lílian Cláudia Souza Ângelo •
Rua Joaquim Lírio, 500/901 - 29055-460 - Vitória, ES - Brazil E-mail: [email protected]
Manuscript received August 17, 2006; revised manuscript received March 28, 2007; accepted April 24, 2007.
were selected by random sampling of the population. Study subjects were assessed according to gender, and those with cardiovascular disease, hypertension, or taking cardiovascular medication were excluded7. In most studies reported in the literature, sample sizes ranged from 120 to 200 subjects, which are less than ideal for establishing reference values for the population8. In the present study, echocardiographic reference values for cardiac chambers, left ventricular mass, and left ventricular mass indexes were determined in 295 asymptomatic adults with no cardiovascular disease living in the urban area of Vitória.
Methods
This study was conducted in Vitória, state of Espirito Santo, Brazil, according to the guidelines established by the WHO MONICA Project (The World Health Organization MONICA Project: monitoring trends and determinants in cardiovascular diseases)9. The study sample was chosen after a random selection of households in 1999, when 2068 subjects were invited to participate in the study, out of a population of 142,913 people of both genders with ages ranging from 25 to 64 years. According to the IBGE 2000 census, Vitória had 298,000 inhabitants that year,
Introduction
Echocardiography is a very important diagnostic imaging modality in the clinical practice of cardiology. Although it has been extensively used as a diagnostic tool, few studies are available in the literature that establish echocardiographic reference values for the normal population. Thus, the echocardiographic measurements currently used are often based on values derived from small, non-randomized samples1,2.
142,913 of whom fell into the age group targeted by the study (45.9% men and 54.1% women). Census tracts, and households within them, were randomly selected. In each household, the person whose birthday was coming up next was selected. Of the selected subjects, 1661 agreed to participate in the study and went to the Hospital das Clínicas of the Universidade Federal do Espírito Santo for clinical and laboratory examination so that the prevalence of cardiovascular risk factors could be determined.
In 2004 and 2005, these subjects were recruited again for the continuation phase of the WHO MONICA Project in Vitoria and underwent repeat clinical and laboratory evaluation, in addition to echocardiographic examination. Of the initial sample, 652 agreed to participate in the second phase of the study. To create a subsample of normal subjects, those who were hypertensive, using anti-hypertensive medication, or obese (body mass index equal to or greater than 30) were excluded from the study, as were those with any sign of abnormality on the clinical cardiovascular examination. Based on these criteria, a subsample of 295 subjects was selected.
Subjects were enrolled in the study after signing an Informed Consent previously approved by the Research Ethics Committee of the Centro de Ciências da Saúde of the
Universidade Federal do Espírito Santo (UFES). Each subject’s
blood pressure was measured three times in the sitting position after a five-minute rest by trained examiners using mercury sphygmomanometers. Arterial hypertension was
defined as systolic pressure ≥140 mm Hg and/or diastolic pressure ≥90 mm Hg. Subjects who reported taking any
antihypertensive medication within two weeks prior to the study, even irregularly, were also considered hypertensive and excluded from the study.
Echocardiographic examinations were performed using commercially available equipment, the Acuson-Sequoia™ Ultrasound System (Acuson, Mountain View, CA, USA), equipped with a 2 to 3.5 MHz multifrequency transducer, of the echocardiography department of the Hospital das Clínicas
of UFES. Transthoracic echocardiograms were obtained by a single, trained observer, with ten years of experience in echocardiography, blind to all clinical and laboratory data.
Echocardiographic images were acquired with subjects lying in the left lateral decubitus after a 10-minute rest. Examinations provided adequate visualization of interfaces, with simultaneous visualization of the septum, LV internal diameter, and LV posterior wall. Left ventricular, right ventricular, aortic and left atrial diameters were all measured according to the American Society of Echocardiography (ASE) recommendations10 using the M-mode technique. In all patients, left ventricular diastolic diameter, interventricular septal thickness, and left ventricular posterior wall thickness were measured at end-diastole, defined as the peak of the R-wave on simultaneous ECG. Systolic diameter was measured at the time the LV posterior wall was closest to the septum (first frame just after the end of the T-wave), which also corresponds to the minimal internal dimension. The mean value of three consecutive measurements was considered.
Left ventricular mass was calculated using the modified ASE formula proposed byDevereux et al11: mass = 0.8 {1.4 [(IVS +
LVDD + PW) – LVDD]} + 0.6 g; where IVS is interventricular septal thickness, LVDD is LV diastolic diameter, and PW is LV posterior wall thickness. Left ventricular mass was indexed for body surface area, according to the DuBois formula12, and also for height, height2.13 and height2.7, as proposed by Simone et al13.
Relative wall thickness (RWT) was calculated as twice the LV posterior wall thickness divided by LV diastolic diameter. Left ventricular systolic function was assessed by the ejection fraction, derived from the Teichholz formula, and by LV fractional shortening. Even though this study was based on a sample of the general population, the Teichholz method was chosen in case hearts exhibiting enlarged diameters were found.
Study results were expressed as means and standard deviation. The following statistical tests were used: the Kolmogorov-Smirnov test for normal distribution of data; Student’s t-test for variables with normal distribution; Mann-Whitney U test for variables with a non-normal distribution; chi-square test for dichotomous variables, when appropriate; and Analysis of variance (ANOVA) to compare values between age groups and races. The significance level was set atp< 0.05.All data were analyzed using SPSS version 11.0, Surrey, United Kingdom.
Results
Demographic and laboratory data stratified by gender are shown in Table 1. Blood pressure, serum creatinine, urea, HDL-cholesterol, and waist circumference were higher (p < 0.05) in males, whereas no difference was found in age, blood glucose, total cholesterol and body mass index (p > 0.05) between genders.
The Kolmogorov-Smirnov test was applied, and all echocardiographic variables analyzed in this study are normally distributed. Therefore, the upper limit of normal for each variable was defined as the 95% percentile.
As expected, several echocardiographic parameters showed a slight increase in male subjects (Table 2). Measurements of cavity sizes and cardiac thickness and mass, as well as the different mass indexes and aortic and left atrial diameters, were significantly higher in male subjects (p < 0.05), while LV fractional shortening was higher in female subjects (p < 0.05). Maximal septal and posterior wall thickness was found to be normal in both men (9.9 mm and 9.6 mm, respectively) and women (9.3 mm and 9.3 mm). M-mode echocardiographic measurements are described in Table 2. Table 3 shows the 5% and 95% percentiles of the echocardiographic parameters analyzed.
Table 4 summarizes the echocardiographic parameters of the study sample stratified by age group. Statistically significant differences were found in left ventricular posterior wall thickness, relative wall thickness, and mass indexed for height2,13 and height2,7. Table 5 depicts the 5% and 95% percentiles for each age group.
No association was found between race and the several echocardiographic parameters analyzed (dada not shown).
Table 1 – Demographic and laboratory characteristics of the study population
Male (n = 113)
Female
(n = 182) p
Age (years) 47.1 (9.8) 48.1 (12.6) 0.5
SBP* (mm Hg) 119.8 (8.2) 115.9 (11.3) 0.001
DBP† (mm Hg) 79,5 (5,7) 75,7 (6,9) < 0.001
Blood glucose (mg/dl) 92,9 (19) 89.3 (20.4) 0.14
Creatinine (mg/dl) 1.1 (0.2) 0.9 (0.2) < 0.001
Urea (mg/dl) 29.7 (7.7) 26.4 (6.6) < 0.001
Total cholesterol (mg/dl) 196.8 (70) 198.5 (37) 0.79
HDL-cholesterol (mg/dl) 43 (9.9) 50.7 (10.9) < 0.001
BMI ‡ (kg/height2) 24.5 (2.6) 24.1 (3.1) 0.32
Waist circumference (cm) 86.3 (7.7) 78.2 (8.6) <0.001
Data expressed as means and standard deviation: *systolic blood pressure, †diastolic blood pressure, ‡ body mass index and p - statistical significance.
Table 2 – Echocardiographic parameters according to gender: mean (standard deviation)
Parameters Male
(n = 113)
Female
(n = 182) p
LV* diastolic diameter (mm) 49.9 (3.8) 45.5 (3.9) < 0.001
LV systolic diameter (mm) 29,9 (3,4) 26,8 (3,3) < 0,001
IVS thickness † (mm) 8,8 (0.6) 8.1 (0.7) < 0.001
PW thickness‡ (mm) 8.7 (0.6) 8 (0.7) < 0.001
Relative wall thickness 0.35 0.35 0.32
LV mass (g) 154.2 (27.7) 119 (25.1) < 0.001
Mass/body surface (g/m2) 85.1 (13.4) 74.6 (13) < 0.001
Mass/height (g/m) 90.7 (15.2) 75.7 (15.1) < 0.001
Mass/height2.13 (g/m2.13) 50 (8.6) 45.5 (9) < 0.001
Mass/height2.7 (g/m2.17) 37 (6.7) 35.2 (7.1) < 0.001
LV fractional shortening (%) 40.3 (3.6) 40.7 (2.6) 0.03
LV ejection fraction (%) 70.5 (4.8) 71.5 (3.1) 0.27
RV** diastolic diameter (mm) 18.2 (5.3) 16.3 (3.9) 0.052
LA§ diameter (mm) 34.7 (2.5) 31.6 (2.6) 0.001
Aortic diameter (mm) 33.7 (2.3) 30.1 (2.5) <0.001
* Left ventricle, † interventricular septum, ‡ posterior wall, § left atrium,** right ventricle and p - statistical significance.
reviewed by a second observer, and the results showed Pearson correlation coefficients of 0.94 for interventricular septal thickness and LV diastolic diameter; 0.92 for posterior wall thickness, and 0.89 for LV systolic diameter.
Discussion
In this study, based on a sample of 295 inhabitants of Vitória, all asymptomatic and with no cardiovascular disease, we have described mean cardiac dimensions and determined
their 5% and 95% percentiles, which may be used in routine echocardiographic assessments of the Brazilian population. In spite of remarkable advances in ultrasound technology, M-mode is still routinely used in all echocardiography laboratories in Brazil.
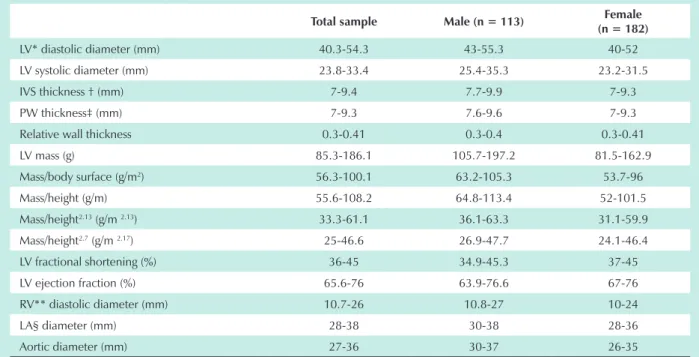
Table 3 – The 5% and 95% percentiles of echocardiographic parameters according to gender
Total sample Male (n = 113) Female
(n = 182)
LV* diastolic diameter (mm) 40.3-54.3 43-55.3 40-52
LV systolic diameter (mm) 23.8-33.4 25.4-35.3 23.2-31.5
IVS thickness † (mm) 7-9.4 7.7-9.9 7-9.3
PW thickness‡ (mm) 7-9.3 7.6-9.6 7-9.3
Relative wall thickness 0.3-0.41 0.3-0.4 0.3-0.41
LV mass (g) 85.3-186.1 105.7-197.2 81.5-162.9
Mass/body surface (g/m2) 56.3-100.1 63.2-105.3 53.7-96
Mass/height (g/m) 55.6-108.2 64.8-113.4 52-101.5
Mass/height2.13 (g/m 2.13) 33.3-61.1 36.1-63.3 31.1-59.9
Mass/height2.7 (g/m 2.17) 25-46.6 26.9-47.7 24.1-46.4
LV fractional shortening (%) 36-45 34.9-45.3 37-45
LV ejection fraction (%) 65.6-76 63.9-76.6 67-76
RV** diastolic diameter (mm) 10.7-26 10.8-27 10-24
LA§ diameter (mm) 28-38 30-38 28-36
Aortic diameter (mm) 27-36 30-37 26-35
* Left ventricle, † interventricular septum, ‡ posterior wall, § left atrium and ** right ventricle.
Table 4 – Echocardiographic parameters according to age group: mean (standard deviation)
30-39 years (n = 57)
40-49 years (n= 39)
50-59 years (n = 75)
≥60 years
(n = 37) p
LV* diastolic diameter (mm) 47.3 (4.9) 47.1 (4.2) 46.7 (3.8) 47.8 (5.3) 0.5
LV systolic diameter (mm) 27.9 (4.8) 28.1 (3.2) 27.5 (2.5) 28.6 (4.7) 0.6
IVS thickness† (mm) 8.1 (0.8) 8.4 (0.8) 8.5 (0.8) 8.5 (0.6) 0.2
PW thickness‡ (mm) 7.9 (0.8) 8.2 (0.7) 8.5 (0.7) 8.5 (0.7) 0.001
Relative wall thickness 0.34 (0.03) 0.35 (0.03) 0.36 (0.03) 0.36 (0.03) <0.001
LV mass (g) 128 (35) 130 (28) 133 (28) 139 (35) 0.35
Mass/body surface (g/m2) 75.1 (14.3) 77.9 (13.1) 80 (13) 83.9 (17.2) 0.11
Mass/height (g/m) 77.1(18.5) 80.1 (15.3) 82.5 (15.6) 86.2 (19.4) 0.055
Mass/height2.13 (g/m2.13) 43.7 (9.3) 46.4 (8.4) 48.4 (8.6) 50.6 (10.4) 0.002
Mass/height2.7 (g/m2.17) 32.8 (6.7) 35.3 (6.6) 37 (6.7) 38.7 (7.8) <0.001
LV fractional shortening (%) 40.1 (2.5) 40.4 (3) 41 (2.7) 40.4 (4.3) 0.41
LV ejection fraction (%) 70.7 (3.2) 70.9 (3.8) 71.8 (3) 70.7 (1) 0.35
RV** diastolic diameter (mm) 18.7 (4.4) 16.5 (4.1) 16.6 (4.7) 16.2 (4.3) 0.04
LA§ diameter (mm) 32.2 (3.3) 32.5 (3.1) 32.8 (2.6) 33.6 (2.8) 0.17
Aortic diameter (mm) 30.7 (3.1) 31.1 (3.1) 31.7 (2.6) 32.5 (2.9) 0.046
* Left ventricle, † interventricular septum, ‡ posterior wall, § left atrium,** right ventricle and p - statistical significance.
Our results are close to those found in previous international studies5,14. It should be noted that the 95% percentiles of the septum and left ventricular posterior wall are lower than those
Schvartzman et al7, who found lower septal and posterior wall values, defined by the 95% percentile, in a random sample of one hundred subjects from the urban population of Porto Alegre.
Our values for left ventricular mass and left ventricular mass indexes are similar to those reported by Ilercil et al14, who, in a population-based study with different races focused on the American population, described reference limits for LV mass index for the diagnosis of myocardial hypertrophy that differed from those reported in earlier studies, suggesting a change in these limits for the diagnosis of left myocardial hypertrophy, considered an important risk factor for cardiovascular disease15.
In our study, left ventricular mass values were significantly higher in men than in women, even after indexation for body surface area, which is consistent with Shub et al’s findings16. After indexation for height, height2,3, and height2,7, LV mass values were found to be higher in male subjects. This indicates that left ventricular mass values are higher in men, regardless of the indexation method used.
Mean left atrial diameters were statistically significantly higher in male subjects. Mean aortic root diameters were similar to those found by Ilercil et al14 in the American population, and these values were also significantly greater in men than in women.
In our study, LV posterior wall thickness and LV mass correlated with age only when LV mass was indexed for height2,13and height2,7. When LV mass was indexed for height, there was a trend for association. This weak association with age corroborates the findings from previous studies14,16.
We concluded that the 95% percentiles for interventricular septum and posterior wall and, thereby, for the absolute and indexed left ventricular mass found in our study are lower
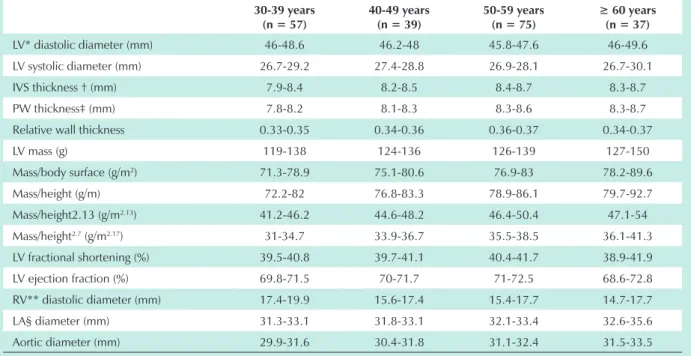
Table 5 – The 5% and 95% percentiles of echocardiographic parameters according to age groups
30-39 years (n = 57)
40-49 years (n = 39)
50-59 years (n = 75)
≥ 60 years (n = 37)
LV* diastolic diameter (mm) 46-48.6 46.2-48 45.8-47.6 46-49.6
LV systolic diameter (mm) 26.7-29.2 27.4-28.8 26.9-28.1 26.7-30.1
IVS thickness † (mm) 7.9-8.4 8.2-8.5 8.4-8.7 8.3-8.7
PW thickness‡ (mm) 7.8-8.2 8.1-8.3 8.3-8.6 8.3-8.7
Relative wall thickness 0.33-0.35 0.34-0.36 0.36-0.37 0.34-0.37
LV mass (g) 119-138 124-136 126-139 127-150
Mass/body surface (g/m2) 71.3-78.9 75.1-80.6 76.9-83 78.2-89.6
Mass/height (g/m) 72.2-82 76.8-83.3 78.9-86.1 79.7-92.7
Mass/height2.13 (g/m2.13) 41.2-46.2 44.6-48.2 46.4-50.4 47.1-54
Mass/height2.7 (g/m2.17) 31-34.7 33.9-36.7 35.5-38.5 36.1-41.3
LV fractional shortening (%) 39.5-40.8 39.7-41.1 40.4-41.7 38.9-41.9
LV ejection fraction (%) 69.8-71.5 70-71.7 71-72.5 68.6-72.8
RV** diastolic diameter (mm) 17.4-19.9 15.6-17.4 15.4-17.7 14.7-17.7
LA§ diameter (mm) 31.3-33.1 31.8-33.1 32.1-33.4 32.6-35.6
Aortic diameter (mm) 29.9-31.6 30.4-31.8 31.1-32.4 31.5-33.5
* Left ventricle, † interventricular septum, ‡ posterior wall, § left atrium and ** right ventricle.
than those reported in previous studies. In this regard, our results are in keeping with the new limits suggested in the medical literature for the echocardiographic diagnosis of left ventricular hypertrophy.
We recognize that the M-mode echocardiographic quantification of LV dimensions presents a drawback in the event of changes in segmental contractility and dilated ventricles. We used M-mode echocardiography because this method remains the most widely used in clinical practice, and also because our study sample consisted of normal subjects with no history of coronary or valvular disease. To minimize possible errors, we followed the measurement standardization in accordance to the American Society of Echocardiography, corroborated by the recommendations of the latest international guidelines for LV quantification17.
Due to ongoing technological advances, further studies might be able to use three-dimensional echocardiography for quantitative analyses of cardiac chamber size, morphology and function. This modality of echocardiographic study may be very useful in clinical research2, since it allows ventricular geometry, mass, and volumes to be measured without using mathematical formulas and equations that are not always well adapted to the actual cardiac anatomy.
Potential Conflict of Interest
No potential conflict of interest relevant to this article was reported.
Study Association
References
1. Weiman AE. Principles and practice of echocardiography. 2nd. ed. Philadelphia: Lea & Febiger; 1994.
2. Otto C. Textbook of clinical echocardiography. 3rd. ed. Philadelphia: W.B. Saunders Company; 2004.
3. Knutsen KM, Stugaard M, Michelsen S, Otterstad JE. M-mode echocardiographic findings in apparently healthy, non-athletic Norwegians aged 20-70 years: influence of age, sex and body surface area. J Intern Med. 1989; 225: 111-5.
4. Trivedi SK, Guptn OP, Jain AP, Jajoo UN, Kample AN, Bharambe MS. Left ventricular M-mode echocardiographic measurements of Indian population. J Assoc Physicians India. 1993; 41: 14-6.
5. Lauer MS, Larson MG, Levy D. Gender-specific reference M-mode values in adults: population-derived values with consideration of the impact of height. J Am Coll Cardiol. 1995; 26: 1039-46.
6. Morcef FAP, Thevenard RS, Fuks J, Azevedo AC. Ecocardiografia: método e valores normais. Arq Bras Cardiol. 1976; 29: 459-65.
7. Schvartzman PR, Fuchs FD, Mello AG, Coli M, Schvartzman M, Moreira LB. Valores normais de medidas ecocardiográficas: um estudo de base populacional. Arq Bras Cardiol. 2000; 75: 107-10.
8. Vasan R, Levy D, Larson M, Benjamin E. Interpretation of echocardiographic measurements: a call for standardization. Am Heart J. 2000;139: 412-22.
9. Tuntall-Pedoe H, for the WHO MONICA Project. The World Health Organization MONICA Project (monitoring trends and determinants in cardiovascular diseases): a major international collaboration. J Clin Epidemiol. 1988;41: 105-14.
10. Sahn DJ, DeMaria A, Kisslo J, Weyman A. The Committee on M-Mode Standartization of the American Society of Echocardiography.
Recommendations regarding quantitation in m-Mode echocardiography: results of a survey of echocardiographic measurements. Circulation. 1978; 6: 1072-83.
11. Devereux RB, Alonso DR, Lutas EM, Gottlieb GJ, Campo E, Sachs I, et al. Echocardiographic assessment of left ventricular hypertrophy: comparison to necropsy findings. Am J Cardiol. 1986; 57: 450-8.
12. Dubois D, Dubois EF. A formula to estimate the approximate surface area if height and weight be known. Arch Intern Med. 1916; 17: 863-71.
13. De Simone G, Kizer JR, Chinali M, Roman MJ, Bella JN, Best LG, et al. Normalization for body size and population-attributable risk of left ventricular hypertrophy. The Strong Heart Study. Am J Hypertens. 2002;18 (2): 191-6.
14. Ilercil A, O’Grady MJ, Roman MJ, Paranicas M, Lee ET, Welty TK, et al. Reference values for echocardiographic measurements in urban and rural populations of differing ethnicity. The Strong Heart Study. J Am Soc Echocardiogr. 2001; 14: 601-11.
15. Levy D, Garrison RJ, Savage DD, Kannel WB, Castelli WP. Prognostic implications of echocardiographically determined left ventricular mass in the Framingham Heart Study. N Engl J Med. 1990; 22: 1561-6.
16. Shub C, Klein AL, Zachariah PK, Bailey KR, Tajik J. Determination of left ventricular mass by echocardiography in a normal population: effect of age and sex in addition to body size. Mayo Clin Proc. 1994; 69: 205-11.