DOI: 10.1590/0004-282X20130124
ARTICLE
Active extravasation of contrast within the
hemorrhage (spot sign): a multidetector
computed tomography finding that
predicts growth and a worse prognosis in
non-traumatic intracerebral hemorrhage
Extravasamento ativo de contraste no interior da hemorragia (spot sign):
um achado de TCMD que prediz crescimento e pior prognóstico nas
hemorragias intraparenquimatosas cerebrais não traumáticas
Marcos Rosa Júnior1, Antônio José da Rocha1, Nelson Saade2,
Antônio Carlos Martins Maia Júnior1, Rubens José Gagliardi3
Intracerebral hemorrhage (ICH) accounts for approxi-mately 10–15% of all strokes1 and has a poor prognosis, with a
30-day mortality rate of approximately 50% and high rates of disability and neurological sequelae2. Computed tomography
(CT) is often the irst imaging test performed on patients with suspected ischemic or hemorrhagic stroke1. Fast acquisition,
wide availability, a relatively low cost, and a high sensitivi-ty for the detection of acute hemorrhage have justiied the
1Section of Neuroradiology, Santa Casa de Misericórdia de São Paulo, São Paulo SP, Brazil;
2Division of Neurosurgery, Santa Casa de Misericórdia de São Paulo, São Paulo SP, Brazil;
3Division of Neurology, Santa Casa de Misericórdia de São Paulo, São Paulo SP, Brazil.
Correspondence: Marcos Rosa Júnior; Rua Dr. Cesário Motta Junior 112 / Vila Buarque; 01221-020 São Paulo SP - Brasil; E-mail: [email protected]
Conflict of interest: There is no conlict of interest to declare.
Received 01 April 2013; Received in inal form 27 May 2013; Accepted 03 June 2013.
ABSTRACT
Intracerebral hemorrhage (ICH) causes high rates of disability and neurological sequelae. Objective: To evaluate spot signs as predictors of expansion and worse prognosis in non-traumatic ICH in a Brazilian cohort. Method: We used multidetector computed tomography angio-graphy to study 65 consecutive patients (40 men, 61.5%), with ages varying from 33 to 89 years (median age 55 years). Clinical and imaging indings were correlated with the indings based on the initial imaging. Results: Of the individuals who presented a spot sign, 73.7% died (in-hospital mortality), whereas in the absence of a spot sign the mortality rate was 43.0%. Although expansion of ICH was detected in 75% of the patients with a spot sign, expansion was observed in only 9.0% of the patients who did not present a spot sign. Conclusions: The spot sign strongly predicted expansion in non-traumatic ICH and an increased risk of in-hospital mortality.
Keywords: spot sign, multidetector computed tomography angiography, hemorrhagic stroke, brain hemorrhage.
RESUMO
A hemorragia intraparenquimatosa cerebral (HIC) apresenta altas taxas de incapacidade e sequela neurológica. Objetivo: Avaliar a presença de spot sign como preditor de expansão e pior prognóstico no follow-up de HIC não-traumática em brasileiros. Método: Usamos a ângio-to-mograia para estudar prospectivamente 65 pacientes consecutivos (40 homens 61,5%), com idades variando de 33 a 89 anos (mediana 55 anos). Evolução clínica e achados de imagem foram correlacionados com a interpretação dos achados do exame inicial. Resultados: 73,7% dos indivíduos com spot sign no estudo tomográico inicial evoluíram para óbito e, na sua ausência, a taxa de mortalidade foi 43,0%. Enquan-to a expansão da HIC foi detectada em 75% dos pacientes com spot sign, ela foi notada em 9% daqueles sem este sinal. Conclusão: O spot sign mostrou-se forte preditor de expansão da HIC não traumática e representa maior risco de morte hospitalar nesta coorte de pacientes.
increase in multidetector computed tomography (MDCT) use during the last decade.
Recent studies have conirmed that expanding hemato-ma occurs in approxihemato-mately 70% of patients undergoing CT scan within the irst 3 hours of stroke, suggesting that cer-tain indings on MDCT angiography are likely predictors of growth hemorrhage3,4. he most important predictor of
mor-tality and neurological disability is the initial volume of the ICH; however, hematoma expansion leads to a conservative prognosis. he presence and characteristics of an active ex-travasation of contrast within the ICH (spot sign) was ini-tially detected on angiography as a predictor of hemorrhage expansion5. his imaging sign has also been reproduced on
MDCT angiography as a robust predictor of expansion and as an indicator of worse prognosis and mortality3,4. MDCT
angiography has been proven to be a rapid and reproducible alternative to catheter angiography that reduces the risks to the enrolled patients and ofers signiicant beneits to the de-cision-making process6-9.
A higher incidence of hemorrhagic stroke has been re -por ted in the Latin American population10–13. Inherited
ethnic factors attributed to miscegenation have been im-plicated in addition to several environmental characteris-tics, such as diet, often pre-existing long-term untreated arterial hypertension, and delayed access of Brazilians to emergency rooms, all of which presumably contribu-te to the worsening health conditions in our population. These features might influence the clinical and/or ima-ging patterns.
To the best of our knowledge, this is the irst MDCT study of primary ICH to examine a large sample of Latin American patients. It remains necessary to reproduce the applicabili-ty of MDCT angiography and to evaluate the efects of he mostatic drugs on this population.
Our primary aims are to study the spot sign characteristic that can be observed on MDCT scans, and to assess the rela-tionship of this inding with mortality and expansion in a co-hort of patients with primary ICH. he relevance of the cur-rent study derives from the potential reproducibility of this procedure within routine evaluations of this common condi-tion, which frequently demands intensive care and is respon-sible for variable neurological sequelae in economically ac-tive persons.
METHODS
Patients
he present study is part of a larger study of the use of MDCT techniques to evaluate hyperacute stroke; conse-quently, the protocols have been separately reviewed and ap-proved by the Institutional Review Board and the local ethics committee.
Patients of any age or gender who presented with brain parenchyma hemorrhage ≥2.0 cm in any axis as demonstra ted by routine non-contrast CT (NCCT) from August 2011 to September 2012 were considered eligible for submission to the protocol. MDCT scanning with comparable imaging parameters, including computed tomography angiography (CTA), was performed within the irst 3 days after the ictus. Informed consent was obtained from all subjects (signed per-sonally or by their guardians).
Primary ICH was diagnosed when systemic hypertension, which was deined as blood pressure ≥140 × 90 mmHg, was the only identiied etiology. We excluded patients whose ICH had occurred more than 3 days previously, those with contra-indications to the intravenous iodine contrast agent, those who refused to participate in the study, and those whose exa-minations included images that were either of inadequate quality or contained technical artifacts.
he clinical data and laboratory results were reviewed to make a systemic arterial hypertension diagnosis. Glycemia (Gl) and blood pressure (BP) were considered according to the level. hese parameters were studied separately, and their inluence on both ICH expansion and inhospital mortality was analyzed. Any other etiology, solely or superimposed on systemic hypertension that could justify ICH, was con-sidered to be additional exclusion criteria. All patients were mo nitored in the intensive care unit or emergency room and treated according to the Brazilian guidelines for the manage-ment of intracerebral hemorrhage14.
All of the imaging examinations were conducted using a minimal dose of both ionizing radiation and intravenous iodinated contrast in a 64-slice CT scanner (Brilliance CT 64 Channel, Philips Medical, Eindhoven, he Netherlands), adding CTA to the previously requested NCCT. he CTA exa mination was performed using 120 kV and 185 milliamperes (mA), a 450mm ield of view (FOV), and a pitch of 0.673. he arterial phase was performed after a time delay of 20 se conds by injecting iodine contrast at 4–6 ml/s in a dualhead po wer injector (Medrad, Warrendale, USA) with an 18G i.v. access, generally located in a peripheral vein, at a total dose of 1.5 ml/kg. he venous phase was obtained using identical parameters 60 seconds after the beginning of contrast admi-nistration. he control CT study was performed using simi-lar parameters, but without contrast (NCCT), according to clinical judgment.
Imaging analysis
All of the studies were evaluated in consensus by two ra-diologists (AJR and MRJr) experienced in the diagnosis of ICH and in the interpretation of CTA. A spot sign was consi dered to be present or absent on CTA-SI according to the following previously deined criteria proposed by Delgado Almandoz and Romero4: one or more focus of contrast pooling within
a hemorrhage (of any size and morphology), discontinuous from normal or abnormal vasculature adjacent to the he -morrhage, and attenuation ≥120 UH.
he hematoma volumes were calculated at the irst NCCT scanning and at imaging follow-up, estimating the three major axes of the hematoma and multiplying the re-sult by 0.52. Extra-axial hemorrhage was not considered in the volume calculations.
To comparatively categorize our cohort of subjects, we considered the number of extravasation foci within the ICH as well as the largest dimension of focus and attenuation in Hounsield Units (HU) to build a spot sign score (SSS), as pre-viously proposed4,15 (Table 1).
Hematoma expansion was deined at the followup NCCT by an absolute growth greater than 6 ml or a relative growth of more than 33% from the initial NCCT3. A poor outcome
was deined as substantial hematoma expansion at followup CT, death, or the need for surgery.
Statistical analysis
Univariate analysis using either Fisher’s exact test or Stu dent’s t test was used to determine the relationship between the presence of the spot sign with the expansion of ICH and hospital mortality. We also used a multivariate logistic regres-sion model to identify the independent predictors of the ex-pansion of the hemorrhage and hospital mortality. he results were considered to be statistically signiicant when p<0.05.
RESULTS
According to the inclusion criteria, 155 subjects were consecutively studied during the deined period. A total of 90
patients (90/155, 58.1%) were subsequently excluded: 25 in-dividuals (25/155, 16.1%) were excluded due to ICH that was attributed to trauma, 46 additional subjects (46/155, 29.7%) were ultimately diagnosed with secondary ICH, 15 others (15/155, 9.7%) were excluded because peripheral venous ac-cess was not possible, two subjects (2/155, 1.3%) had been evaluated more than 72 hours after ictus, and two subjects (2/155, 1.3%) were excluded due to inappropriate technical conditions or the presence of artifacts that hampered the analysis.
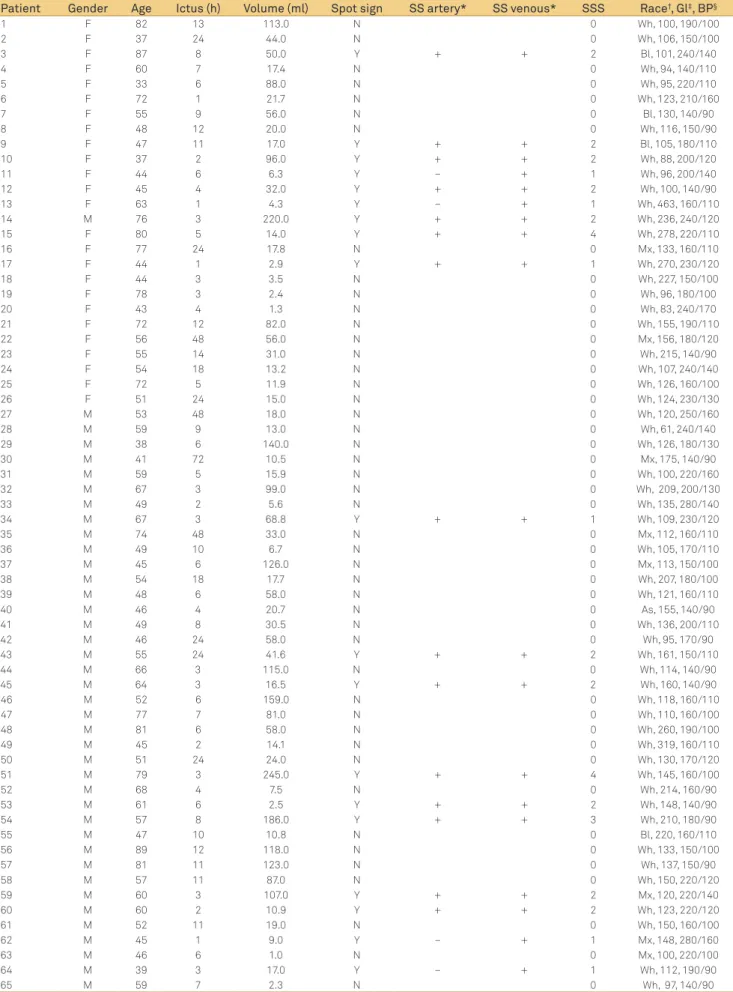
We enrolled 65 subjects with primary ICH to the cur-rent study, with no statistically signiicant diferences with respect to gender or age (p=0.111). Demographic data, BP and Gl levels, ICH volume, and the elapsed time between the stroke and the initial CTA were all measured (Table 2). he spot sign on CTASI was observed in 19 subjects (19/65, 29.2%). he median intracerebral blood volume was 20.7 ml, and the average volume of blood was estimated as 49.4 ml (range 1–245 ml). he average volume was 60.3 ml in the spot signpositive group (range 2.6–245 ml) and 44.9 ml in the spot signnegative group (range 1–159 ml), with no signiicant dif-ference between these groups.
According to Gl levels, patients were divided into two dis-tinct groups (Gl≤140 mg/dl and Gl≥141 mg/dl). According to their BP levels they were also divided into two others groups (BP=140–179×90–109 mmHg and BP≥180×110 mmHg). No statistical relationship was demonstrated between any of these groups and ICH expansion or in-hospital mortality (p>0.05).
All of the spot signs (19/19, 100%) were detected during the venous phase of MDCT angiography in our series of pa-tients (Figure 1). Conversely, the sign was detected in 15 sub-jects during the arterial phase (15/19, 79%).
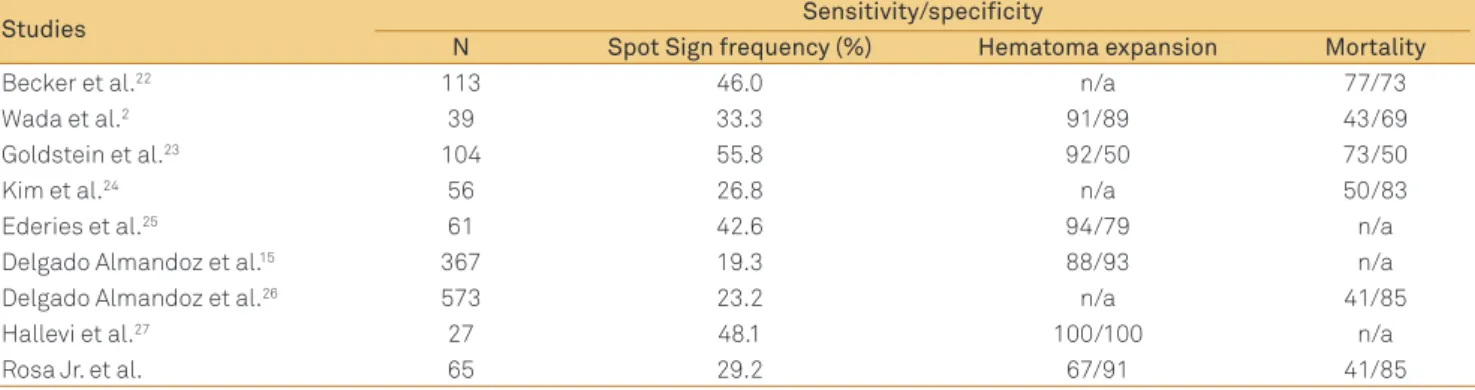
he frequency, sensitivity, and speciicity of the spot sign in our data were compared with previously reported results (Table 3)4. Brain hemorrhage was categorized according to
its SSS (Table 4). When analyzed together, the SSS groups (score 1, 2, 3, and 4) exhibited an expansion of hemorrhage in 75% (6/8) of the cases compared with 9.0% (2/23) of the cases without a spot sign, and this diference was signiicant (p=0.002). Taken together, the SSS groups showed a morta-lity rate of 73.7% (14/19) versus 43.0% (20/46) among the pa-tients who did not present this imaging inding (p=0.029).
When categorizing patients according to the SSS, we found six patients with score 1 (6/19), 10 with score 2 (10/19), one with score 3 (1/19), and two patients with score 4 (2/19). Hemorrhage expansion was observed in 9.0% (2/23) of the patients without a spot sign, in 80% (4/5) of those with score 1, and in 67% (2/3) of those with score 2. All of the patients with scores of 3 and 4 died after the initial CT and did not un-dergo a CT control.
A spot sign was documented in our series of patients only on the irst day, even after the irst 3 hours of ictus, with an Table 1. The spot sign score (SSS), as proposed by
Delgado-Almandoz et al.15.
Spot sign characteristic Points
Number of spot signs
1–2 1
≥3 2
Maximum axial dimension
1–4 mm 0
≥5 mm 1
Maximum attenuation
120–179 HU 0
≥180 HU 1
Table 2. The demographic data, clinical and blood test from our series of patients.
Patient Gender Age Ictus (h) Volume (ml) Spot sign SS artery* SS venous* SSS Race†, Gl‡, BP§
1 F 82 13 113.0 N 0 Wh, 100, 190/100
2 F 37 24 44.0 N 0 Wh, 106, 150/100
3 F 87 8 50.0 Y + + 2 Bl, 101, 240/140
4 F 60 7 17.4 N 0 Wh, 94, 140/110
5 F 33 6 88.0 N 0 Wh, 95, 220/110
6 F 72 1 21.7 N 0 Wh, 123, 210/160
7 F 55 9 56.0 N 0 Bl, 130, 140/90
8 F 48 12 20.0 N 0 Wh, 116, 150/90
9 F 47 11 17.0 Y + + 2 Bl, 105, 180/110
10 F 37 2 96.0 Y + + 2 Wh, 88, 200/120
11 F 44 6 6.3 Y – + 1 Wh, 96, 200/140
12 F 45 4 32.0 Y + + 2 Wh, 100, 140/90
13 F 63 1 4.3 Y – + 1 Wh, 463, 160/110
14 M 76 3 220.0 Y + + 2 Wh, 236, 240/120
15 F 80 5 14.0 Y + + 4 Wh, 278, 220/110
16 F 77 24 17.8 N 0 Mx, 133, 160/110
17 F 44 1 2.9 Y + + 1 Wh, 270, 230/120
18 F 44 3 3.5 N 0 Wh, 227, 150/100
19 F 78 3 2.4 N 0 Wh, 96, 180/100
20 F 43 4 1.3 N 0 Wh, 83, 240/170
21 F 72 12 82.0 N 0 Wh, 155, 190/110
22 F 56 48 56.0 N 0 Mx, 156, 180/120
23 F 55 14 31.0 N 0 Wh, 215, 140/90
24 F 54 18 13.2 N 0 Wh, 107, 240/140
25 F 72 5 11.9 N 0 Wh, 126, 160/100
26 F 51 24 15.0 N 0 Wh, 124, 230/130
27 M 53 48 18.0 N 0 Wh, 120, 250/160
28 M 59 9 13.0 N 0 Wh, 61, 240/140
29 M 38 6 140.0 N 0 Wh, 126, 180/130
30 M 41 72 10.5 N 0 Mx, 175, 140/90
31 M 59 5 15.9 N 0 Wh, 100, 220/160
32 M 67 3 99.0 N 0 Wh, 209, 200/130
33 M 49 2 5.6 N 0 Wh, 135, 280/140
34 M 67 3 68.8 Y + + 1 Wh, 109, 230/120
35 M 74 48 33.0 N 0 Mx, 112, 160/110
36 M 49 10 6.7 N 0 Wh, 105, 170/110
37 M 45 6 126.0 N 0 Mx, 113, 150/100
38 M 54 18 17.7 N 0 Wh, 207, 180/100
39 M 48 6 58.0 N 0 Wh, 121, 160/110
40 M 46 4 20.7 N 0 As, 155, 140/90
41 M 49 8 30.5 N 0 Wh, 136, 200/110
42 M 46 24 58.0 N 0 Wh, 95, 170/90
43 M 55 24 41.6 Y + + 2 Wh, 161, 150/110
44 M 66 3 115.0 N 0 Wh, 114, 140/90
45 M 64 3 16.5 Y + + 2 Wh, 160, 140/90
46 M 52 6 159.0 N 0 Wh, 118, 160/110
47 M 77 7 81.0 N 0 Wh, 110, 160/100
48 M 81 6 58.0 N 0 Wh, 260, 190/100
49 M 45 2 14.1 N 0 Wh, 319, 160/110
50 M 51 24 24.0 N 0 Wh, 130, 170/120
51 M 79 3 245.0 Y + + 4 Wh, 145, 160/100
52 M 68 4 7.5 N 0 Wh, 214, 160/90
53 M 61 6 2.5 Y + + 2 Wh, 148, 140/90
54 M 57 8 186.0 Y + + 3 Wh, 210, 180/90
55 M 47 10 10.8 N 0 Bl, 220, 160/110
56 M 89 12 118.0 N 0 Wh, 133, 150/100
57 M 81 11 123.0 N 0 Wh, 137, 150/90
58 M 57 11 87.0 N 0 Wh, 150, 220/120
59 M 60 3 107.0 Y + + 2 Mx, 120, 220/140
60 M 60 2 10.9 Y + + 2 Wh, 123, 220/120
61 M 52 11 19.0 N 0 Wh, 150, 160/100
62 M 45 1 9.0 Y – + 1 Mx, 148, 280/160
63 M 46 6 1.0 N 0 Mx, 100, 220/100
64 M 39 3 17.0 Y – + 1 Wh, 112, 190/90
65 M 59 7 2.3 N 0 Wh, 97, 140/90
F: female; M: male; N: no; Y: yes; SSS: spot sign score.
average of 5.1 hours and a median of 3 hours (range 1–24 hours). he median overall time from the ictus to CTA scan-ning was 6 hours in our series, and the mean was 10.9 hours (range 1–72 hours).
Multivariate logistic regression was used to analyze cer-tain additional features, including the ICH location and vo-lume, the presence of a spot sign, the shape and attenuation of the hemorrhage, and the duration of ictus. he incidence of mortality was primarily inluenced by the ICH volume (p=0.001) and the presence of a spot sign (p=0.02), whereas the expansion of hemorrhage was only inluenced by the spot sign (p=0.001).
Figure 1. A 67-year-old male presented with right hemiparesis and a decreased level of consciousness. Initial non-contrast computed tomography (NCCT) after 2 hours of ictus (A) demonstrating the larger extension of an intracerebral hemorrhage (ICH) (6.5×4.0×4.3 cm, volume=60 ml). The arterial phase of the computed tomography angiography source images (CTA-SI) (B) did not reveal a spot sign. The venous phase of the CTA-SI (C) revealed an unequivocal spot sign (arrow). NCCT for the imaging follow-up (D) showing ICH expansion after 24 hours of ictus (7.6×4.0×6.0 cm, volume=94 ml).
Table 3. Frequency and accuracy of the spot sign for the prediction of mortality and hematoma expansion in several studies.
Studies Sensitivity/specificity
N Spot Sign frequency (%) Hematoma expansion Mortality
Becker et al.22 113 46.0 n/a 77/73
Wada et al.2 39 33.3 91/89 43/69
Goldstein et al.23 104 55.8 92/50 73/50
Kim et al.24 56 26.8 n/a 50/83
Ederies et al.25 61 42.6 94/79 n/a
Delgado Almandoz et al.15 367 19.3 88/93 n/a
Delgado Almandoz et al.26 573 23.2 n/a 41/85
Hallevi et al.27 27 48.1 100/100 n/a
Rosa Jr. et al. 65 29.2 67/91 41/85
n/a: not applicable.
Table 4. Spot sign score and its relationship with mortality, expansion of hemorrhage and poor outcome.
SSS N N2 Expansion Mortality Poor outcome Expansion % Mortality % Poor outcome %
0 46 23 2 20 30 9 43.5 65.2
1 6 5 4 4 4 80 66.7 66.7
2 10 3 2 7 9 67 70 90
3 1 0 0 1 1 – 100 100
4 2 0 0 2 2 – 100 100
AUC (95% CI) 0.79 (0.59–0.9) 0.63 (0.49–0.76) 0.56 (0.41–0.70)
P value 0.012 0.006 0.04
SSS: spot sign score; N: total number of patients; N2: number of patients with a control CT; AUC: area under curve; CI: conidence interval. DISCUSSION
he active extravasation of contrast within a hemorrhage has been described in catheter angiography for nearly 30 years5.
Similar indings have also been described in magnetic reso-nance imaging with the use of gadolinium17 and in CTA-SI2,4,5.
Recent guidelines have conirmed that rapid neuroima ging is strongly recommended to conirm the hemorrha gic nature of the stroke, while CTA may be considered use-ful to evaluate for underlying secondary ICH determined by structural lesions, including vascular malformations and tu-mors (Class IIa; Level of evidence B) and also to help identify
patients at risk for hematoma expansion (Class IIb; level of evidence B)16. Our results agree with previous reports
con-irming that the presence of spot sign on CTASI is an accu-rate and reliable predictor of non-traumatic hemorrhage ex-pansion, mortality, and poorer neurological outcomes2,4.
he current report conirmed that contrast extravasation not only is an early event in CTA-SI analysis, as the spot sign occurred after the irst 3 hours of ictus in our cohort of pa-tients, but was also documented 24 hours after the ictus. he detection of a spot sign in our series of patients was less fre-quent than in certain previous reported series2,22,23,25,27, most
likely due to their shorter delay before arriving at the hospital. Spot sign detection is higher if the CTA is obtained within the irst 3 hours after stroke2,27, but it has also been documented
after this period and can be detected during both phases of MDCT angiography (arterial and venous)3,4. he reported
fre-quency of these delayed spot signs, which are detected du-ring the venous phase of MDCT angiography, ranges from 8% to 23% of all the spot signs identiied in various series4. he
venous phase of CTA was also the most important for the de-tection of the spot sign in our series, allowing for its dede-tection in 21% of the patients.
Appropriated institutional imaging protocols for MDCT, including CTA, must be carefully deined in order to avoid unnecessary radiation exposure and intravenous contrast administration. he use of this technique is supported by the current literature4,6–9. Delgado-Almandoz et al.4,15 deined
CTA-SI parameters appropriate for the diagnosis of the spot sign within ICH. To predict a variable risk for the various types of spot signs, these authors have proposed a score that considers the number of foci of leakage inside of the hemor-rhage, and the size of greater focus and its attenuation. To the best of our knowledge, this is the irst study that uses the same CTA approach to both detect and categorize spot signs in a Brazilian cohort of patients.
Our data are consistent with previously published results, conirming similar results in the detection of spot sign within ICH and reinforcing the applicability of CTA to clarify the risk of a worse prognosis, including in-hospital morta lity3,4,16.
he demographic data among our patients were similar to those in previous studies1,4. Despite the higher mortality
among those patients with hyperglycemia, our results did not conirm statistical signiicance. Probably the small num-ber of patients in the deined groups has limited the analy-sis. Diferent levels of high BP were also not correlated with
the worse prognosis in this series. Conversely, international guidelines have deined that normoglycemia is recommen ded (Class I, Level of evidence C), while BP should be moni-tored according to previously deined parameters (Class IIb; Level of evidence C)16. Despite that, optimal management of
high BP and hyperglycemia in ICH remains to be clariied14,16.
he current literature suggests applying careful interpre-tation to recognize results that can mimic spot sign on CTA-SI. Some of these results may be due to vascular causes, such as aneurysms and arteriovenous malformations that have continuity with adjacent vessels, facilitating recognition18. here are also nonvascular causes that can mimic spot signs on CTASI, such as heterogeneous bleeding and calciica-tion foci. All of these indings should be scrutinized on both NCCT and CTA to avoid the misdiagnosis of spot signs.
Our report has certain limitations, including the delayed arrival of the patients to our center and the smaller sample of patients relative to previous series4,15,23,26. Although the
ma-jority of our patients self-reported themselves as Caucasians, the incidence of miscegenation in our population is well known10–13. Certain ethnic variations, including
miscege-nation and concurrent uncontrolled systemic arterial hy-pertension, may contribute to more severe ICH outcomes among Latin Americans10–13. Further controlled studies using
he mostatic drugs in Latin American subjects remain neces-sary to examine the expansion of hemorrhage with varia-ble clinical outcome improvements, as previously reported among populations in developed countries19–21.
he authors encourage the use of this standardized MDCT protocol, including both arterial and venous phases, in an imaging work-up for ICH among Brazilian patients who arrive at the hospital during the irst 24 hours after ictus. An appropriate approach and speciic treatment might support the adoption of public policies in treating Brazilian patients with ICH, ensuring earlier and more eicient treatment.
In conclusion, the incidence of a spot sign on CTA-SI was positively associated with hematoma expansion, a poor prog-nosis, and mortality in our Brazilian cohort of patients with primary ICH. Our results reinforce the hypothesis that CTA-SI is useful to detect the spot sign during the irst 24 hours af-ter primary ICH, particularly when considering venous phase CTA 3 hours after ictus. hese indings also support the con-clusions that a higher score (SSS) signiicantly increases the chance of death and that even the presence of a spot sign is an independent strong predictor of hematoma expansion.
References
1. Fischbein NJ, Wijman CA. Nontraumatic intracranial hemorrhage. Neuroimag Clin N Am 2010;20:469-492.
2. Wada R, Aviv RI, Fox AJ, et al. CT angiography “spot sign” predicts hematoma expansion in acute intracerebral hemorrhage. Stroke 2007;38:1257-1262.
3. Demchuk AM, Dowlatshahi D, Rodriguez-Luna D, et al. Prediction of haematoma growth and outcome in patients with intracerebral haemorrhage using the CT-angiography spot sign (PREDICT): a prospective observational study. Lancet Neurol 2012;11:307-314.
16. Morgenstern LB, Hemphill JC, Anderson C, et al. Guidelines for the Management of Spontaneous Intracerebral Hemorrhage: A Guideline for Healthcare Professionals From the American Heart Association/ American Stroke Association. Stroke 2010;41:2108-2129.
17. Murai Y, Ikeda Y, Teramoto A, Tsuji Y. Magnetic resonance imaging- documented extravasation as an indicator of acute hypertensive intracerebral hemorrhage. J Neurosurg 1998;88:650-655.
18. Gazzola S, Aviv RI, Gladstone DJ, et al. Vascular and nonvascular mimics of the CT angiography “spot sign” in patients with secondary intracerebral hemorrhage. Stroke 2008;39:1177-1183.
19. Davis SM, Broderick J, Hennerici M, et al. Hematoma growth is a determinant of mortality and poor outcome after intracerebral hemorrhage. Neurology 2006;66:1175-1181.
20. Mayer SA, Brun NC, Begtrup K, et al. Eficacy and safety of recombinant activated factor VII for acute intracerebral hemorrhage. N Engl J Med 2008;358:2127-2137.
21. Anderson CS, Huang Y, Wang JG, et al. Intensive blood pressure reduction in acute cerebral haemorrhage trial (INTERACT): a randomised pilot trial. Lancet Neurol 2008;7:391-399.
22. Becker KJ, Baxter AB, Bybee HM, et al. Extravasation of radiographic contrast is an independent predictor of death in primary intracerebral hemorrhage. Stroke 1999;30:2025-32.
23. Goldstein JN, Fazen LE, Snider R, et al. Contrast extravasation on CT angiography predicts hematoma expansion in intracerebral hemorrhage. Neurology 2007;68:889-894.
24. Kim J, Smith A, Hemphill JC III, et al. Contrast extravasation on CT predicts mortality in primary intracerebral hemorrhage. Am J Neuroradiol 2008;29:520-525.
25. Ederies A, Demchuk A, Chia T, et al. Postcontrast CT extravasation is associated with hematoma expansion in CTA spot negative patients. Stroke 2009;40:1672-1676.
26. Delgado Almandoz JE, Yoo AJ, Stone MJ, et al. The spot sign score in primary intracerebral hemorrhage identiies patients at highest risk of in-hospital mortality and poor outcome among survivors. Stroke 2010;41:54-60.
27. Hallevi H, Abraham AT, Barreto AD, et al. The spot sign in intracerebral hemorrhage: the importance of looking for contrast extravasation. Cerebrovasc Dis 2010;29:217-220.
the evaluation of hemorrhagic stroke. Neuroimag Clin N Am 2011;21:197-213.
5. Kowada M, Yamaguchi K, Matsuoka S, Ito Z. Extravasation of angiographic contrast material in hypertensive intracerebral hemorrhage. J Neurosurg 1972;36:471-473.
6. Krol AL, Dzialowski I, Roy J, et al. Incidence of radiocontrast nephropathy in patients undergoing acute stroke computed tomography angiography. Stroke 2007;38:2364-1366.
7. Dittrich R, Akdeniz S, Kloska SP, et al. Low rate of contrast-induced nephropathy after CT perfusion and CT angiography in acute stroke patients. J Neurol 2007;254:1491-1497.
8. Hopyan JJ, Gladstone DJ, Mallia G, et al. Renal safety of CT angiography and perfusion imaging in the emergency evaluation of acute stroke. Am J Neuroradiol 2008;29:1826-1830.
9. Oleinik A, Romero JM, Schwab K, et al. CT angiography for intracerebral hemorrhage does not increase risk of acute nephropathy. Stroke 2009;40:2393-2397.
10. Lessa I, Silva MR. Cerebrovascular diseases as multiple cause of death in Salvador: magnitude and space differences of mortality omitted in oficial statistics. Arq Neuropsiquiatr 1993;51:319-324.
11. Saposnik G, Del Brutto OH. For the Iberoamerican Society of Cerebrovascular Diseases. Stroke in South America: A systematic review of incidence, prevalence, and stroke subtypes. Stroke 2003;34:2103-2108.
12. Lessa I, Bastos CA. Epidemiology of cerebrovascular accidents in the city of Salvador, Bahia, Brazil. Bull Pan Am Health Organ 1983;17:292-303.
13. Minelli C, Fen LF, Minelli DPC. Stroke incidence, prognosis, 30-day, and 1- year case fatality rates in Matão, Brazil. Stroke 2007;38:2906-2911.
14. Pontes-Neto OM, Oliveira-Filho J, Valiente R, et al. Brazilian guidelines for the management of intracerebral hemorrhage. Arq Neuropsiquiatr 2009;67:940-950.