ISSN 0104-6632 Printed in Brazil
www.abeq.org.br/bjche Vol. 28, No. 02, pp. 313 - 323, April - June, 2011
Brazilian Journal
of Chemical
Engineering
DISPERSED PHASE HOLDUP IN A PULSED DISC
AND DOUGHNUT EXTRACTION COLUMN
M. Torab-Mostaedi
1*, H. Jalilvand
2and M. Outokesh
21
Nuclear Fuel Cycle Research School, Nuclear Science and Technology Research Institute, End of North Karegar Av., P.O. Box: 11365-8486,
Phone: (+9821)88221128, Fax: (+9821)88221116, Tehran, Iran. E-mail: [email protected]
2
Department of Energy Engineering, Sharif University of Technology, Tehran, Iran.
(Submitted: September 26, 2010 ; Revised: March 16, 2011 ; Accepted: March 22, 2011)
Abstract - Dispersed phase holdup has been measured in a 76 mm diameter pulsed disc and doughnut extraction column for three different liquid-liquid systems. The effects of operational variables such as pulsation intensity and dispersed and continuous phase flow rates on holdup have been investigated and found to be significant. The existence of three different operational regimes, namely mixer-settler, dispersion, and emulsion regimes, was observed when the energy input was changed. The results indicated that the characteristic velocity approach is applicable to this type of extraction column for analysis of holdup in the transition and emulsion regions. Empirical correlations are derived for prediction of the dispersed phase holdup in terms of the physical properties of the system and the operating variables in different operating regimes. Good agreement between prediction and experiments was found for all operating conditions investigated.
Keywords: Dispersed phase holdup; Pulsed disc and doughnut column; Slip velocity; Characteristic velocity.
INTRODUCTION
Various types of solvent extraction contactors have been used for a range of applications in the hydrometallurgical, pharmaceutical, petrochemical, and nuclear industries for many years. In recent years, a relatively new type of solvent extraction contactor, called the pulsed disc and doughnut extraction column, has been developed and extensively applied to reprocess spent nuclear fuel in France and Japan (Angelov and Journe, 1990; Angelov et al., 1998). On an industrial scale, the pulsed disc and doughnut column has also been installed at the Western Mining Corporation (WMC), Olympic Dam, South Australia, for extraction of uranium. In comparison to mixer-settlers, which are frequently used in the mining industry and nuclear fuel reprocessing, this extractor is attractive from both safety and economic standpoints, in particular its simplicity of design, smaller space consumption, reduction of organic loss and no internal moving parts (Movsowitz et al., 1997).
Introduction of a solvent into an extractor produces droplets that undergo repeated coalescence and breakage, leading to a equilibrium drop size distribution. The resulting fractional volumetric holdup is defined as the volume fraction of the active section of the column that is occupied by the dispersed phase:
d d
e x =υ
υ (1)
where vd represents the volume of the dispersed phase and ve the total volume of the two phases for the effective length of the column (Oliveira et al., 2008; Stella et al., 2008).
column and the column is thus characterized as flooded and any further increase in the dispersed phase flow is rejected from the column resulting in inefficient operating conditions. The dispersed phase holdup will tend to increase unstability as the flood point is approached. The dispersed phase holdup is also necessary to calculate the slip velocity between the phases. The slip velocity is the single most important parameter for the control of mass transfer.
At present, little information has appeared in the literature regarding the performance of pulsed disc and doughnut extraction column. Many investigations have concentrated on the development of numerical solutions to describe the operational characteristics of the column (Aoun Nabli et al., 1998; Aoun Nabli and Guiraud, 1997; Bardin-Monnier and Guiraud, 2003); however, no firm design and scale-up criteria have yet been proposed.
The present paper describes an investigation of dispersed phase holdup of a pulsed disc and doughnut column as a function of pulsation intensity and phase flow rates with three different systems. Holdup data are correlated in terms of phase flow rates by the characteristic velocity method. Empirical correlations are developed for dispersed phase holdup in terms of physical properties and operating variables for different operating regimes.
EXPERIMENTAL
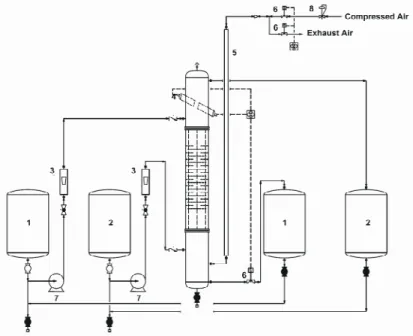
A schematic diagram of the experimental apparatus is shown in Figure 1. The main column section consisted of a 74 cm long glass tube of 76 mm internal diameter, enclosing a stack of 30 pairs of disc and
doughnut, made of 2 mm stainless steel sheet. The discs and doughnuts were arranged alternately and spaced 10 mm apart, resulting in a 20 mm compartment height; they were held in place by means of three 3.2 mm o.d. SS tie rods with SS spacer sleeves. The discs were 67 mm in diameter and the doughnut apertures were 36 mm, giving an open free area of 23.5%. A settler of 112 mm diameter at each end of the column permitted the liquids to coalesce and decant separately. The column was pulsed by blowing air at the required amplitude and frequency into the pulse leg. The air pressure was controlled by a regulator to provide pulses of the required amplitude in the column while the frequency of the pulses was controlled using two solenoid valves. The inlet and outlet of the column were connected to four tanks, each of 80 l capacity. The flow rates of the two phases were indicated by two rotameters. The liquid-liquid interface was maintained approximately 250 mm above the top compartment. This was achieved by using an optical sensor. A solenoid valve (a normally closed type) was provided at the outlet stream of the heavy phase. This valve received electronic signals from the sensor. When the interface location was going to change, the optical sensor sent a signal to the solenoid valve and the aqueous phase was allowed to leave the column by opening the diaphragm of the solenoid valve. The organic phase was allowed to leave the column via overflow.
The studied liquid-liquid systems were kerosene-water, toluene-kerosene-water, and n-butyl acetate-water. Distilled water was used as the continuous phase and technical grade solvents were used as the dispersed phase. The physical properties of the system used in these experiments are listed in Table 1. The physical properties were measured under equilibrium conditions.
1. Continuous Phase Tanks 2. Dispersed Phase Tanks 3. Rotameters
4. Optical Level Controller 5. Pulsation Leg
6. Solenoid Valves 7. Pumps
8. Regulator
Table 1: Physical properties of liquid systems at 20°C (Míšek et al., 1985; Jahya et al., 1999)
Physical property
Kerosene-water Toluene-water n-Butyl acetate- water
3 c(kg / m )
ρ 998.2998 997.6
3 d(kg / m )
ρ 865.2804 880.9
c(mPa.s)
η 0.9631.0 1.0274
d(mPa.s)
η 0.5841.66 0.734
(mN / m)
σ 36.046.5 14.1
When starting a run, the solvent and water phases were first mutually saturated by repeated circulation through the column. After filling the column with the continuous phase, the dispersed phase was introduced. The amplitude and frequency of pulsation were next adjusted to the desired values. The column was operated for a period before steady state was reached. After this period, the holdup was measured. The interface position was then maintained at the desired height and the system was allowed to reach the steady state. The period of running was doubled and holdup was measured again. If there is no change then it can be assumed that it is at the steady state. In these experiments, 3-4 changes of the column volume were needed to reach steady state conditions. All experiments were carried out far from flooding conditions.
Holdup measurements were obtained using the shut down (displacement) method. In order to use this method, at the end of a run, the inlet and outlet valves were shut simultaneously and the dispersed phase was allowed to disengage to the interface at the top of the column. A period of 10-15 min was allowed for the dispersed phase to settle. The change in interface height between operation and after settling was measured and then converted into the corresponding volume to determine holdup. In the settler of an extraction column, there are no internals and agitation and the droplets are very large compared to the active part of the column. Consequently, the value of the holdup is very low in the settler compared to the active part of the column. So, the method has enough accuracy for measuring of holdup in the column.
Visual observation of the column in operation with these three liquid systems indicated that three regimes, mixer-settler, dispersion (transition), and emulsion, occurred depending upon pulsation intensity. A stepwise movement of the droplets within the column indicated the occurrence of the mixer-settler regime. The existence of the dispersion regime was revealed by a non-uniform drop size distribution and no coalescence of the dispersed phase droplets. The emulsion regime followed the dispersion regime and was characterized by a uniform distribution of dispersed phase drops in the continuous phase in each compartment of the column.
RESULTS AND DISCUSSION
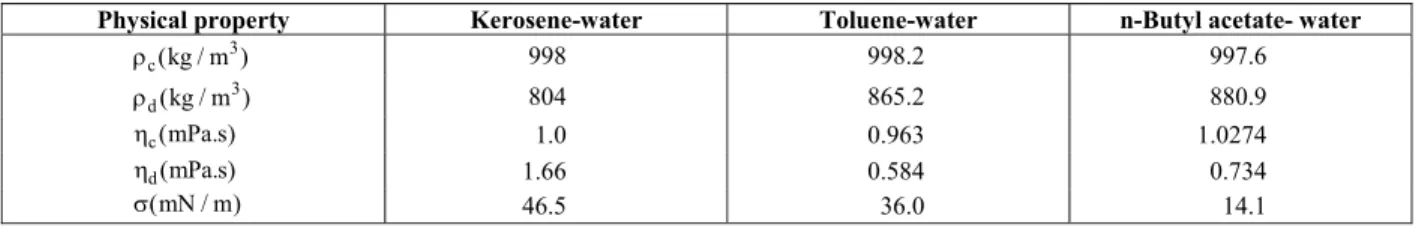
The effect of pulsation intensity on dispersed phase holdup is shown in Figure 2. In the mixer-settler regime at low pulsation intensity, the dispersed phase holdup is high due to the presence of thick layers of the dispersed phase under the discs and doughnuts. As the pulsation intensity increases, large drops formed due to pulsation do not have enough time to collect under the internals. These large drops have a low residence time. Therefore, the holdup decreases with an increase in pulsation intensity and reaches a minimum value. This minimum corresponds to the transition from the mixer-settler to the dispersion regime. As shown in Fig. 2, dispersed phase holdup increases with an increase in pulsation intensity in both the dispersion and emulsion regimes. The inertial and shear forces on droplets increase with an increase in pulsation intensity. These forces enhance drop breakage. It appears that the number of drops in the column increases due to the decrease of the relative velocity between the two phases and, consequently, the value of dispersed phase holdup will increase in these regimes.
The rising velocity of the dispersed phase droplets in the aqueous phase depends on drop diameter. The interfacial tension is the physical property that has greatest effect on drop size. Therefore, the dispersed phase holdup is expected to vary with interfacial tension. As shown in Fig. 2, holdup decreases with an increase in interfacial tension. It is known that the size of the drops increases with increasing interfacial tension. Therefore, the residence time of the drops decreases and, consequently, dispersed phase holdup will increase.
Figure 2: Effect of pulsation intensity on dispersed phase holdup (Vc=Vd=1.132 mm/s)
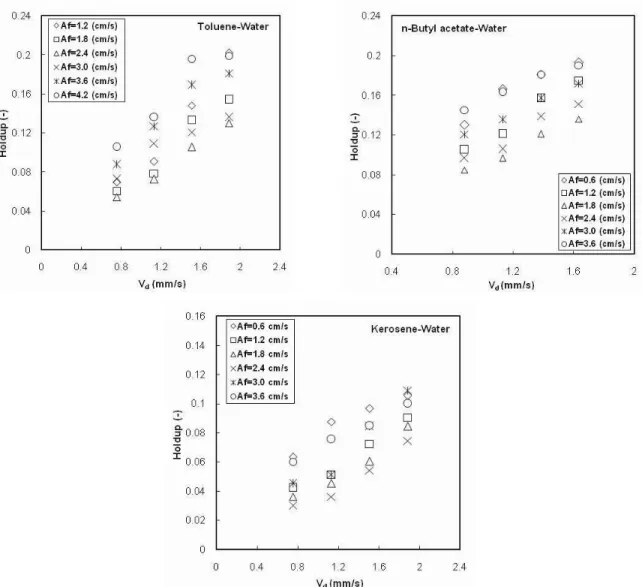
Figure 4 illustrates the effect of continuous phase velocity on dispersed phase holdup. By increasing the continuous phase velocity, the drag force between the dispersed drops and the continuous phase increases, so the drop movement will be limited and the residence time will increase. Consequently, the value of the holdup increases with increasing continuous phase velocity. Comparing Figures 3 and 4, it can be seen that the effect of dispersed phase velocity on holdup is larger than that of continuous phase velocity. The operating variables and experimental results are listed in the Appendix.
The concept of characteristic velocity (Gayler et al, 1953), Vk, is very useful for relating the dispersed phase holdup and the phase flow rates:
d c
s k d
d d
V V
V V (1 x )
x 1 x
= + = −
− (2)
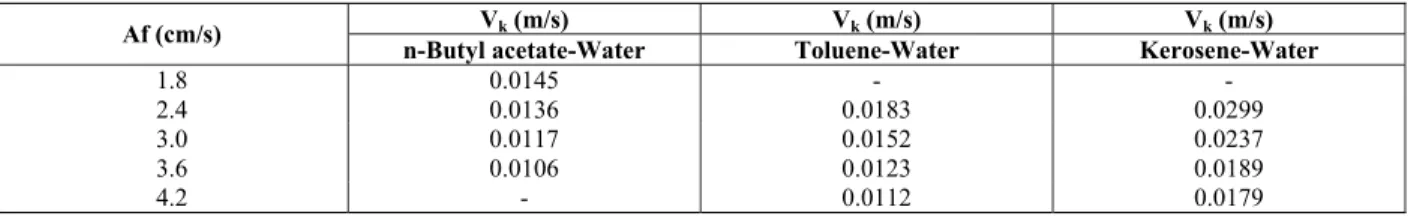
where Vs is the slip (or relative) velocity between the continuous and dispersed phase through the column. The applicability of the above equation to the present column depends on the linearity of the characteristic velocity plot. Typical graphs of this plot are shown in Figure 5 using Equation (2). The results confirm that the method is applicable to the present column in the transition and emulsion regions. Even if there is a little discrepancy in the graphs, this approach can be used for the column like similar results observed by other investigators (Jahya et al., 2000). However, a marked discrepancy was observed in the values of Vk obtained in the mixer-settler regime. The resulting values of Vk are listed in Table 2. As shown in this Table, the characteristic velocity decreases with an increase in pulsation intensity. Table (2) also shows that the characteristic velocity increases with an increase in interfacial tension.
Figure 5: Characteristic velocity plots for the n-butyl acetate-water system
Table 2: The values of characteristic velocity for the transition and emulsion regions
Vk (m/s) Vk (m/s) Vk (m/s)
Af (cm/s)
n-Butyl acetate-Water Toluene-Water Kerosene-Water
1.8 0.0145 - -
2.4 0.0136 0.0183 0.0299
3.0 0.0117 0.0152 0.0237
3.6 0.0106 0.0123 0.0189
4.2 - 0.0112 0.0179
Jahya et al. (2009) proposed the following correlation for prediction of the characteristic velocity in terms of the physical properties of the systems and the column variables in the dispersion and emulsion regimes:
0.13 1.59 2
4 c
k
a
0.32 0.47
4
c a c
5 2
c c c
0.81 0.98 0.12 4
c d
3
c c
d A g
V 6.889 10
d
d
g
− ⎛ ⎞ ⎛ ρ ⎞
= × ⎜ ⎟ ⎜⎜ σ ⎟⎟
⎝ ⎠ ⎝ ⎠
⎛ ⎞ ⎛ ⎞
⎛ ⎞σ ρ σ⎜ ⎟ ⎜ ρ σ⎟
⎜ ⎟⎜μ ψμ ⎟ ⎜ μ ⎟
⎝ ⎠⎝ ⎠ ⎝ ⎠
⎛ μ ⎞ ⎛Δρ⎞ ⎛ ⎞μ
⎜ ⎟ ⎜ ⎟ ⎜ ⎟
⎜Δρσ ⎟ ⎝ρ ⎠ ⎝ ⎠μ
⎝ ⎠
(3)
where
2 2
3 2 2
o c
(1 )
(Af )
2 C h
π − ε ψ =
ε .
Equation (3) was used for estimation of characteristic velocity obtained in the present work. The comparison of the experimental results with those predicted by Eq. (3) is illustrated in Fig. 6. As can be
seen in this figure, the experimental results are in very good agreement with the calculated values obtained by using Eq. (3) for both the toluene-water and n-butyl acetate-water systems. However, a relatively marked deviation is observed for the characteristic velocity data of the kerosene-water system.
Empirical correlations are also derived for dispersed phase holdup for different operating regimes in the present work. The values of holdup, xd, are correlated with physical properties of the systems and the operating variables as follows:
0.095 0.35 0.06
4 4 4
c d c d
d 3
c 0.88 0.91 d
c c
Af V g
x 2.57
g g
V 1
V
− −
− −
⎛ ρ ⎞ ⎛ ρ ⎞ ⎛ μ ⎞
= ⎜⎜ σ ⎟⎟ ⎜⎜ σ ⎟⎟ ⎜⎜ρ σ ⎟⎟
⎝ ⎠ ⎝ ⎠ ⎝ ⎠
⎛ + ⎞ ⎛Δρ⎞
⎜ ⎟ ⎜ρ ⎟
⎝ ⎠ ⎝ ⎠
(4)
(mixer-settler)
0.20 0.32 0.08
4 4 4
c d c d
d 3
c 0.92 0.60 d
c c
Af V g
x 12.31
g g
V 1
V
−
− −
⎛ ρ ⎞ ⎛ ρ ⎞ ⎛ μ ⎞
= ⎜⎜ σ ⎟⎟ ⎜⎜ σ ⎟⎟ ⎜⎜ρ σ ⎟⎟
⎝ ⎠ ⎝ ⎠ ⎝ ⎠
⎛ + ⎞ ⎛Δρ⎞
⎜ ⎟ ⎜ρ ⎟
⎝ ⎠ ⎝ ⎠
(5)
(transition and emulsion)
The experimental values of the dispersed phase holdup are compared with those predicted by the proposed correlations (Eqs. (4) and (5)) in Figure 7. This figure indicates that the suggested correlations are in good agreement with experimental data. Equations (4) and (5) reproduce the experimental results with average relative deviations (ARD) of 8.81% and 9.50%, respectively.
Figure 7: Comparison of experimental data for dispersed phase holdup with calculated values
In order to test the validity and applicability of the suggested correlations, the data of two investigators (Hocq, 1994; Milot, 1990) were selected for use in this work. The comparison of the experimental results with calculated values is given in Table 3. The results show that there is reasonable agreement between the calculated values and experimental results obtained by Milot (1990). However, a large deviation is observed for Hocq’s (1994) experimental data. In those experiments, the organic phase (light phase) was used as the continuous phase and the aqueous phase (heavy phase) was the dispersed phase. This might be the main reason for this marked deviation between experimental data and calculated values.
Table 3: Comparison of experimental and calculated values of dispersed phase holdup (H1-H4= experimental data of Hocq (1994), M1-M3= experimental data of Milot (1990))
xd (cal.)
xd (exp.)
Case
0.0182 0.0525
H1
0.0224 0.0625
H2
0.0437 0.090
H3
0.0563 0.0933
H4
0.172 0.213
M1
0.223 0.268
M2
0.212 0.296
M3
CONCLUSIONS
ACKNOWLEDGMENTS
The authors are grateful to Prof. G. W. Stevens (Department of Chemical and Biochemical Engineering, The University of Melbourne) for providing some important references and for his useful information regarding the concept of characteristic velocity in extraction columns.
NOMENCLATURE
A amplitude of pulsation m
C◦ Orifice coefficient (-)
d column diameter m
da doughnut aperture diameter m
f frequency of pulsation s-1
g acceleration due to gravity m/s2
hc compartment height m
v volume m3
V superficial velocity m/s
Vs slip velocity m/s
Vk characteristic velocity m/s
xd dispersed phase holdup (-)
Greek Symbols
σ interfacial tension N/m
Δρ density difference between phases
kg/m3
μ viscosity Pa.s
ρ density kg/m3
ε fractional free area (-)
ψ power dissipated per unit mass m2/s3
Subscripts
c continuous phase
d dispersed phase
REFERENCES
Angelov, G. and Journe, E., Simulation of the flow patterns in a disc and doughnut column. Chem. Eng. J., 45, 87-97 (1990).
Angelov, G., Gourdon, C. and Line, A., Simulation of flow hydrodynamics in a pulsed solvent extraction column under turbulent regimes. Chem. Eng. J., 71, 1-9 (1998).
Aoun Nabli, M. S., Guiraud, P. and Gourdon, C., CFD contribution to a design procedure for disc and doughnut extraction columns. Chem. Eng. Res. Des. (Part A), 76, 951-960 (1998).
Aoun Nabli, M. S. and Guiraud, P., Numerical experimentation: a tool to calculate the axial dispersion coefficient in discs and doughnuts pulsed solvent extraction column. Chem. Eng. Sci. 52, 2353-2368 (1997)
Bardin-Monnier, N. and Guiraud, P., Lagrangian simulations contribution to the knowledge of discs and doughnuts pulsed solvent extraction columns hydrodynamics. Chem. Eng. Process 42, 503-516 (2003).
Gayler, R., Roberts, V. W. and Pratt, H. R. C., Liquid-liquid extraction: Part IV: A further study of holdup in packed column. Trans. Instn. Chem. Engrs., 31, 57-68 (1953).
Hocq, H., Etude de transfert de matière en colonne pulsée à l’aide d’un système de measure de taille et de concentration en solute des gouttes. Ph. D. Thesis, Institute National Polytechnique de Toulouse, France (1994).
Jahya, A., Stevens, G. W. and Pratt, H. R. C., Flood point and dispersed phase holdup in a pulsed disc and doughnut liquid-liquid extraction column. Proceedings of Chemeca 99, Newcastle, Australia (1999).
Jahya, A., Stevens, G. W. and Pratt, H. R. C., Mass transfer studies for a pulsed disc and doughnut extraction column. Proceedings of MINPREX 2000, Melbourne, Australia (2000).
Jahya, A., Stevens, G. W. and Pratt, H. R. C., Pulsed disc-and-doughnut column performance. Solvent Extr. Ion Exc., 27, 63-82 (2009).
Kumar, A. and Hartland, S., Correlations for dispersed phase holdup in pulsed sieve-plate liquid-liquid extraction column. Chem. Eng. Res. Des., 61, 248-252 (1983).
Kumar, A. and Hartland, S., Prediction of dispersed phase holdup in pulsed perforated-plate extraction columns. Chem. Eng. Process, 23, 41-59 (1988). Kumar, A. and Hartland, S., Prediction of dispersed
phase holdup in rotating disc contactors. Chem. Eng. Commun., 56, 87-106 (1987).
Kumar, A. and Hartland, S., Independent prediction of slip velocity and holdup in liquid-liquid extraction columns. Can. J. Chem. Eng., 67, 17-25 (1989).
Míšek, T., Berger, R. and Schröter, J., "Standard Test Systems for Liquid Extraction Studies." EFCE Publ. Ser., 46 (1985).
Milot, J. -F., Analyse du fonctionnement hydrodynamique d’un colonne pulsée à disques et couronnes. Ph. D. Thesis, Institute National Polytechnique de Toulouse, France (1990).
uranium solvent extraction. Bateman Projects Ltd., Israel, (1997).
Oliveira, N. S., Moraes Silva, D., Gondim, M. P. C. and Borges Mansur, M., A study of the drop size distributions and hold-up in short Kühni columns. Braz. J. Chem. Eng., 25, 729-742 (2008).
Stella, A., Mensforth, K. H., Bowser, T., Stevens, G.
W. and Pratt, H. R. C., Mass transfer in Karr Reciprocating Plate Extraction Columns. Ind. Eng. Chem. Res., 47, 3996-4007 (2008).
Yue-Yun, W., Shan, J., Giu-Lin, W. and Wei, W., Axial mixing and mass transfer characteristics of pulsed extraction with discs and doughnuts. Trans. Nonferrous Met. Soc., China 16, 178-184 (2006).
APPENDIX
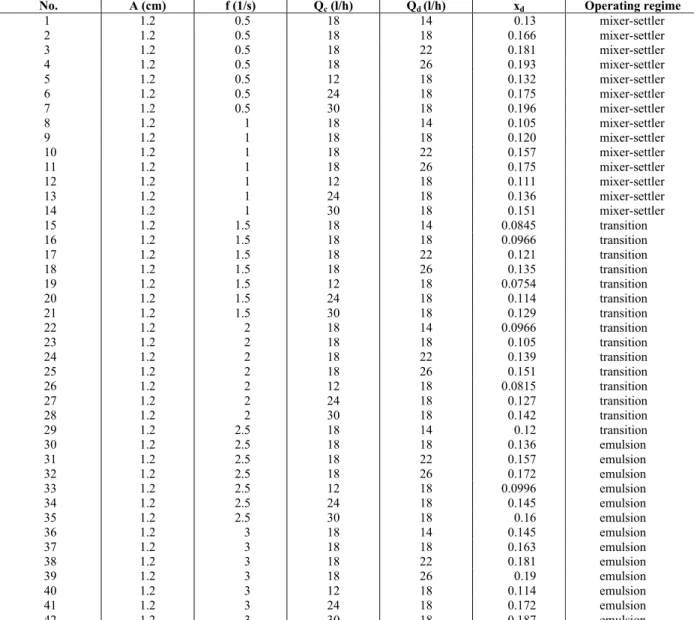
The experimental values obtained in the present work are listed in Table A-1 to A-3.
Table A-1: Experimental data for the toluene-water system
Operating regime xd
Qd (l/h)
Qc (l/h)
Table A-2: Experimental data for the n-butyl acetate-water system
Operating regime xd
Qd (l/h)
Qc (l/h)
f (1/s) A (cm) No. mixer-settler 0.13 14 18 0.5 1.2 1 mixer-settler 0.166 18 18 0.5 1.2 2 mixer-settler 0.181 22 18 0.5 1.2 3 mixer-settler 0.193 26 18 0.5 1.2 4 mixer-settler 0.132 18 12 0.5 1.2 5 mixer-settler 0.175 18 24 0.5 1.2 6 mixer-settler 0.196 18 30 0.5 1.2 7 mixer-settler 0.105 14 18 1 1.2 8 mixer-settler 0.120 18 18 1 1.2 9 mixer-settler 0.157 22 18 1 1.2 10 mixer-settler 0.175 26 18 1 1.2 11 mixer-settler 0.111 18 12 1 1.2 12 mixer-settler 0.136 18 24 1 1.2 13 mixer-settler 0.151 18 30 1 1.2 14 transition 0.0845 14 18 1.5 1.2 15 transition 0.0966 18 18 1.5 1.2 16 transition 0.121 22 18 1.5 1.2 17 transition 0.135 26 18 1.5 1.2 18 transition 0.0754 18 12 1.5 1.2 19 transition 0.114 18 24 1.5 1.2 20 transition 0.129 18 30 1.5 1.2 21 transition 0.0966 14 18 2 1.2 22 transition 0.105 18 18 2 1.2 23 transition 0.139 22 18 2 1.2 24 transition 0.151 26 18 2 1.2 25 transition 0.0815 18 12 2 1.2 26 transition 0.127 18 24 2 1.2 27 transition 0.142 18 30 2 1.2 28 transition 0.12 14 18 2.5 1.2 29 emulsion 0.136 18 18 2.5 1.2 30 emulsion 0.157 22 18 2.5 1.2 31 emulsion 0.172 26 18 2.5 1.2 32 emulsion 0.0996 18 12 2.5 1.2 33 emulsion 0.145 18 24 2.5 1.2 34 emulsion 0.16 18 30 2.5 1.2 35 emulsion 0.145 14 18 3 1.2 36 emulsion 0.163 18 18 3 1.2 37 emulsion 0.181 22 18 3 1.2 38 emulsion 0.19 26 18 3 1.2 39 emulsion 0.114 18 12 3 1.2 40 emulsion 0.172 18 24 3 1.2 41 emulsion 0.187 18 30 3 1.2 42
Table A-3: Experimental data for the kerosene-water system
Operating regime xd
Qd (l/h)
Qc (l/h)
Continuation Table A-3
Operating regime xd
Qd (l/h)
Qc (l/h)