The cost of alkaline solutions in ambulatory hemodialysis:
an analysis about wasteful from the processes control
Authors
Celso Souza de Moraes Junior1
Ricardo Rodrigues Silveira de Mendonça1
Raquel Oliveira Rocha de Freitas Hatem2
André Luiz Sampaio Souza2 Adriana Rodrigues Chaves2 Marcus Gomes Bastos1 Fernando Antônio Basile Colugnati1
1Federal University of Juiz de Fora (UFJF).
2 Santa Casa de Belo Horizonte.
Submitted on: 12/04/2013. Approved on: 04/07/2014.
Correspondence to: Celso Souza de Moraes Junior. Federal University of Juiz de Fora - School of Medicine - School of Business Administration and
Introduction: There are few studies about
costs of inputs used in hemodialysis and among these expenditures, the compounds that make up the dialysate are one of the values considered as representative of this therapy. However, there aren’t costs studies that guiding solutions. Objective: The
objective of this article is discuss whether there is wasteful of alkaline solutions in ambulatory hemodialysis and hence the possibility of reduction in cost from the standardization process simulation of establishment of dialysate flow in periods between shifts in hemodialysis outpatients.
Methods: Starting from an observational
analytic, a simulation was performed twenty case scenarios, which ten cases established by standardizing processes control on the dialysate flow in recession. The combination of data was performed using as a basis the prices of three suppliers of alkali liquid or powder. Results: It
was observed among the scenarios with standardized processes, ranging between 7.7% and 33.3% savings in the alkaline solution cost (powder or liquid), by reducing waste. Conclusion: It is possible to restrain
the wasteful use of alkaline solutions, both powder and liquid. Consequently, its cost from the patterning on reducing the flow of dialysate during the intervals between shifts observed in the outpatient hemodialysis. However, these results are conditional upon the commitment of health professionals, mainly to supervision exercise and control of activities in quality function deployment.
A
BSTRACTKeywords: cost control; costs and cost
analysis; hemodialysis solutions; process assessment (health care).
I
NTRODUCTIONAccording to the 2012 Brazilian Dialysis Census, an estimated 97,586 patients were on dialysis in 651 dialysis centers in Brazil, 74.5% of which privately owned.1 Amid
the steady growth in demand for chronic disease care,2,3 hemodialysis
has been the object of research aimed at understanding its clinical, operating and cost4 characteristics
and gathering relevant input for the planning and management of renal replacement therapy (RRT) services.5-9
Few authors have looked into the cost of dialysis procedures.5,8,9
Significant effort is required in un-derstanding the costs,8,10,11
ingre-dients, and equipment required in higher complexity procedures such as hemodialysis.
The compounds used in the production of dialysate or dialysis fluid rank among the most significant costs in outpatient hemodialysis. However, the cost of supplies is a topic yet to be addressed to satisfaction by the literature.
When in contact with blood through the dialyzer membrane, the solutes in the dialysis fluid maintain serum concentration parameters within normal ranges.12 Dialysis
concentrate. The acidic concentrate contains different levels of calcium and may contain glucose; prescription is based on the patient’s clinical status. The alkaline concentrate contains bicarbonate.13
Standardization of procedures - often mar-red by extreme variability secondary to ope-rating shortcomings and lack of planning or effective management practices - is one of the challenges found in the health sector.14-17
Except for specific clinical circumstances, process oscillations may negatively affect one’s ability to control the use of inputs and resources.
Nonetheless, little has been done in the establishment of monitoring practices to enhance the level of control over spending and use of resources.14,15,18 In this context, research
indicates the need to find solutions to reverse, maintain, or elevate the quality of health services to a level of excellence.10,14,19,20
Therefore, this paper aimed to assess whether there is waste in the use of alkaline concentrate in outpatient hemodialysis and to analyze possible solutions to reduce costs through the standardization of the processes adopted to establish dialysate flow rates between sessions. In order to do so, the authors resorted to a simulation study based on actual data from Nefro-MG, the managing institution for the Nephrology Center of the Santa Casa de Belo Horizonte Hospital in Brazil.
This study is expected to contribute to the development of monitoring practices for the costs and processes related to outpatient dialysis processes, and to set the stage for further discussions on the matter.
M
ATERIALS AND METHODThis case study stemmed from a systematic effort designed to elevate the level of knowledge over a set of observed facts and phenomena.21
The study targeted the consumption of alkaline concentrate in outpatient hemodialysis
sessions carried out at the Nephrology Care Center of the Santa Casa de Belo Horizonte Hospital, managed by Nefro-MG, which serves approximately 470 patients, nearly 85% of whom covered by the Brazilian federal health insurance program (SUS). The clinic did not adopt standards or criteria to monitor or control the use of dialysate during the time intervals between sessions or at the time of data collection.
Thus, the authors of this study looked into different cost scenarios based on dialysis fluid flow rates in effect at the care unit. The various scenarios were split into two distinct groups, the first based on process standardization and the second on no standardization at all. Within the context of this study, a process has been defined as a set of activities and tasks grouped together in order to meet a specific purpose. This study, therefore, examined the processes used to control the consumption of dialysate. The absence of processes and control measures is expected to bear direct impact upon the optimal use of alkaline concentrate, thus affecting the overall cost of treatment.
The guidelines for dialysate prescription were also taken into account, along with flow rates of 300 ml/min, 500 ml/min, and 800 ml/min. These variables were included in the study due to the effect different combinations of patients have on the volumes of dialysis fluid used during a session.
The research problem presented in this paper derives from the need to identify the best alternative among the various choices of ingredients and compare the waste of such ingredients resulting from failure to control internal operating procedures versus the outcome when oversight and processes are in effect.
variables and gathered data for the simulation of costs to be compared with actual costs, according to the different combinations of consumption scenarios. The analysis of the cost of alkaline concentrate used in outpatient hemodialysis sessions was based on the mean price of the ingredients used to make alkaline solutions.
The collected data reflect the mean cost of ingredients in effect between July of 2012 and June of 2013. Internal reports from the finance and procurement departments of the clinic, information from concentrate dilution protocols, and standard RDC 154/200422 on
the technical requirements for the operation of dialysis services were used as references. Additionally, informal interviews were carried out with medical personnel and resources from quality control and management. Other data were collected from the systematic observation of procedures related to the object of this study.
In the analysis and interpretation of the case study, data sets were coded and categorized into consumption groups according to dilution, dialysate flow rate, dialysate concentration, volume of alkaline concentrate listed in the packaging, weight of concentrate powder, machine run time before and during treatment, and time between sessions.
The ingredient consumption ratios are given by their dilution, concentration, and volume/ weight. Table 1 summarizes this information based on the offerings of three vendors, identified as “E”, “F” and “G”. The dilutions were based on the use of acidic concentrates in the concentrations offered by the vendors, identified herein as “acid-E” and “acid-F”. No information was available from acidic concentrate provider “G” at the time of data collection.
The alkaline solutions analyzed in the study were coded in order of vendor and physical state;
“liquid” for concentrate sold in five or six-liter canisters and “solid” for the powder concentrate used in the preparation of alkaline solutions.
The purchase price of liquid and solid concentrate ranged from R$ 5.95 to R$ 6.96 and R$ 5.50 to R$ 8.20, respectively. The price of a canister of acidic concentrate ranged between R$ 7.19 and R$ 15.75.
Data sets were further organized into analytical subcategories based on similarity and successive comparison of waste and cost variables. In cost analysis, the actual mean purchase prices per session and their estimated losses were compared.
Waste and costs were analyzed based on five variables: (i) time versus consumption; (ii) dilution; (iii) concentration; (iv) dialysate flow rate; and (v) volume/weight of vendor-provided products.
Variable time was limited in the study (i) considering 30 minutes of operation of the dialysis machine before the first session and one hour for the breaks between sessions as set out in Section I, Article Two, Paragraph Three of the RDC 154/2004,22 within a maximum of
three four-hour treatment sessions. The data on variables dilution (ii) and concentration (iii) are presented in Table 1.
Twenty different scenarios coded for dialysis fluid flow rates and patient profiles were considered for variable dialysate flow rate (iv). The first ten scenarios featured reduced flow rates of 300 ml/min for the thirty-minute periods before the first session and during breaks between sessions, while the following ten had flow rates as prescribed for each subsequent session.
Therefore, the scenarios (Table 2) were designed to take into account three possible hemodialysis flow rates with their respective category codes. Prescribed flow rates of 300 ml/ min, 500 ml/min, and 800 ml/min, respectively referred to as “P”, “A”, and “O” were considered. Although these flow rates are prescribed in other situations, they were named after pediatric (P), adult (A), and obese (O) patients.
TABLE 1 CODESANDCATEGORIESASSIGNEDTOTHESTUDIEDALKALINECONCENTRATESBASEDONDILUTION,
CONCENTRATION, ANDVOLUME/WEIGHT
Specification Type of concentrate/code Acidic concentrates
Type of
concentrate Code
Variables (dilution,
concentration, volume/weight) Acid-E Acid-F Acid-G
Liquid alkaline concentrate
Liquid-E
Dilution in acid concentrate (for every 45 liters of
dialysate)
1.775 1.730 NA
Concentration 1:45 1:45 NA Volume 5 liters 5 liters NA
Liquid-F
Dilution in acid concentrate (for every 45 liters of
dialysate)
1.775 1.730 NA
Concentration 1:45 1:45 NA Volume 6 liters 6 liters NA
Liquid-G
Dilution in acid concentrate (for every 45 liters of
dialysate)
NA NA NA
Concentration NA NA NA
Volume NA NA NA
Powdered alkaline concentrate
Solid-E
Dilution in acid concentrate (for every 45 liters of
dialysate)
1.775 1.730 NA
Concentration 1:35/1:45 1:35/1:45 NA Weight (kg) 0.700/0.950 0.700/0.950 NA
Solid-F
Dilution in acid concentrate (for every 45 liters of
dialysate)
NA NA NA
Concentration NA NA NA Weight (kg) NA NA NA
Solid-G
Dilution in acid concentrate (for every 45 liters of
dialysate)
1.775 1.730 NA
Concentration 1:35/1:45 1:35/1:45 NA Weight (kg) 0.650 0.650 NA
NA: Not available in the market; liquid-E: liquid alkaline concentrate provided by vendor “e”; Liquid-F: Liquid alkaline concentrate provided by vendor “f”; Liquid-G: Liquid alkaline concentrate provided by vendor “g”; Solid-E: Powdered alkaline concentrate provided by vendor “e”; Solid-F: Powdered alkaline concentrate provided by vendor “f”; Solid-G: Powdered alkaline concentrate provided by vendor “g”; Acid-E: Liquid acid concentrate provided by vendor “e”; Acid-F: Liquid acid concentrate provided by vendor “f”; Acid-G: Liquid acid concentrate provided by vendor “g”.
powder was available in two different weights (solid-E with 0.950 kg and 0.700 kg) for machines made by a specific vendor and in one weight (solid-G with 0.650 kg) for dialysis machines of another brand.
Data sets were treated based on the 20 simulated scenarios, each having analytical information on the use and waste of alkaline solution at a concentration of 1:45, according to groupings; mean cost per session in standardized
process scenarios; and percent savings in relation to the mean cost per session in scenarios with non-standardized processes. The data were treated separately for each supplier as indicated in the information presented in the tables. Calculations were made on Microsoft Excel® 2013.
R
ESULTSTABLE 2 SESSIONSCENARIOSFOREACHHEMODIALYSISMACHINEPERDAYFORSTANDARDIZEDANDNON-STANDARDIZED
DIALYSISFLOWRATESDURINGOFF-THERAPYPERIODS
Scenarios
Dialysate flow rates
Compare to scenario: Before
session 30 min (ml/
min)
1st session 240 min
Break between sessions 60 min (ml/min)
2nd session 240 min
Break between sessions 60 min (ml/min)
3rd session 240 min
Standardized dialysate flow rates for off-therapy periods
PPP-s 300 P 300 P 300 P PPP-n PPA-s 300 P 300 P 300 A PPA-n PAA-s 300 P 300 A 300 A PAA-n PPO-s 300 P 300 P 300 O PPO-n AAA-s 300 A 300 A 300 A AAA-n OAP-s 300 O 300 A 300 P OAP-n OAA-s 300 O 300 A 300 A OAA-n POO-s 300 P 300 O 300 O POO-n OOA-s 300 O 300 O 300 A OOA-n OOO-s 300 O 300 O 300 O OOO-n
Non-standardized dialysate flow rates for off-therapy periods
PPP-n 300 P 300 P 300 P PPP-s PPA-n 300 P 300 P 500 A PPA-s PAA-n 300 P 500 A 500 A PAA-s PPO-n 300 P 300 P 800 O PPO-s AAA-n 500 A 500 A 500 A AAA-s OAP-n 800 O 500 A 300 P OAP-s OAA-n 800 O 500 A 500 A OAA-s POO-n 300 P 800 O 800 O POO-s OOA-n 800 O 800 O 500 A OOA-s OOO-n 800 O 800 O 800 O OOO-s
P: Dialysate flow rate of 300 ml/min; A: Dialysate flow rate of 500 ml/min; O: Dialysate flow rate of 800 ml/min; s: Standardized dialysate flow rates for off-therapy periods; n: Non-standardized dialysate flow rates for off-therapy periods.
in the cost per session. Assessments were carried out based on the consumption of powdered (“solid-E” and “solid-G”) and liquid alkaline concentrates (“liquid-E” and “liquid-F”).
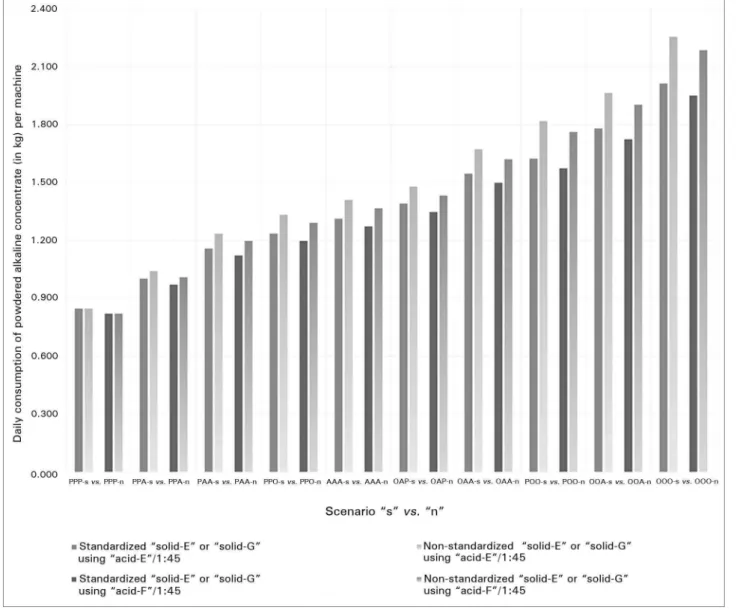
Graph 1 presents a comparison between the daily consumption of powdered concentrate based on the acidic solution dilution rates offered by two vendors, identified herein as “acid-E”
and “acid-F” as specified on Table 1. This graph shows the separation between groups of scenarios based on the adoption of standardized processes to reduce dialysate flow rates to 300 ml/ min during breaks between sessions, categorized in Table 2 under “standardized” processes and marked with the letter “s”.
These scenarios were repeated, however
scenarios is referred to as “non-standardized” in Table 2 and is marked with the letter “n” in front of each indicated combination. Consumption dynamics for each scenario are presented on Table 2 and Graph 1 for the simulated use of powdered alkaline concentrate in “acid-E” and
“acid-F” acidic solutions.
The comparison of concentrates by vendor described in Graph 1 revealed that the consumption of “solid-E” was higher than “solid-G” due to differences in dilution into the liquid solution. Consumption outcomes also indicated differences between “standardized” and “non-standardized”
Graph 1. Compared consumption of "solid-E" and "solid-G" alkaline concentrates respectively diluted in "acid-E" and "acid-F": scenarios with standardized and non-standardized processes.
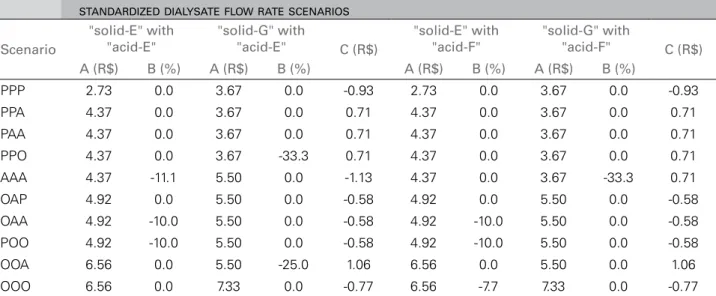
Table 3 summarizes the information concerning spending and variations in cost savings of standardized versus non-standardized practices. Additionally, it offers a comparison between ingredient vendors in terms of levels of efficiency for the given scenarios.
High costs derived from waste in the “solid-E”
and “acid-E” combination were observed in scenarios “AAA”, “OAA”, and “POO”. Table 3 indicates respective reductions in the cost per session of 11.1% and 10.0% for the other two scenarios when process standardization as shown in Table 2 was introduced.
Waste and costs increased when ingredients
“solid-G” and “acid-E” were combined. In the presence of controlled dialysate flow rates in
off-therapy periods, the cost of scenario “PPO” was reduced by 33.3%, while the cost per session in scenario “OOA” was cut down by 25.0%.
TABLE 3 COSTPERSESSION (R$) OFINGREDIENTS "SOLID-E" AND "SOLID-G" ANDSAVINGS (%) ACCORDINGTO
STANDARDIZEDDIALYSATEFLOWRATESCENARIOS
Scenario
"solid-E" with "acid-E"
"solid-G" with
"acid-E" C (R$)
"solid-E" with "acid-F"
"solid-G" with
"acid-F" C (R$)
A (R$) B (%) A (R$) B (%) A (R$) B (%) A (R$) B (%)
PPP 2.73 0.0 3.67 0.0 -0.93 2.73 0.0 3.67 0.0 -0.93 PPA 4.37 0.0 3.67 0.0 0.71 4.37 0.0 3.67 0.0 0.71 PAA 4.37 0.0 3.67 0.0 0.71 4.37 0.0 3.67 0.0 0.71 PPO 4.37 0.0 3.67 -33.3 0.71 4.37 0.0 3.67 0.0 0.71 AAA 4.37 -11.1 5.50 0.0 -1.13 4.37 0.0 3.67 -33.3 0.71 OAP 4.92 0.0 5.50 0.0 -0.58 4.92 0.0 5.50 0.0 -0.58 OAA 4.92 -10.0 5.50 0.0 -0.58 4.92 -10.0 5.50 0.0 -0.58 POO 4.92 -10.0 5.50 0.0 -0.58 4.92 -10.0 5.50 0.0 -0.58 OOA 6.56 0.0 5.50 -25.0 1.06 6.56 0.0 5.50 0.0 1.06 OOO 6.56 0.0 7.33 0.0 -0.77 6.56 -7.7 7.33 0.0 -0.77
A: Cost per session in scenario with standardized dialysate flow rates; B: % cost savings per session (A) in relation to scenario with non-standardized dialysate flow rates; C: Session cost variation between vendors - cost difference between "solid-E" and "solid-G" in scenarios with standardized dialysate flow rates.
The analysis of the “solid-E” and “acid-F”
combination revealed some increase in costs due to waste in the “OAA”, “POO”, and “OOO”
scenarios. When waste was reduced, cost savings per session ranged between 7.7% and 10.0%. The combination of ingredients “solid-G” and “acid-F” yielded cost savings only in scenario “AAA” in the presence of controlled dialysate flow rates. The cost savings in this arrangement amounted to 33.3%.
When “acid-F” was analyzed for its
combinations with the available alkaline concentrates, improved outcomes were seen with “solid-E” in scenarios “OAA” and “POO” after the introduction of process control measures. In “AAA”, ingredient “solid-G” outperformed others to become the lowest cost option.
Interestingly, as seen in Table 3, process stan-dardization did not yield cost savings in the other scenarios, as costs were the same in the “standardized” and “non-standardized” groups. Furthermore, it should be noted that, for com-patibility reasons, the type of dialysis machi-nes available in the clinic limits the choice of ingredients.
Graph 2 shows the consumption results for the use of liquid alkaline concentrate offered in five and six-liter canisters. Two liquid concentrate
5-liter canisters (identified as “liquid-E”); and vendor “f”, offering concentrate in 6-liter canisters (identified as “liquid-F”). Analyses were performed based on a mixture with a ratio of one liter of acidic concentrate to 45 liters of dialysate, using products from vendors “e”
and “f” referred to as “acid-E” and “acid-F”, respectively.
There was a clear increase in the use of liquid alkaline concentrate when dialysate flow rates were not controlled. Additionally, regardless of scenario, less liquid alkaline concentrate was used in combination with “acid-F”, as shown in Graph 1. This can be explained by the fact that “acid-F” is less diluted than “acid-E” (Table 1).
As far as cost is concerned, one should bear in mind that the procurement of bottled alkaline solutions is not tied to the brand of the dialysis machine, but rather to its setup before use. Therefore, the results for scenarios “PPA”, “PAA”, “OAA”, “POO”, “OOA”, and “OOO”
indicated lower costs when “liquid-E” was used
versus “liquid-F”. However, “liquid-F” was more cost-effective in scenarios “PPP”, “PPO”, “AAA”, and “OAP”. Table 4 summarizes the main findings for cost differences derived from waste reduction.
Graph 2. Compared consumption of "liquid-E" and "liquid-F" concentrates diluted in "acid-E" and "acid-F": scenarios with standardized and non-standardized processes.
TABLE 4 COSTPERSESSION (R$) OFINGREDIENTS "LIQUID-E" AND "LIQUID-F" ANDSAVINGS (%) ACCORDINGTO
STANDARDIZEDDIALYSATEFLOWRATESCENARIOS
Scenario
"liquid-E" with "acid-E"
"liquid-F" with
"acid-E" C (R$)
"liquid-E" with "acid-F"
"liquid-F" with
"acid-F" C (R$)
A (R$) B (%) A (R$) B (%) A (R$) B (%) A (R$) B (%)
PPP 5.35 0.0 4.64 0.0 0.71 3.57 0.0 4.64 0.0 -1.07 PPA 5.35 0.0 6.96 0.0 -1.61 5.35 0.0 4.64 -33.3 0.71 PAA 5.35 -25.0 6.96 0.0 -1.61 5.35 0.0 6.96 0.0 -1.61 PPO 7.13 0.0 6.96 0.0 0.17 5.35 -25.0 6.96 0.0 -1.61 AAA 7.13 0.0 6.96 0.0 0.17 7.13 0.0 6.96 0.0 0.17 OAP 7.13 0.0 6.96 0.0 0.17 7.13 0.0 6.96 0.0 0.17 OAA 7.13 -20.0 9.28 0.0 -2.15 7.13 0.0 9.28 0.0 -2.15 POO 7.13 -20.0 9.28 0.0 -2.15 7.13 -20.0 9.28 0.0 -2.15 OOA 8.92 0.0 9.28 0.0 -0.36 8.92 0.0 9.28 0.0 -0.36 OOO 8.92 -16.7 11.60 0.0 -2.68 8.92 -16.7 9.28 -20.0 -0.36
of waste. For the same reason, a cost reduction of 20.0% was observed in scenarios “OAA” and
“POO” when “standardized” processes were introduced. A cost reduction of 16.7% was also seen in scenario “OOO”. No cost variations were observed when “liquid-F” was mixed with
“acid-E”. This happened because this alkaline concentrate is bottled in canisters one liter larger than its competitors. Thus, the concentrate leftover after three sessions absorbs the oscillations caused by waste.
The combination of “liquid-E” and “acid-E”
provided for significant advantages in waste reduction over other ingredient combinations in scenarios “PAA”, “OAA”, “POO”, and “OOO”. No gains in cost-effectiveness were observed as an outcome of process standardization in other scenarios or for the combination of “liquid-F”
and “acid-E”.
A decrease of 25.0% in cost was verified with the use of “liquid-E” and “acid-F” in scenario “PPO” after process standardization. Reductions of equal order of magnitude were seen in the “OOP” and “OOO” scenarios for the combination of “liquid-E” and “acid-E”. When used together, ingredients “liquid-F” and
“acid-F” yielded cost savings of 33.3% and 20.0% in scenario “OOO” when dialysate flow rates were controlled in off-therapy periods.
The comparison of different alkaline concentrates combined with “acid-F” revealed improved competitiveness of ingredient
“liquid-F” in scenario “PPA” and greater levels of cost reduction from the use of “liquid-E” in scenarios “PPO” and “POO”.
Yet, all simulated scenarios presented significant waste in the form of ingredient leftovers at the end of a day of hemodialysis sessions. The significance of this specific kind of waste suggests that more studies should be carried out on the issue.
D
ISCUSSIONThe results presented call for discussions on the impact of process control in achieving higher
Active participation in process management and, consequently, in monitoring and control efforts, are essential to the understanding, maintenance, optimization, and correction of the actions related to the use of these materials.14,15,20,24-28 In this
sphere, health organizations - and among them nephrology clinics - have suffered with the high costs imposed by inefficiencies and the lack of effective measures to ensure coherence between the cost and quality of the services delivered.19,20
In this sense, the deployment of quality initiatives in these organizations should include actions to improve not only process reliability, flexibility, speed or safety, but also the rationalization and tracking of costs.20,27
Our data endorse the views of the authors who understand that it is not possible to achieve better performance in cost reduction without correlating these efforts with process standardization, monitoring and control.14,19,20,28
The studied scenarios have evidenced the existence of significant cost reduction opportunities with the introduction of standardized processes that do not compromise the quality of the services delivered. These control measures also offer valuable insight into information that may potentially impact procurement decisions.24,27,29
The most effective combination of scenarios amounted to potential monthly cost savings of R$ 11,281.42 in the procurement of alkaline concentrate for a mean of 5,646 hemodialysis sessions per month. Annual cost savings could amount to potentially R$ 135,389.04.
This sum takes into account the cost savings derived from the elimination of alkaline concentrate waste secondary to process standardization and monitoring, as well as the improvements in ingredient performance originated from managing dialysate flow rates in off-therapy periods. The information on concentrate performance may also be used to leverage the position of the clinic during negotiations with vendors.
However, as mentioned previously, such a reduction in spending is subject to the commitment of physicians and other health care workers involved with the supervision of the tasks and procedures related to the use of alkaline concentrate.
It may also be said that processes to track the use of concentrate and tie it to budgeted results are needed to support and inform the organization’s strategic, tactical, and operating decision-making processes. Nevertheless, it should be clarified that the amount of information generated in the clinic targeted by this study from the control measures adopted to prevent waste may be used to support the development of forecasts and cost budgets. Additionally, the data on concentrate performance may be used to further inform the decision-making and negotiation processes involving vendors.
The deployment of quality initiatives and activities devised to produce ongoing improvements and better levels of process comprehension, monitoring, and control is inherently tied to cost reduction. In this sense, nephrology clinics are faced with the challenge of curbing costs by adopting management best practices in the area of quality control. These practices not only corroborate the attainment of better outcomes for the patients, but also endorse the economic sustainability of the organization and help secure funds to be reinvested in people, technology and better process inputs.
R
EFERENCES1. Sociedade Brasileira de Nefrologia. Censo de diálise SBN 2012 [Internet]. [citado 2013 Nov 09]. Disponível em: http://www. sbn.org.br/pdf/publico2012.pdf
2. Frenk J. Bridging the divide: global lessons from evidence-based health policy in Mexico. Salud Publica Mex 2007;49:S14-22. PMID: 17469396
3. Mendes EV. O cuidado das condições crônicas na atenção pri-mária à saúde: o imperativo da consolidação da estratégia da saúde da família. Brasília (DF): Organização Pan-Americana da Saúde; 2012.
4. Sesso RCC, Lopes AAL, Thomé FS, Lugon JR, Watanabe Y, Santos DR. Diálise Crônica no Brasil - Relatório do Censo Bra-sileiro de Diálise, 2011. J Bras Nefrol 2012;34:272-7. DOI: http://dx.doi.org/10.5935/0101-2800.20120009
5. Sancho LG, Dain S. Análise de custo-efetividade em relação às te-rapias renais substitutivas: como pensar estudos em relação a essas intervenções no Brasil? Cad Saúde Pública 2008;24:1279-90. 6. Ramos R, Molina M. Nuevos modelos de gestión de asistencia
integral en nefrología. Nefrología 2013;33:301-7.
7. Honeycutt AA, Segel JE, Zhuo X, Hoerger TJ, Imai K, Willia-ms D. Medical costs of CKD in the Medicare population. J Am Soc Nephrol 2013;24:1478-83. DOI: http://dx.doi.org/10.1681/ ASN.2012040392
8. Barbosa GS, Guimarães RM, Stipp MAC. Série histórica de custos com terapia de substituição renal no município do Rio de Janeiro (1995-2009). Esc Anna Nery 2013;17:322-7. DOI: http://dx.doi.org/10.1590/S1414-81452013000200017 9. Cherchiglia ML, Gomes IC, Alvares J, Guerra Júnior A, Acúrcio
FA, Andrade EIG, et al. Determinantes dos gastos com diálises no Sistema Único de Saúde, Brasil, 2000 a 2004. Cad Saúde Pú-blica 2010;26:1627-41. DOI: http://dx.doi.org/10.1590/S0102--311X2010000800016
10. Chaves LDP, Anselmi ML, Barbeira CBS, Hayashida M. Estudo da sobrevida de pacientes submetidos à hemodiálise e estimativa de gastos no município de Ribeirão Preto-SP. Rev Esc Enferm USP 2002;36:193-9. DOI: http://dx.doi.org/10.1590/S0080-62342002000200013
11. Faria PGS, Pecoits Filho R, Riella MC. Monitoramento de cus-to de manutenção de máquinas de hemodiálise. J Bras Nefrol 2005;27:63-9.
12. Brasil. Ministério da Saúde. Agência Nacional de Vigilância Sanitária. Manual de Tecnovigilância: abordagens de vigilância sanitária de produtos para a saúde comercializados no Brasil. Brasília: Ministério da Saúde; 2010.
13. Ruas MS, Silva HAN, Souza CRB. Sistema de hemodiálise: va-riáveis importantes para o funcionamento e segurança do pa-ciente. Anais do VII Congresso Norte Nordeste de Pesquisa e Inovação. Palmas; 2012.
14. Champy J, Greenspun H. Reengenharia da saúde: um manifesto pela revisão radical da atenção da saúde. Porto Alegre: Book-man; 2012.
15. Sorensen R, Iedema R, eds. Managing clinical processes in health services. Chatswood: Elsevier; 2008. DOI: http://dx.doi. org/10.1177/1363459307083699
16. Viacava F, Ugá MAD, Porto S, Laguardia J, Moreira RS. Avalia-ção de desempenho de sistemas de saúde: um modelo de análise. Ciênc Saúde Coletiva 2012;17:921-34.
17. Schraiber LB, Nemes MIB, Sala A, Peduzzi M, Castanheira ERL, Kon R. Planejamento, gestão e avaliação em saúde: identi-ficando problemas. Ciênc Saúde Coletiva 1999;4:221-42. DOI: http://dx.doi.org/10.1590/S1413-81231999000200002 18. Nwabueze U. In and out of vogue: the case of BPR in the NHS.
Manage Account J 2000;15:459-63.
19. Porter ME, Teisberg EO. Repensando a saúde: estratégias para melhorar a qualidade e reduzir custos. Porto Alegre: Bookman; 2007.
20. Porter ME, Lee TH. The strategy that will fix health care. Harv Bus Rev 2013;91:50-70.
21. GIL AC. Como elaborar projetos de pesquisa. 5a ed. São Paulo: Atlas; 2010. p.184.
22. Brasil. Ministério da Saúde. Agência Nacional de Vigilância Sa-nitária. Resolução-RDC Nº 154, de 15 de junho de 2004. Brasí-lia: ANVISA; 2004.
23. Finkler SA, Ward DM, Baker JJ. Essentials of cost accounting for health care organizations. 3rd. Burlington: Jones & Bartlett Publishers; 2007.
24. Corrêa HL, Corrêa CA. Administração da produção e de opera-ções: manufatura e serviços: uma abordagem estratégica. 3a ed. São Paulo: Atlas; 2012.
25. Steinbrook R. Controlling health care costs in Massachusetts with a global spending target. JAMA 2012;308:1215-6. PMID: 22918407 DOI: http://dx.doi.org/10.1001/2012.jama.11322 26. Stabile M, Thomson S, Allin S, Boyle S, Busse R, Chevreul
K, et al. Health care cost containment strategies used in four other high-income countries hold lessons for the United States. Health Aff (Millwood) 2013;32:643-52. DOI: http://dx.doi. org/10.1377/hlthaff.2012.1252
27. Slack N, Chambers S, Johnston R. Administração da produção. 2a ed. São Paulo: Atlas; 2002. p.747.
28. Paim R, Cardoso V, Caulliraux H, Clemente R. Gestão de pro-cessos: pensar, agir e aprender. Porto Alegre: Bookman; 2009. 29. Lunkes RJ. Contorle de gestão: estratégico, tático, operacional,