ISSN 1546-9239
© 2009 Science Publications
Corresponding Author: N. Asim, Solar Energy Research Institute, UKM, 43600 Bangi, Selangor, Malaysia Tel: +60-3-89214592 Fax: +60-3-89214593
Modeling the Effect of P-N Junction Depth on the Output of
Planer and Rectangular Textured Solar Cells
1F. Jahanshah, 1K. Sopian, 2S.H. Zaidi, 1 M.Y. Othman, 1N. Amin and 1N. Asim 1Solar Energy Research Institute, UKM, 43600 Bangi, Selangor, Malaysia 2Gratings, Incorporated, 2700 B Broadbent Pkwy., NE, Albuquerque, NM 87107, USA
Abstract: Problem statement: High cost of the solar cells is one of the important limitations in
extensively using of the photovoltaic panels. Thin monocrystalline silicon solar cell could be reduce the cost but lost the absorption efficiency. Surface texturing help to enhance absorption. Using of advance texturing by diffraction grating was suggested for high absorption. It is necessary to investigate the scattering effect of diffraction grating with other solar cell parameter for optimization. In first step we concentrate on p-n junction position impact by modeling. Approach: The effect of position of p-n junction on the output current for both micro rectangular texturing and planer surface in solar cell has been investigated by ray tracing. Modeling of nine pairs solar cells with the same texture and planer surfaces but with different p-n junction position are done by using Atlas software. The output short current is a criterion for determining of efficiency performance. By comparing of the short current for each pair we was find the impacts of texturing and p-n junction depth on the monocrystalline thin film. Results: Light scattering due to diffraction grating inside the silicon with rectangular depth of 5 µm and a range of 5-40 µm p-n junction depths are investigated. The difference of short current in textured to bare silicon showed the enhancement from 4-8 µA when the p-n junction depths vary from 5-45 µm. Conclusions: Comparison of short current output confirms the correlation between p-n junction depth and texturing. Advanced texturing improve the solar cell efficiency but the effectiveness change with the p-n junction depth and need a simultaneous optimization for getting the high efficiency solar cell.
Key words: texturing, thin solar cell, efficiency, depth of p-n junction, current variation
INTRODUCTION
It is well known that silicon surface texturing is one of the most important issues to fabricate low-cost and high efficiency in thinner wafer thickness solar cells. Light reflected at a textured surface hits another surface and reenters then travel more inside the cell, whereby the light is efficiently absorbed into the solar cell.
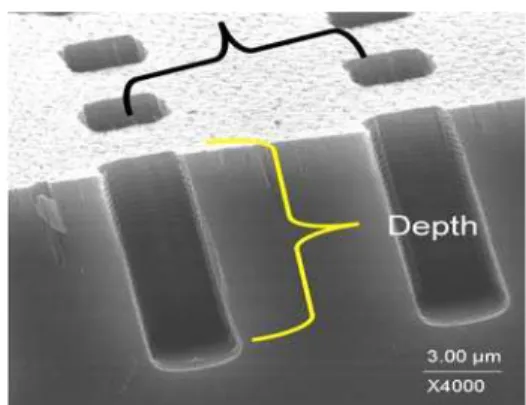
Alkaline etchants, such as NaOH and KOH, are widely used in the processing of monocrystalline (100) solar cells, leading to the formation of pyramidal etch structures on the wafer surface when used at low temperatures and concentrations[4]. Scanning electron microscope pictures of 2D grating structures fabricated using DRIE techniques is shown in Fig. 1[3].
In the area of microelectronics, photolithography has been used for texturing and investigation has shown that texturing resulted is higher efficiencies for silicon based solar cells. Example of textured solar cells is in
PERL or PESC cell. In both of these two kinds, diffusion and surface passivation, by oxide or nitride, are effected early in the cell fabrication sequence, after surface etching and texturing[1].
Investigation in nanorough surface suggested the application of wave optic analysis in light absorption, especially when surface has a periodic case similar a diffraction grating (rectangular periodic structure)[8].
In numerical method especially Fast Fourier Transformation (FFT) caused in some opto-electronic software we could directly solve Maxwell equation (or Helmholtz equation).The usage of SILVACO software ATLAS are already investigated in solar cell application[5]. The electrical characteristics of a solar cell based on virtual fabrication of its physical structure, allowing for direct manipulation of materials, dimensions and doping can be determined.
In this study, an attempt was made to model the effect of p-n junction depth on output of planer and rectangular textured solar cell in 2D geometric optics.
MATERIALS AND METHODS
Mathematical approach: For understanding of solar
cell issue, it is important to know about light’s theories, interaction of light with materials, producing the electron and hole in semiconductors in a p-n junction and finally and creative current electricity.
In geometrical optic, light define by the rays. Every ray move straight with especial amounts of energy .Here because of interaction of light with material, we need know a formula that indicate electrical field of ray at anyplace that it would been there. We can also calculate for any transmitted or reflected ray such a simple formulas.
The reflection and transmission electrical field of the light for parallel and perpendicular polarization are calculated as shown in Eq. 1-4. Equation of 5 and 6 show their coefficients:
2 i 1 t
r i
1 t 2 i
n cos n cos
E E
n cos n cos (Parallel polarization)
θ − θ
=
θ + θ (1)
2 i
t i
1 t 2 i
2n cos
E E
n cos n cos
(Parallel polarization)
θ =
θ + θ (2)
1 i 2 t
r i
1 i 2 t
n cos n cos
E E
n cos n cos
(Perpendicular polarization)
θ − θ
=
θ + θ (3)
1 i
t i
1 i 2 t
2n cos
E E
n cos n cos
(Perpendicular polarization)
θ =
θ + θ (4)
2 r i E R E =
(5)
2 r 2 t
i 1 i
E n cos T
E n cos
θ
= θ
(6)
where, Ei , Er and Et refer to electric field of the incident wave, field of the reflected wave and field of the transmitted wave, respectively. R and T refer to the reflection coefficient and the transmission coefficient, respectively, while n1 and n2 refer to the refractive index on the incident side and the refractive index on the transmission side, respectively[2].
The angles of reflection and transmission are given in Eq. 7 and 8:
r i
θ = θ (7)
1 i 2 t
n sinθ =n sinθ (8)
Where:
θI = The angle of incidence
θt = The angle of transmission
θr = The angle of reflection
As shown in Eq. 9, Poisson’s Equation relates the electrostatic potential to the space charge density:
(
)
. p
∇ ε∇ψ = − (9)
Where:
Ψ = The electrostatic potential
ε = The local permittivity
Ρ = The local space charge density
The reference potential can be defined in various ways. The local space charge density is the sum of contributions from all mobile and fixed charges, including electrons, holes and ionized impurities.
The electric field is obtained from the gradient of the potential:
Ev= ∇ψ (10)
The continuity equations for electrons and holes are defined by below equations:
n n n
n 1
.J G R t q
∂ = ∇ + −
∂
v
p p p
p 1
.J G R t q
∂ = ∇ + −
∂
v
(12)
Where:
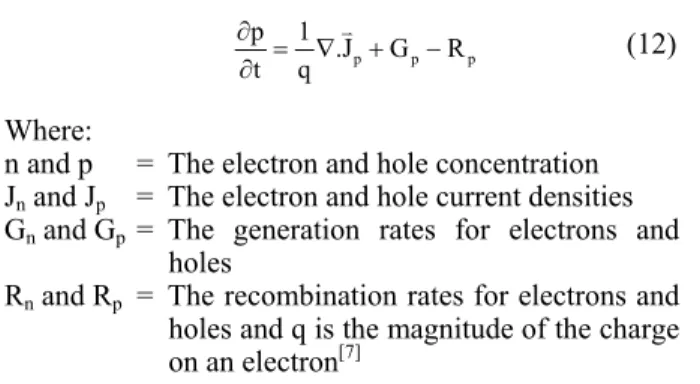
n and p = The electron and hole concentration Jn and Jp = The electron and hole current densities Gn and Gp = The generation rates for electrons and
holes
Rn and Rp = The recombination rates for electrons and holes and q is the magnitude of the charge on an electron[7]
The cumulative effects of the reflection coefficients, transmission coefficients and the integrated loss due to absorption over the ray path are saved for each ray. The generation associated with each grid point can be calculated by integration of the Generation Rate Formula Eq. 13 over the area of intersection between the ray and the polygon associated with the grid point:
* y 0
P
G e
hc
−α
λ
= η α (13)
Where:
P* = Contains the cumulative effects of reflections, transmissions and loss due to absorption over the ray path
ηo = The internal quantum efficiency which represents the number of carrier pairs generated per photon observed
y = Relative distance for the ray in question h = Planck’s constant
λ = The wavelength
c = The speed of light. α is given by Eq. 14 4
k
π α =
λ (14)
Where:
α = The absorption coefficient λ = The wavelength
k = The imaginary part of the optical index of refraction[6]
Atlas modeling: In this investigation, the chosen solar
cell was made with Very Large Scale Integration method (VLSI). A [100] silicon wafer with 50 µm thickness and 1×10¹⁴ boron concentration was chosen. By implant of phosphor with 5×10¹⁵ and energy 10 ev we made the p-n junction. In our investigation, the diffuse time and the temperature were considered as the variable parameters. By changing these two variables we could simulate eight solar cells with a p-n junction at 5-40 µm below the first surface. Comparisons of these solar cells were done using the I-V graphs for
both simple and textures surfaces. For textured surface using the ATLAS software, rectangular channels with the dimensions 5×5×5 µm has been chosen. As we decided to use ray tracing method in our investigation and we try to trace the ray with only 90° incident angle, the rectangular channels changed to conical shape as shown in Fig. 2. Figure 3 show the computer simulations of simple and textured surfaces of the solar cell with 5 µm p-n junction depth.
(a) (b)
Fig. 2: Changing the rectangular channel to conical shape. Angle of tilt and ray refraction are exaggerated. (a): Tilted wall and (b): Ray tracing in sidelong
(a)
(b)
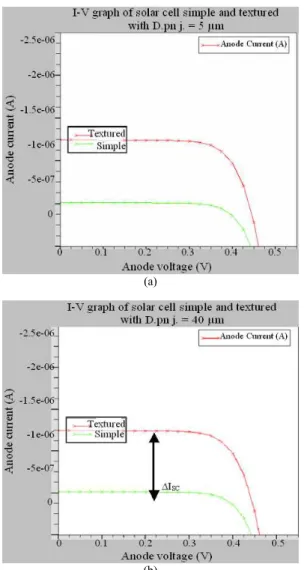
Fig. 4: I-V graph of solar cell with different p-n junction depth, (a): 5 µm and (b): 40 µm below the front surface
RESULTS AND DISCUSSION
In this study the eight solar cells with the same texturing pattern but different p-n junction depths were investigated. Figure 4a and b show the comparison of I-V graphs for 5 and 40 µm p-n junction depths for textured and planar solar cell, respectively. It was found that bare surface affected by the p-n junction depth more than textured surface and texturing of surface, make it more stable against variation of p-n junction depth. As depicted in Fig. 5, although the depth of p-n junction still is very important in textured surface, but it is less than planar surface dependence. As shown in Fig. 5, the effect of changing the position of p-n junction near to front surface in textured solar cell is negligible.
Fig. 5: Variation of photocurrent on the position of p-n jup-nctiop-n for bare ap-nd textured surface at 0.25V
In addition the depth of p-n junction has effectively affected the current in bare solar cell.The difference of short current in textured to bare silicon showed the enhancement from 4 µA to 8 µA when the p-n junction depths vary from 5µm to 45µm. By introducing the “∆Isc” as the short current difference in the case of textured and bare silicon, an increase in ∆Isc with p-n junction depth was found. Since the short current is a parameter which directly related to efficiency so it should be a parameter for analysis of solar cell performance too. In comparison, there is 21% decrease in short current when we use bare silicon instead of textured silicon in 5 µm p-n junction depth when this lost increase to 42% for 35 µm p-n junction (Fig. 5).
The lowest curve in Fig. 5 shows the difference output current between two solar cells. It could be recognized two maxima in it, the first one around depth of 10 µm and the second about the 33 µm.
CONCLUSION
REFERENCES
1. Green, M.A., J. Zhao, A. Wang and S.R. Enham, 2001. Progress and outlook for high-efficiency crystalline silicon solar cells. Solar Energ. Mater.
Solar Cells, 65: 9-16. http://www.ingentaconnect.com/content/els/09270
248/2001/00000065/00000001/art00072.
2. Jackson, J.D., 1975. Classical Electrodynamics. 2nd Edn., John Wiley and Sons, New York, USA., ISBN: 047143132X, pp: 880.
3. Jahanshah, F., K. Sopian, I. Ahmad, M.Y. Othman, A. Zaharim and S.H. Zaidi, 2007. Evaluation of 1d and 2d texturing of monocrystalline solar cell. Int. J. Energ., 1: 88-90. http://www.naun.org/journals/energy/ijenergy-15.pdf.
4. Markvart, T. and L. Castaner, 2003. Practical Handbook of Photovoltaics. 1st Edn., Elsevier Science Ltd., USA., ISBN: 1856173909, pp: 190-270.
5. Michael, S. and P. Michalopoulos, 2002. Application of the SILVACO/ATLAS software package in modeling and optimization of state-of-the-art photovoltaic devices. Proceeding of the 45th Midwest Symposium on Circuits and Systems, Aug. 4-7, IEEE Computer Society, Washington DC., USA., pp: II-651-II-654. http://ieeexplore.ieee.org/xpl/freeabs_all.jsp?arnum ber=1186946.
6. Neamen, D.A., 1992. Semiconductor Physics and Devices: Basic Principles. 1st Edn., IRWIN, Boston, ISBN: 10 025608405X, pp: 746.
7. Nelson, J., 2003. The Physic of Solar Cells. 1st Edn., Imperial College Press, London, ISBN: 13: 9781860943492, pp: 450.
8. Zaidi, S.H., R. Marquadt, B. Minhas and J.W. Tringe, 2002. Deeply etched grating structures for enhanced absorption in thin C-Si solar cells. Proceeding of the 20th Conference on Photovoltaic Specialists, May 19-24, IEEE Computer Society, Washington DC., USA.,
pp: 1290-1293. DOI: http://ieeexplore.ieee.org/Xplore/login.jsp?url=/iel5