Leaf Equivalent Water Thickness assessment
using reflectance at optimum wavelengths
Mohammad Reza Mobasheri
*, Sayyed Bagher Fatemi
Remote Sensing Department, K.N.Toosi University of Technology, Tehran, Iran.
*Corresponding author: [email protected]
Received: 13 December 2012; Accepted: 02 August 2013
ABSTRACT: Leaf water content is an important parameter in environmental monitoring. The present study investigated the relation
between leaf Equivalent Water Thickness (EWT) as a parameter to estimate the leaf water content and the reflectance in 400-2,500 nm spectral range. The data used were the well-known Leaf Optical Properties Experiment 93 (LOPEX93) field collected data. Four hundred leaf samples were used, 320 of which for modelling and the remaining 80 for testing the model. Four different approaches were
investigated in this study: 1) linear regression between reflectance in individual wavelength and EWT; 2) the difference of reflectance in
two wavelengths and EWT; 3) ratio of reflectance in two wavelengths and EWT; and finally 4) the normalized difference of reflectance in two different wavelengths and EWT. The results showed that the band combinations such as ratio and normalized difference had higher regressions with leaf water content. In addition, the findings of this study showed that some parts of the near infrared (NIR) and
short wave infrared (SWIR) of the spectrum provided higher accuracies in EWT assessment, and correlations of more than 90% were
achieved. Finally, this investigation showed that a wide range of wavelengths could be used for EWT assessment task. Despite the
general belief in using water absorption bands for leaf water content assessment, this study shows that water absorption bands are not necessarily productive as other wavelengths have the potential to generate better results.
KEYWORDS: Equivalent Water Thickness, linear regression, remote sensing, spectrometry.
INTRODUCTION
Water is an important parameter in determining biochemical characteristics as it constitutes 40-80% of the volume of plant leaves (Shen et al. 2005). Different indexes and wavelengths in different researches are claimed to have the highest correlations with the leaf water content. As Danson and Bowyer (2004) argue, the wavelength at which the strongest correlation with leaf water content is seen may depend on the magnitude and range of leaf water content in the leaf sample under study. Each one of these selected wavelengths is believed to be appropriate for determination of leaf water content in a particular vegetation species.
From different indexes for measurement of leaf water content available in the literature (Ceccato et al. 2001, Danson et al. 1992, Wang et al. 2009), two of them, i.e. Full Moisture Content (FMC) and Equivalent Water Thickness (EWT) are more often addressed. FMC is the ratio of leaf water mass to either dry or wet mass of leaf and is shown by Equation 1 (Zhang et al. 2010):
FMC (%) = FW -DW
FW (or DW)x 100 (1)
(A) of leaf and is calculated by using Equation 2 (Bowyer and Danson 2004):
EWT = FW -DW A (g cm
-2) (2)
These two indexes are not necessarily related to each other and can vary with leaf characteristics. Ceccato et al. (2001) showed that the change in leaf reflectance values in short wave infrared (SWIR) region is more related to EWT than to FMC. This is because EWT is directly related to the depth of absorption bands in SWIR and consequently compared to FMC, so EWT has better correlation with leaf spectral parameters (Danson and Bowyer 2004, Shen et al. 2005).
Precise measurement of leaf water content in laboratory is time consuming if not expensive (Riaño et al. 2005a) and subjected to instrumental and human errors (Wang et al. 2009). Different studies revealed wavelengths in which leaf reflectance is influenced by water content (Datt 1999, Wang et al. 2009, Zhang et al. 2012). Hence, using spectroradiometry and remote sensing technology, a possibility to reduce time and cost emerges. In addition, it may increase the accuracy of measurements in some extent.
On this respect, studies have estimated leaf EWT by using either broad waveband ratios (Gao 1996) or narrow wavebands in the near infrared (NIR) and SWIR in simple ratios or normalized difference forms (Ceccato et al. 2001). To estimate leaf EWT, stepwise regression and leaf reflectance model inversion can also be used ( Jacquemoud et al. 2000). Many indexes have been introduced and most of them are empirical (Ceccato et al. 2002), mostly in the form of the ratio of two reflectance values or a combination of two or more reflectance values (Zhang et al. 2010).
Zhang et al. (2010) have reported five absorption bands for water in 400–2,500 nm spectral region: 970; 1,200; 1,450; 1,930 and 2,500 nm. Riaño et al. (2005b) specified that 1,400– 2,500 nm range provides the highest correlation with EWT. Danson et al. (1992) used six water absorption bands centred on 975; 1,175; 1,450; 1,650; 1,950 and 2,250 nm for leaf water content estimation. The linear correlation analysis showed that there exists a statistically significant correlation between water content parameters and leaf reflectance at 1,450, 1,650 and 2,250 nm, however, this correlation was not seen at 975 and 1,175 nm absorption bands. The study of Danson et al. (1992) showed that when the leaf internal structure varies, the first derivative of leaf reflectance is superior to the original reflectance data for the estimation of leaf water content. It is believed that the variation in leaf structure causes the magnitude of leaf reflectance to change irrespective of the leaf water content. However, the relative “depths” of the
water absorption features in the reflectance spectra seem not be affected by leaf structure (Danson et al. 1992). As the depth of an absorption feature increases, the slopes on the edges of the feature also increase. As a result, the first derivatives of the reflectance spectra at wavelengths corresponding to these slopes can be closely related to the water content of the leaves (Danson et al. 1992).
A review of related studies shows that most of water absorption bands have been used for leaf water content assessment. However, there are still few spectral regions that have not received sufficient attention by the researchers. Additionally, most of the studies conducted so far have focused on one particular plant species and their results cannot equally be applied to other species. Therefore, it is important to define an index which can attain for a great number of plant species and also operates in a wider range of the electromagnetic spectrum. The present study was devoted to this task as we aimed to obtain wavelengths through which an accurate estimation of the EWT for most leaf species can be achieved. Thus, this work intended to find out the best possible wavelengths in order to cover a variety of available species. The best data in access were those collected in Leaf Optical Properties Experiment 93 (LOPEX93) campaign. Finally, since the use of water vapor absorption bands was avoided in this study, it would be possible to use the results of this work in remote sensing of EWT where it is believed that the atmospheric water vapor content can no longer affect the results.
MATERIAL AND METHODS
The LOPEX93 data set was produced during an experiment conducted by the European Commission (Ispra, Italy) (Hosgood et al. 1994). Many researchers have used this data set in their studies (Bowyer and Danson 2004, Riaño et al. 2005a, Shen et al. 2005). This data set includes measurements of different parameters related to biochemical constituents along with the reflectance spectra of 120 different leaf species. The present study was based on LOPEX data where 320 spectra samples from 80 different species (Hosgood et al. 1994) were used and EWT for all these samples were calculated. The calculated EWT ranged from 0.0037–0.0525 g cm-2 with a mean of 0.0114 and a
standard deviation of 0.0070 g cm-2.
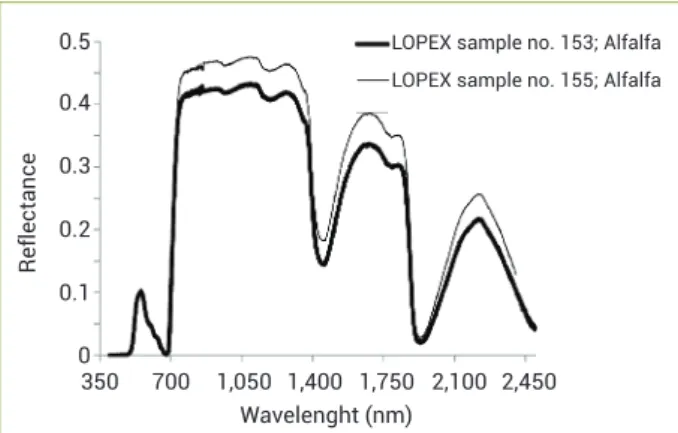
In the LOPEX93 experiment, spectra were scanned over 400–2,500 nm wavelength region. The spectral resolution varied from 1 to 2 nm in the visible/near infrared (400–1,000 nm) and from 4 to 5 nm in the middle infrared (1,000–2,500 nm) (Hosgood et al. 1994). Two sample reflectance spectral curves of the data are shown in Figure 1.
measured by a spectroradiometer. All 400 reflectance curves from these 80 species were collected in the 400–2,500 nm wavelength region. Out of these data, 320 (80%) were used for modelling and another 80 sample data were kept for validation.
By conducting two methods in this work, the linear relationship between leaf reflectance and its water content was investigated. In the first method, called (EWT-R), using least square method, the linear relationship between EWT and reflectance in each wavelength in different parts of electromagnetic spectrum (400–2,500 nm) was investigated. This enabled us to find those wavelengths at which the reflectance has a strong relationship with EWT. The second method called (EWT-I) was focused on the relationship between EWT and different indexes. These indexes are made from reflectance values in different parts of electromagnetic spectrum. In EWT-I method, the linear relationship between EWT and reflectance difference (Equation 3), simple ratio values of reflectance (Equation 4) and normalized difference of reflectance values (Equation 5) were investigated.
EWT= a(Rλi -Rλj) +b, i, j= 1,2,...,i≠ j (3)
Rλi Rλj +b
EWT= a (4)
Rλi -Rλj Rλi +Rλj +b
EWT= a (5)
Where Rλ
i is reflectance at wavelength λi and a and b are
regression coefficients.
To select the most appropriate wavelength, a complete analysis was carried out using a combination of reflectance values for every wavelength in 400–2,500 nm region.
RESULTS
The results for the EWT-R method are partly in line with the findings of Riaño et al. (2005b). The mentioned authors studied 245 samples of fresh leaves from 37 different species in the region of 1,400–2,500 nm. Their findings show that the highest and lowest values of R2 are within SWIR region of the spectrum,
i.e. from 1,300–2,500 nm. The R2 values calculated for the first
method in the present study also give support to the findings of Riaño et al. (2005b) and are shown in Figure 2.
The lowest value of R2 (0.00001) is at 1,318 nm
wavelength and the highest value (0.63) is at 1,400 nm; the latter wavelength is an important water absorbing point. 1,900 nm is another strong water absorption band with R2
value of 0.35. However, as Wang et al. (2009) pointed out, other crests and troughs in the curve of Figure 2 are also potentially important. The most important wavelength of Figure 2 is shown in Table 1.
The results of EWT-I method are shown in Figures 3A–C. These three figures display the reflectance difference, the simple ratio of two reflectance values and the normalized difference of two reflectance values, respectively. To analyse the results in this case, the values of calculated R2 was grouped into 4 classes:
below 0.5, 0.5–0.8, 0.8–0.9, and larger than 0.9.
Figure 3A shows the results of regression between EWT and indexes in the form of Equation 3 for two reflectance values of
Rli and Rlj. As it was expected, the visible region up to 1,200 nm for the first reflectance (Rli) and up to 800 nm for the second reflectance (Rlj) produce very low R2 values in a linear formula. To
this, we might add some other parts in SWIR and NIR with low values of R2 (lower than 0.5). As Figure 3A shows, the wavelength
region for R2 values larger than 0.8 are confined between 740–
1,400 nm for Rli and 740–1,840 nm for Rlj (red and green colours). To limit our attentions to R2 values larger than 0.9 (red colour),
Figure 1. Samples of Alfalfa spectral reflectance curves. 0.1
LOPEX sample no. 153; Alfalfa
LOPEX sample no. 155; Alfalfa
350 700 1,050 1,400
0.2
0
Wavelenght (nm)
Reflectance
0.4
0.3 0.5
1,750 2,100 2,450
Figure 2. R2 values of linear regression between Equivalent Water Thickness and individual leaf reflectance values.
0.1
350 600 850 1,100
0.2
0
Wavelenght (nm)
R
2 v
alues
0.4 0.7
0.3 0.6
0.5
the sparse points in 1,140–1,176 nm and 1,070–1,140 nm regions are selected for Rli and Rlj, respectively. This is also true for 1,315– 1,340 nm and 1,264–1,300 nm regions. The highest R2 of 0.92 for
subtraction formula is for reflectance values in 1,152 and 1,134 nm for Rli and Rlj, respectively. It should be noted that the correlation between EWT and individual reflectance values in these wavelengths are as low as 0.05 and 0.165, respectively (Figure 2).
Figure 3B shows the results of regression between EWT and indexes in the form of Equation 4 for the two reflectance values of Rli and Rlj. The reflectance ratios in the visible up to 800 nm region have the lowest correlation with EWT. This situation also holds for wavelength larger than 1,850 nm in the SWIR region. The region for R2 values larger than 0.8 is confined between 750–
1,960 nm for the numerator reflectance and from 720–1,840 nm for the reflectance at the denominator (red and green colours). For R2 values larger than 0.9 (red colour), this is confined to the
regions 1,050–1,870 nm and 741–1,376 nm for numerator and denominator reflectance, respectively. The highest R2 values are
for the ratio of reflectance in 1,128 nm to the reflectance in 1,152 nm with a value of 0.95.
Finally, Figure 3C shows the results of regression between EWT and indexes in the form of Equation 5 for two reflectance values of Rli and Rlj. As can be seen in Figure 3C, the reflectance values in the visible region up to 900 nm produce the lowest value for R2. This is also true for the
wavelength region beyond 1,850 nm.
The highest R2 value of 0.95 belongs to the reflectances
at 1,152 and 1,128 nm. These two wavelengths were also in simple ratio formula where 1,152 nm was one of the selected wavelengths in subtraction formula. It should be noted that the wavelength is located at the shoulder of 1,200 nm water absorption band. This is more reliable compared to
Table 1. The extreme values of regression values (R2) based on different wavelengths
Wavelength (nm)
Point type in the curve
of Figure 2 (Local) R2 (Regression value)
425 max 0.223
686 min 0.056
750 max 0.284
979 min 0.158
1,073 max 0.242
1,318 min (global) 0.00001
1,375 mean 0.334
1,400 max (global) 0.635
1,526 max 0.631
1,672 min 0.399
1,865 max 0.619
1,905 mean 0.303
1,928 min 0.212
Figure 3. R2 values for regression between Equivalent Water Thickness and (A) difference of reflectances in two wavelengths,
(B) simple ratio of reflectance values in two wavelengths, and (C) normalized differences of two reflectance values. The vertical and horizontal axes are wavelengths in nanometers. Vertical axes
are for λi and horizontal axes are for λj.
A
B
C
400 800 1,200 1,600 Wavelenght (nm)
W
a
veleng
ht
(nm)
1,200
1,600
2,000 800
2,400
400 2,000 2,400
400 800 1,200 1,600 Wavelenght (nm)
W
a
veleng
ht
(nm) 1,200
1,600
2,000 800
2,400
400 2,000 2,400
400 800 1,200 1,600
Wavelenght (nm)
W
a
veleng
ht
(nm) 1,200
1,600
2,000 800
2,400
400 2,000 2,400
R2<0.5
0.5<R2<0.8
0.8<R2<0.9
the Normalized Difference Water Index (NDWI) of Bowyer and Danson (2004), in which reflectance values at 860 and 1,240 nm in the form of normalized difference index are used and a R2 of 0.64 with EWT is achieved. As can be seen
in Figure 3C, the region of the spectrum that can produce R2
values of more than 0.8 is confined between 740–1,860 nm region (red and green colours). However, if the higher values of R2 (i.e. larger than 0.9) are of interest, then the wavelength
region is 1,030–1,380 nm (red colour). Therefore, by using reflectance values in these regions and a linear regression between EWT and normalized difference equation, one can estimate EWT with confidences more than 90%.
DISCUSSION
As Figure 2 shows, the leaf reflectance in visible and NIR region has the least correlation with EWT. This could be due to the strong effects of leaf chlorophyll content that can cover the effects of water in these wavelengths.
A sudden drop in the R2 value at 1,928 nm is an unexpected
phenomenon. Even in the shoulder of water absorption region of the spectrum, there are wavelengths to which the leaf water content might not be sensitive. From 2,340 nm, the R2
decreases and the leaf reflectance loses its linear correlation with EWT values. Therefore, not all wavelengths in the SWIR can have reflectance values highly correlated to EWT.
Despite high correlation between water absorption bands and EWT, the use of these bands in airborne and spaceborne remote sensing is not recommended. This is mostly due to the atmospheric water content, and the distinction between these two bands is nearly impossible (Datt 1999). Moreover, Figure 2 shows a lack of strong relationship between single reflectance and EWT in one particular wavelength (the highest value is 0.63), where this level of correlation is insufficient in the applied and theoretical applications. The findings of this study show that it is possible to use a combination of reflectance in wavelengths, in which the correlation between EWT and reflectance is extreme.
The results of the Equations 3 to 5 and their combinations were not the same. This is shown in Figure 3, in which different regression in different parts of the spectrum regions can be seen. The results of the two methods (R and EWT-I) support the findings of other studies, such as Ceccato et al. (2001) and Zhang et al. (2012). The comparison of the results of the three algorithms (Equations 3 to 5) leads us to some interesting conclusions. The results in Figure 3, compared to those in Figure 2, show that there might exist two reflectance values having poor correlation with EWT individually; but when they are used in an index, this index is highly correlated to EWT.
Compared to Figures 3A and C, Figure 3B has a wider area with R2 more than 0.9 (red colour). This suggests that simple
ratio indexes may have more correlation with EWT compared to the other tested equations. The region of R2 values greater than
0.8 for reflectance difference (Figure 3A) is very small compared to the other two indexes. It can be inferred from this finding that the reflectance difference is weaker for EWT estimation. For the R2 values larger than 0.9, the simple ratio is the most
suitable index for EWT estimation. However, as the asymmetry of Figure 3B reveals, the place of insertion of the two reflectance values (numerator and denominator) is important.
The findings of this study show that, despite the researcher’s belief in using normalized difference indexes, the simple ratio is more suitable for EWT assessment. Also, the use of either of these indexes should not be confined to only two particular wavelengths and any other pair of reflectance values in these regions is equally allowed. This is important when we have sensors with low spectral resolution or when we have some noisy bands in hyperspectral products and we have to replace them by other bands.
Based on the best regressions values achieved, the Equation 6 takes the following form (Figure 4):
R1,128
R1,152 -0.3434
EWT= 0.3418 (6)
It can be seen in Figure 4 that the values for the ratio R1,128/ R1,152 are confined between 1.007–1.08 (horizontal axis). To evaluate the model, i.e. Equation 6, the remaining 80 samples
Figure 4. The linear relationship between Equivalent Water Thickness (EWT) and the ratio of two reflectance values at 1,128 and 1,152 nm for 320 spectral signatures.
0.02
0.01
Fitted line
1 1.05 1.1 1.15
0
Ratio of reflectance at 1,128 to the reflectance at 1,152 nm
Measur
ed
EW
T
(g
cm
-2) 0.04
0.05
Table 2. Data related to those species having relative errors more than 25%
Sample name (as in LOPEX) Measured EWT (g cm-2) Model predicted EWT (g cm-2) Relative error (%)
Rice 2/2 0.010 0.013 26.569
Lettuce 0.021 0.015 28.156
Willow 0.011 0.014 32.401
Oak 1/2 0.007 0.005 33.564
Hazelnut 2 0.005 0.003 41.773
Rice dry leaves 0.008 0.012 46.278
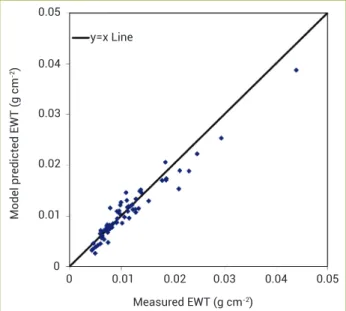
LOPEX: Leaf Optical Properties Experiment; EWT: Equivalent Water Thickness. Figure 5. The scatter plot of laboratory measured Equivalent Water Thickness (EWT) (80 samples) versus those calculated from model (Equation 6).
0.02
0.01
y=x Line
0
Model
pr
edicted
EW
T
(g
cm
-2)
0.04 0.05
0.03
0.02 0.01
0 0.03 0.04 0.05
Measured EWT (g cm-2)
were used. The result is shown in a scatter plot (Figure 5) against laboratory-measured values.
The relative Root Mean Square Error (RMSE) with respect to the mean measured values was calculated. The value of 18% was found for the total 80 samples and, for 6 of these samples, i.e. Lettuce, Oak, Rice, Hazelnut, Willow, and Rice dry leaves (Table 2), the relative RMSE was higher than 25% (between 26-46%). Overall, as can be seen in Figure 5, a robust linear positive relationship is identified between model’s predicted and laboratories measured values. The bulk of available research on the relationship between the leaf reflecting properties and its water content (especially EWT) is mostly confined to some special species and for some particular wavelengths. However, in this work, it is tried not to limit ourselves to a particular species and to a particular wavelength region and, consequently, the method can be applied to every species for calculation of EWT.
This paper started investigating the most appropriate wavelengths in which the leaf reflectance and the indexes made by these reflectance values, have the highest correlation with
the leaf EWT. In order to obtain wavelengths through which an accurate estimation of the EWT for most leaf species can be achieved, LOPEX93 data were used.
Two methods of EWT-R and EWT-I were introduced in this work. In EWT-R, the linear relationship between EWT and reflectance in each wavelength in different parts of electromagnetic spectrum (400–2,500 nm) was investigated. The least value of R2 (0.00001) was at 1,318 nm wavelength
and the highest value (0.63) was at 1,400 nm; the latter wavelength is an important water absorbing point. In the second method (EWT-I), the relationship between EWT and indexes such as reflectance difference, simple ratio and normalized difference of reflectance values were investigated. For EWT-I method, to limit our attentions to R2 values larger
than 0.9, the sparse points in 1,140–1,176 nm and 1,070– 1,140 nm regions were appropriate. This is also true for 1,315– 1,340 nm and 1,264–1,300 nm regions. The highest R2 of 0.92
for subtraction formula is for reflectance values in 1,152 and 1,134 nm.
For the reflectance ratios, the region for R2 values larger
than 0.8 is confined between 750–1,960 nm for the numerator reflectance and from 720–1,840 nm for the reflectance at the denominator. For R2 values larger than 0.9, it is confined
to the regions 1,050–1,870 nm and 741–1,376 nm for numerator and denominator reflectance, respectively. The highest R2 values are for the ratio of reflectance in 1,128 nm
to the reflectance in 1,152 nm with a value of 0.95. Finally, for normalized difference index, the results of regression with EWT show that the reflectance values in the visible region up to 900 nm produce the lowest value for R2. This is also true for
the wavelength region beyond 1,850 nm. The highest R2 value
of 0.95 belongs to the reflectance values at 1,152 and 1,128 nm. These two wavelengths were also in simple ratio formula in which 1,152 nm was one of the selected wavelengths in subtraction formula.
ACKNOWLEDGEMENTS
Bowyer P, Danson FM (2004) Sensitivity of spectral reflectance
to variation in live fuel moisture content at leaf and canopy level. Remote Sensing of Environment 92:297-308.
Ceccato P, Flasse S, Tarantola S, Jacquemoud S, Grégoire J (2001) Detecting vegetation leaf water content using
reflectance in the optical domain. Remote Sensing of Environment 77:22-33.
Ceccato P, Gobron N, Flasse S, Pinty B, Tarantola S (2002)
Designing a spectral index to estimate vegetation water content from remote sensing data: Part 1: Theoretical approach. Remote Sensing of Environment 82:188-197.
Danson FM, Bowyer P (2004) Estimating live fuel moisture
content from remotely sensed reflectance. Remote Sensing of Environment 92:309-321.
Danson FM, Steven MD, Malthus TJ, Clark JA (1992) High-spectral
resolution data for determining leaf water content. International
Journal of Remote Sensing 13:461-470.
Datt B (1999) Remote sensing of water content in Eucalyptus leaves. Australian Journal of Botany 47:909-923.
Gao BC (1996) NDWI - A normalised difference water index for
remote sensing of vegetation liquid water from space. Remote Sensing of Environment 58:257-266.
Hosgood B, Jacquemoud S, Andreoli G, Verdebout J, Pedrini A, Schmuck G (1994) Leaf Optical Properties Experiment 93 (LOPEX93). European Commission, Joint Research Centre,
Institute for Remote Sensing Applications. Report EUR 16095 EN.
Jacquemoud S, Bacour C, Poilvé H, Frangi JP (2000) Comparison
of four radiative transfer models to simulate plant canopies reflectance: direct and inverse mode. Remote Sensing of Environment 74:471-481.
Riaño D, Ustin SL, Usero L, Patricio MA (2005a) Estimation of fuel moisture content using neural networks. Artificial Intelligence and Knowledge Engineering Applications: A Bioinspired Approach 3562:489-498.
Riaño D, Vaughan P, Chuvieco E, Zarco-Tejada PJ, Ustin SL
(2005b) Estimation of fuel moisture content by inversion of radiative transfer models to simulate equivalent water thickness and dry matter content: analysis at leaf and canopy level. IEEE
Transactions on Geoscience and Remote Sensing 43:819-826.
Shen Y, Shi R, Niu Z, Yan C (2005) Estimation models for vegetation water content at both leaf and canopy levels. Geoscience and Remote Sensing Symposium, 2005. IGARSS ‘05. Proceedings.
2005 IEEE International 2:1387-1389.
Wang J, Xu R, Yang S (2009) Estimation of plant water content by
spectral absorption features centered at 1,450 nm and 1,940 nm regions. Environmental Monitoring and Assessment 157:459-469.
Zhang J, Xu Y, Yao F, Wang P, Guo W, Li L, Yang L (2010) Advances
in estimation methods of vegetation water content based on optical remote sensing techniques. Science China Technological Sciences 53:1159-1167.
Zhang L, Zhou Z, Zhang G, Meng Y, Chen B, Wang Y (2012)
Monitoring the leaf water content and specific leaf weight of cotton (Gossypium hirsutum L.) in saline soil using leaf spectral