ACPD
11, 25785–25811, 2011OSIRIS stratospheric aerosol
A. E. Bourassa et al.
Title Page
Abstract Introduction
Conclusions References
Tables Figures
◭ ◮
◭ ◮
Back Close
Full Screen / Esc
Printer-friendly Version Interactive Discussion
Discussion
P
a
per
|
Dis
cussion
P
a
per
|
Discussion
P
a
per
|
Discussio
n
P
a
per
|
Atmos. Chem. Phys. Discuss., 11, 25785–25811, 2011 www.atmos-chem-phys-discuss.net/11/25785/2011/ doi:10.5194/acpd-11-25785-2011
© Author(s) 2011. CC Attribution 3.0 License.
Atmospheric Chemistry and Physics Discussions
This discussion paper is/has been under review for the journal Atmospheric Chemistry and Physics (ACP). Please refer to the corresponding final paper in ACP if available.
Odin-OSIRIS stratospheric aerosol data
product and SAGE III intercomparison
A. E. Bourassa, L. A. Rieger, N. D. Lloyd, and D. A. Degenstein
Institute of Space and Atmospheric Studies, University of Saskatchewan, Canada
Received: 5 July 2011 – Accepted: 4 September 2011 – Published: 16 September 2011
Correspondence to: A. E. Bourassa ([email protected])
ACPD
11, 25785–25811, 2011OSIRIS stratospheric aerosol
A. E. Bourassa et al.
Title Page
Abstract Introduction
Conclusions References
Tables Figures
◭ ◮
◭ ◮
Back Close
Full Screen / Esc
Printer-friendly Version Interactive Discussion
Discussion
P
a
per
|
Dis
cussion
P
a
per
|
Discussion
P
a
per
|
Discussio
n
P
a
per
|
Abstract
The scattered sunlight measurements made by the Optical Spectrograph and InfraRed Imaging System (OSIRIS) on the Odin spacecraft are used to retrieve vertical profiles of stratospheric aerosol extinction at 750 nm. The recently released OSIRIS Version 5 data product contains the first publicly released stratospheric aerosol extinction re-5
trievals, and these are now available for the entire Odin mission, which extends from the present day back to launch in 2001. A proof-of-concept study for the retrieval of stratospheric aerosol extinction from limb scatter measurements was previously pub-lished and the Version 5 data product retrievals are based on this work, but incorporate several important improvements to the algorithm. One of the primary changes is the 10
use of a new retrieval vector that greatly improves the sensitivity to aerosol scattering by incorporating a forward modeled calculation of the radiance from a Rayleigh atmo-sphere. Additional improvements include a coupled retrieval of the effective albedo, a new method for normalization of the measurement vector to improve signal-to-noise, and the use of an initial guess that is representative of very low background aerosol 15
loading conditions, which allows for maximal retrieval range. Furthermore, the Version 5 data set is compared to SAGE III 755 nm extinction profiles during the almost four years of mission overlap from 2002 to late 2005. The vertical structure in coincident profile measurements is well correlated and the statistics on a relatively large set of tight coincident measurements show agreement between the measurements from the 20
ACPD
11, 25785–25811, 2011OSIRIS stratospheric aerosol
A. E. Bourassa et al.
Title Page
Abstract Introduction
Conclusions References
Tables Figures
◭ ◮
◭ ◮
Back Close
Full Screen / Esc
Printer-friendly Version Interactive Discussion
Discussion
P
a
per
|
Dis
cussion
P
a
per
|
Discussion
P
a
per
|
Discussio
n
P
a
per
|
1 Introduction
Stratospheric aerosol has been measured from space for decades by solar occulta-tion, and the long-standing heritage and accuracy of these aerosol extinction measure-ments, in particular from the Stratospheric Aerosol and Gas Experiment (SAGE) series of instruments (SAGE, 1979 to 1981; SAGE II, 1984 to 2005; SAGE III, 2002 to 2005), 5
has provided an essential understanding of the stratospheric aerosol layer, particularly the impact of volcanic eruptions. The occultation technique is inherently stable through the built-in calibration measurement of the exo-atmospheric sun for each profile. It is also a direct measurement of the atmospheric optical depth, which is relatively easy to convert to aerosol extinction without requiring any assumptions regarding the aerosol 10
composition or size.
In the past decade, a number of satellite instruments capable of making spectral ob-servations of limb scattered sunlight have been in operation including OSIRIS, SAGE III (Rault, 2005; Rault and Loughman, 2007) and SCIAMACHY (Bovensmann et al., 1999) and GOMOS (Bertaux et al., 2010). Several studies have shown the capability for the 15
retrieval of vertical profiles of stratospheric aerosol parameters from measurements of the limb radiance at visible and near infrared wavelengths (Bourassa et al., 2007, 2008b; Rault and Loughman, 2007; Tukiainen et al., 2008). The limb scatter measure-ment technique has a distinct benefit over occultation in terms of sampling; vertical profiles can be obtained repetitively for tangent points in the sunlit hemisphere provid-20
ing nearly global coverage within a relatively short time period. However, the effect of stratospheric aerosol is a small component of the limb signal with a broad, smooth spectral signature making the retrieval of aerosol information difficult. In addition, the retrieval requires a detailed forward model calculation with accurate account of multiple scattering terms and assumptions regrading the microphysical and optical properties 25
of the aerosol in order to characterize the scattering properties.
ACPD
11, 25785–25811, 2011OSIRIS stratospheric aerosol
A. E. Bourassa et al.
Title Page
Abstract Introduction
Conclusions References
Tables Figures
◭ ◮
◭ ◮
Back Close
Full Screen / Esc
Printer-friendly Version Interactive Discussion
Discussion
P
a
per
|
Dis
cussion
P
a
per
|
Discussion
P
a
per
|
Discussio
n
P
a
per
|
from the near ultra-violet to the near infra-red (274 nm to 810 nm). The satellite was launched on 20 February 2001, into a sun-synchronous polar orbit and continues full operation to the present date providing a valuable data record that now spans a decade of observation. For further details on OSIRIS and Odin, see Llewellyn et al. (2004), and Murtagh et al. (2002), respectively.
5
Vertical profile information is obtained by successive vertical scans of the instru-ment’s line-of-sight, which is approximately 1 km at the tangent point. The scanning speed combined with the exposure rate dictates the sampling resolution of the mea-surements, which is approximately 2 km vertically, with successive scans approximately every 5 degrees along the satellite track, which is about 550 km. The local time of the 10
ascending node of the Odin orbit is 18:00 h. This configuration provides measure-ments of the sunlit summer hemisphere, global measuremeasure-ments during equinox, and no coverage of the mid to high latitude winter hemisphere. Northern high latitude mea-surements cease by mid-November when the line of sight is no longer illuminated. The 98◦ inclination of the orbit provides sampling of all latitudes up to 82◦ during normal 15
aeronomy operations.
A stratospheric aerosol retrieval was developed for use with the OSIRIS measure-ments by Bourassa et al. (2007). This algorithm used a spectral ratio as the retrieval vector and the SASKTRAN forward model for radiative transfer calculations (Bourassa et al., 2008a). The inversion was performed using the Multiplicative Algebraic Relax-20
ation Technique, which has now also been used successfully in the retrieval of ozone (Degenstein et al., 2009) and nitrogen dioxide (Bourassa et al., 2011) from the OSIRIS measurements. Herein we provide the details of several important improvements to this retrieval algorithm; these are used in the production of the first OSIRIS stratospheric aerosol data product for public release, Version 5. In Sect. 2 we present an alternative 25
ACPD
11, 25785–25811, 2011OSIRIS stratospheric aerosol
A. E. Bourassa et al.
Title Page
Abstract Introduction
Conclusions References
Tables Figures
◭ ◮
◭ ◮
Back Close
Full Screen / Esc
Printer-friendly Version Interactive Discussion
Discussion
P
a
per
|
Dis
cussion
P
a
per
|
Discussion
P
a
per
|
Discussio
n
P
a
per
|
results are compared with coincident and zonally average SAGE III measurements. In Sect. 4, the features of the OSIRIS Version 5 data set are highlighted.
2 Retrieval algorithm
2.1 OriginaL RETRIEVAL ALGorithm
In the original work by Bourassa et al. (2007) the retrieval vector for stratospheric 5
aerosol was defined as:
yj=ln I˜(j,λ2) ˜
I(j,λ1) !
, (1)
where ˜I(j,λ) represents the radiance at tangent altitudej and wavelengthλ, normalized by the radiance at the same wavelength from a higher tangent altitude. As discussed in Bourassa et al. (2007), this ratio, whereλ2> λ1, is dependent in a positive sense 10
on the Mie scattering contribution to the line of sight radiance. This is due to the fact that the wavelength dependence of the aerosol scattering is typically much weaker than that of the Rayleigh background. For the OSIRIS measurements, we have chosen
λ2=750 nm andλ1=470 nm in order to maximize the spread between the wavelengths without losing sensitivity to lower stratospheric tangent heights. This is also discussed 15
in detail in Bourassa et al. (2007).
The normalization tangent altitude was chosen, on a scan by scan basis, as the highest tangent altitude above which stray light becomes systematically larger than the measurement noise. For the OSIRIS measurements this is typically above the major-ity of the stratospheric aerosol layer. In practice, the normalization tangent altitude is 20
ACPD
11, 25785–25811, 2011OSIRIS stratospheric aerosol
A. E. Bourassa et al.
Title Page
Abstract Introduction
Conclusions References
Tables Figures
◭ ◮
◭ ◮
Back Close
Full Screen / Esc
Printer-friendly Version Interactive Discussion
Discussion
P
a
per
|
Dis
cussion
P
a
per
|
Discussion
P
a
per
|
Discussio
n
P
a
per
|
this scan is 35 km, which is the point where the retrieval vector goes to zero by defi-nition. A large component of the characteristic shape of this retrieval vector is smooth and monotonically increasing with decreasing tangent altitude due to the difference in optical depth of the Rayleigh atmosphere between the two wavelengths in the mea-surement vector. Deviations from this exponential-like characteristic shape are due to 5
aerosol. These deviations are typically positive, and are due to the relatively weaker wavelength dependence of the aerosol scattering cross section. For example, in this profile the peak of the Junge layer is evident at 22 km tangent altitude along with a enhancement due to cloud at 11 km tangent altitude.
By using Mie theory to calculate scattering phase functions and the scattering cross 10
section ratio for an assumed particle size distribution, the retrieval algorithm fits the forward model retrieval vector to the measurement by iteratively updating the aerosol extinction. In all of the following work, the particle size distribution is assumed to be single mode log-normal with a mode radius of 80 nm and a mode width of 1.6. These are representative of typical background conditions (Deshler et al., 2003). The solution 15
is then found using a Multiplicative Algebraic Reconstruction Technique, namely,
xi(n+1)=x(in)X
j
yjobs
yjmod Wj i
, (2)
where the iterative adjustment of the state parameter x at an altitude i is found by scaling the value of the state parameter from the previous iteration by a value that is based on the ratio of the measured and modelled measurement vectors. Further 20
detail on this method and the determination of the weighting factorsWj iare provided in Bourassa et al. (2007), Degenstein et al. (2004), Degenstein et al. (2009) and Bourassa et al. (2011).
Simulations performed by Bourassa et al. (2007) demonstrated the feasibility of the technique; however, convergence is slow and the width of the averaging kernel in-25
ACPD
11, 25785–25811, 2011OSIRIS stratospheric aerosol
A. E. Bourassa et al.
Title Page
Abstract Introduction
Conclusions References
Tables Figures
◭ ◮
◭ ◮
Back Close
Full Screen / Esc
Printer-friendly Version Interactive Discussion
Discussion
P
a
per
|
Dis
cussion
P
a
per
|
Discussion
P
a
per
|
Discussio
n
P
a
per
|
shown in Eq. (1), if the measured retrieval vector is greater than the modelled result, this is an indication that more aerosol is required in the modelled atmospheric state. However, the multiplicative factor in Eq. (2) that is then used to update the state param-eter is non-linear due to the large contribution in the retrieval vector from the Rayleigh background. That is, if the retrieval vector calculated by the model is half of that of the 5
observation, considerably more than double the current value of aerosol extinction in the forward model is required for convergence. In the following section we present an alternative retrieval vector that increases the sensitivity to aerosol, resulting in faster convergence and a more sharply peaked averaging kernel in the lower stratosphere.
2.2 Modified retrieval vector 10
In addition to the retrieval vector as defined by Bourassa et al. (2007), the left panel of Fig. 1 also shows the same retrieval vector calculated using forward model radiances obtained using the SASKTRAN model. This SASKTRAN calculation was performed using European Centre for Medium-Range Weather Forecasts (ECMWF) pressure and temperature profiles interpolated to the OSIRIS scan location; the ozone and nitrogen 15
dioxide profiles were taken from OSIRIS retrievals of these parameters for this scan. The model calculation has no aerosol, i.e. it is the result for a molecular, or Rayleigh, atmosphere. As such, the characteristic shape of the retrieval vector follows the smooth exponential-like profile discussed above and is considerably lower in value than the retrieval vector due to the lack of contribution from aerosol scattering.
20
A modified formulation of the retrieval vector is obtained by taking the difference between the logarithm of the spectral ratio for the measurements and the same for the modelled Rayleigh atmosphere,
yj k=ln
I(j,λ
2)
I(j,λ1)
−ln
IRay(j,λ2)
IRay(j,λ1) !
ACPD
11, 25785–25811, 2011OSIRIS stratospheric aerosol
A. E. Bourassa et al.
Title Page
Abstract Introduction
Conclusions References
Tables Figures
◭ ◮
◭ ◮
Back Close
Full Screen / Esc
Printer-friendly Version Interactive Discussion
Discussion
P
a
per
|
Dis
cussion
P
a
per
|
Discussion
P
a
per
|
Discussio
n
P
a
per
|
In an optically thin atmosphere, this retrieval vector formulation is, to first order, a measure of the aerosol scattering signal only, without a contribution from Rayleigh scattering. This is not strictly true due to the contribution from multiple scattering; however, now the multiplicative update factor for the retrieval iterations is much closer to a one-to-one relationship with the aerosol content, i.e. now a modelled retrieval vector 5
that has half the value of the measurement at a given tangent altitude corresponds to a required increase in the aerosol extinction by approximately a factor of two.
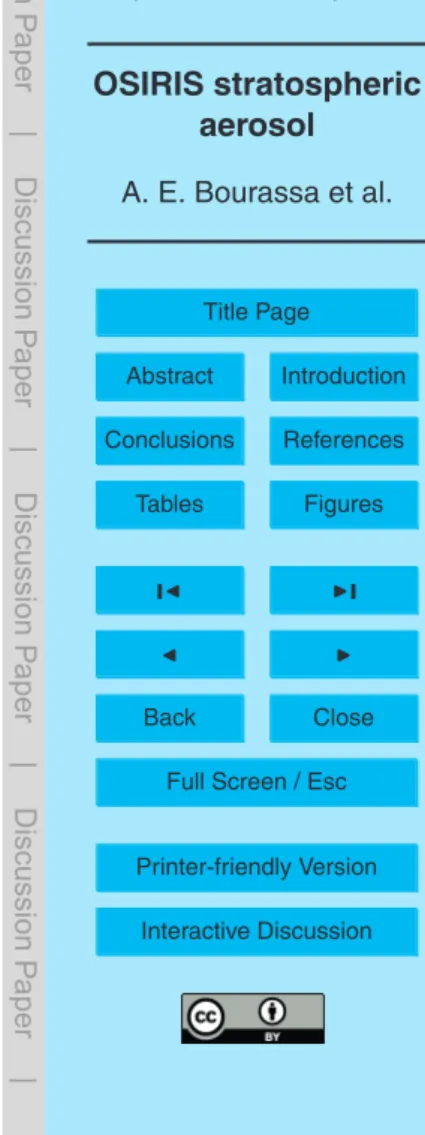
The averaging kernel matrix corresponding to each of these two different retrieval vectors is shown in Fig. 2. These are calculated numerically by perturbation of a typ-ical aerosol extinction profile at each altitude and successive retrieval using simulated 10
radiances for each state. The radiances are simulated with 1 km tangent altitude spac-ing and the resolution is calculated as the full-width half-maximum of each curve. The peaks of the averaging kernel that correspond to the modified retrieval vector, which is shown in the right panel, are close to unity down to 10 km and the resolution is essen-tially equal to the line-of-sight sampling at all altitudes. This is a significant improve-15
ment over the previous method, which is shown in the left panel, where the resolution is degraded below 20 km and above 32 km altitude.
2.3 Retrieval vector normalization
The motivation for the upper tangent altitude normalization of limb scattered radiances is typically twofold: it decreases the sensitivity of the retrieval vector to the effective 20
albedo, and it removes the requirement for an absolute calibration of the measure-ments. The modelled and measured states can then be compared directly in the in-version. However, the signal to noise ratio is falling at high tangent altitude and the standard normalization technique, which uses a single measurement from this range, is susceptible to noise. It is advantageous to consider, then, using multiple measure-25
ACPD
11, 25785–25811, 2011OSIRIS stratospheric aerosol
A. E. Bourassa et al.
Title Page
Abstract Introduction
Conclusions References
Tables Figures
◭ ◮
◭ ◮
Back Close
Full Screen / Esc
Printer-friendly Version Interactive Discussion
Discussion
P
a
per
|
Dis
cussion
P
a
per
|
Discussion
P
a
per
|
Discussio
n
P
a
per
|
of the retrieval vector itself to calculate an offset, which then functions in the same way as the normalization but allows for the incorporation of multiple measurements in an unbiased way.
Due to the logarithm, a simple normalization of the radiances can be considered a systematic offset of the retrieval vector, i.e. the logarithm of a ratio can be written as the 5
difference of the logarithm of each term. This offset is constant with tangent altitude and results in a value of identically ln(1)=0 at the normalization tangent altitude. Following this logic, a normalized retrieval vector is written as,
yj k=ln
I(j,λ
2)
I(j,λ1)
−ln
IRay(j,λ2)
IRay(j,λ1) !
−δ, (4)
where the offset term,δ, is the value ofyj k at the normalization tangent altitude. We 10
take this one step further and use several measurements in the calculation ofδin order to improve the signal-to-noise,
δ= 1 N
m+N
X
j=m
ln
I(j,λ
2)
I(j,λ1)
−ln
IRay(j,λ2)
IRay(j,λ1) ! !
. (5)
Thus δ is the average value taken over the range of N lines-of-sight beginning with
tangent altitudej=m. The average value of the retrieval vector itself over this range 15
becomes zero. The retrieval vector calculated using this method is shown in the right panel of Fig. 1 where the two lines-of-sight between 34 and 38 km are used to compute the offset. The curves shown correspond to calculations performed using Eqs. (3) and (4).
The Version 5 retrieval algorithm determines the range over which to determine the 20
offset, δ, based on the measurements on a scan by scan basis. The minimum value
ACPD
11, 25785–25811, 2011OSIRIS stratospheric aerosol
A. E. Bourassa et al.
Title Page
Abstract Introduction
Conclusions References
Tables Figures
◭ ◮
◭ ◮
Back Close
Full Screen / Esc
Printer-friendly Version Interactive Discussion
Discussion
P
a
per
|
Dis
cussion
P
a
per
|
Discussion
P
a
per
|
Discussio
n
P
a
per
|
measurements, such that any signal greater than the expected instrument noise level is considered either stray light or aerosol scattering and not used in the averaging. In practice, the range of tangent altitudes used to determine the offset is typically between 35 and 40 km in the tropics. At mid to high latitude, the normalization range usually extends lower to approximately 27–30 km and can include measurements up to 40 km. 5
The lower level of the offset range is higher in the tropics because the aerosol load of the tropical stratosphere typically extends to around 35 km. Thus the range of tangent altitudes that can be used at mid and high latitude is larger due to the fact that the instrumental stray light, which is the limiting factor for the upper level of the range, generally does not become significant until approximately 40 km.
10
2.4 Coupled albedo retrieval
The albedo of the surface is one of the most important forward model parameters in terms of uncertainty in the retrieved aerosol extinction (Bourassa et al., 2007). In the original algorithm, the effective Lambertian surface albedo is first retrieved at 750 nm by matching the measured and modelled radiance, in an absolute sense, for the line-of-15
sight nearest to 40 km tangent altitude. This point was chosen for essentially the same reasons as the normalization point for the measurement vector: it is above the majority of the signal from the aerosol layer and below the altitude where stray light becomes significant. Through a forward model study, Bourassa et al. (2007) determined that the uncertainty in the aerosol retrieval due to albedo is then limited to approximately 20
10 % for OSIRIS measurements. However, we have discovered an important coupling between the stratospheric aerosol load and the albedo retrieved using the 40 km ra-diance. Even though the albedo retrieval is performed at tangent altitudes above the stratospheric aerosol layer, it is sensitive to the aerosol load. This can be explained through the strong forward scattering characteristic of the aerosol that will tend to am-25
pro-ACPD
11, 25785–25811, 2011OSIRIS stratospheric aerosol
A. E. Bourassa et al.
Title Page
Abstract Introduction
Conclusions References
Tables Figures
◭ ◮
◭ ◮
Back Close
Full Screen / Esc
Printer-friendly Version Interactive Discussion
Discussion
P
a
per
|
Dis
cussion
P
a
per
|
Discussion
P
a
per
|
Discussio
n
P
a
per
|
file, and then successively re-retrieve the albedo and the aerosol profile. The second retrieval of the albedo can differ from the first estimate by up to approximately 20 % and this will typically reflect a change of approximately 10 % in the retrieved aerosol extinction profile. Two iterations of this process are often sufficient, and the change in the albedo upon a third retrieval is typically less than 1 %.
5
2.5 The initial estimate
The aerosol Jacobian, or so-called weighting functions, are positive for limb scattering at mid-visible and near infrared wavelengths throughout most stratospheric lines-of-sight. That is, an increase in aerosol extinction, which translates into more scattering along the line of sight, results in an increase in the retrieval vector. However, at a 10
certain tangent altitude, typically for lines of sight in the upper troposphere or lower stratosphere, the Jacobian becomes negative such that an increase in aerosol extinc-tion results in a decrease in the retrieval vector. In this case, the effect of extinction is greater than the effect of increased scattering along the line of sight. The point where the Jacobian becomes negative is related to the total optical depth and as such, it in-15
creases in tangent altitude as the aerosol optical depth increases. This characteristic is problematic for the inversion algorithm due to the positivity constraint and the retrieval cannot take place below this point. The approach taken by Bourassa et al. (2007) and by others such as Rault and Loughman (2007), has been to use an a priori aerosol profile that represents the best knowledge of the true state and from that determine the 20
retrieval range on the constraint of positive Jacobian values.
We have found that a more robust strategy is to use extremely low values for the initial guess aerosol extinction profile. In this case, for the first iteration, the Jacobian is positive for all of-sight down to the tropopause such that all stratospheric lines-of-sight are included in the retrieval range. After each iteration, the Jacobian can be 25
ACPD
11, 25785–25811, 2011OSIRIS stratospheric aerosol
A. E. Bourassa et al.
Title Page
Abstract Introduction
Conclusions References
Tables Figures
◭ ◮
◭ ◮
Back Close
Full Screen / Esc
Printer-friendly Version Interactive Discussion
Discussion
P
a
per
|
Dis
cussion
P
a
per
|
Discussion
P
a
per
|
Discussio
n
P
a
per
|
necessary and for the Version 5 retrievals, we have used an extinction threshold that approximately represents the negative condition. The Jacobian is calculated after the final iteration in order to report the final retrieval range. With the new formulation of the retrieval vector detailed above, the inversion converges in only a few iterations, even with a very low value for the initial guess profile.
5
3 SAGE III/OSIRIS intercomparison
The validation of stratospheric aerosol measurements is difficult due to the large num-ber of variables involved and the inherent differences in remote sensing techniques (see for example Thomason et al., 2010; Vanhellemont et al., 2010). The Assessment of Stratospheric Aerosol Properties document (SPARC, 2006) discusses the difficulty 10
in converting lidar backscatter and optical particle counter measurements to reliable extinction values, particularly during the historically low levels of stratospheric aerosol loading which have been typical of the past decade. Although Thomason et al. (2010) state that there is no standard measurement with which to compare, the SAGE series of occultation measurements have been extensively evaluated and compared with other 15
space based instruments and have been found to have relatively high precision and ac-curacy. These likely represent the best possible measurement with which to compare the OSIRIS results. We have chosen the SAGE III mission in particular as it has essen-tially four years of overlap with the OSIRIS mission and an aerosol extinction coefficient data product at 755 nm, which is a very close match to the OSIRIS retrieval at 750 nm. 20
For the northern hemisphere the overlap period begins with the start of the SAGE III measurements in February 2002 and ends in 2005 when OSIRIS loses coverage of high latitudes in the northern hemisphere; the SAGE III mission terminated in March 2006, just as OSIRIS was beginning to regain coverage of the high latitudes. Version 4 of the SAGE III data products have been publicly available since 2008. The Version 4 25
ACPD
11, 25785–25811, 2011OSIRIS stratospheric aerosol
A. E. Bourassa et al.
Title Page
Abstract Introduction
Conclusions References
Tables Figures
◭ ◮
◭ ◮
Back Close
Full Screen / Esc
Printer-friendly Version Interactive Discussion
Discussion
P
a
per
|
Dis
cussion
P
a
per
|
Discussion
P
a
per
|
Discussio
n
P
a
per
|
of 10 % throughout the lower stratosphere. We have compared SAGE III 755 nm and OSIRIS 750 nm aerosol extinction coefficient retrievals directly without any attempt to compensate for the difference in wavelength. For stratospheric aerosol particle sizes, the angstrom coefficient generally ranges between 0 and 2, such that in the worst case the systematic difference in wavelength would affect the comparison by less than 2 %. 5
3.1 Coincidence statistics
The coincidence criteria that we have chosen is quite tight; the reference tangent points of the OSIRIS and SAGE III measurements are within±6 h,±1◦latitude, and±2.5◦ lon-gitude. These are considerably tighter than those typically used for occultation com-parisons; for example Thomason et al. (2010) and Randall et al. (2001) use a criteria 10
of±1 day, ±24◦ longitude, and ±5 % of the potential vorticity (PV) range of the mea-surements spanning the Northern Hemisphere. The 5 % PV criteria is approximately equivalent to ±2◦ latitude; however it is used as it is often a better indication of the dynamical characteristics of the sampled volume. This is particularly true for measure-ments near the polar vortex edge in the winter. Because of the relatively large number 15
of OSIRIS measurements at high latitude we have simply chosen a tight latitude criteria
of±1◦ to define a coincident measurement, and because OSIRIS is not able to make
measurements during winter when the PV criteria would be most important we believe that this criteria is sufficient. Over the course of the entire overlap period this provides 479 coincident measurements of the aerosol extinction profile. None of the measure-20
ments that are included within this criteria are rejected in the following analysis. Figure 3 shows a sample of four of these coincident measurements. These are a representative sample and the level of agreement shown in these four profiles is typical. In many cases the aerosol extinction coefficient profile is quite variable and shows multiple layers and small scale structure throughout the altitude range covering 25
ACPD
11, 25785–25811, 2011OSIRIS stratospheric aerosol
A. E. Bourassa et al.
Title Page
Abstract Introduction
Conclusions References
Tables Figures
◭ ◮
◭ ◮
Back Close
Full Screen / Esc
Printer-friendly Version Interactive Discussion
Discussion
P
a
per
|
Dis
cussion
P
a
per
|
Discussion
P
a
per
|
Discussio
n
P
a
per
|
resolution is approximately 2 km due, which is lower than the 0.5 km resolution of the SAGE III measurements. This is evident in Fig. 3 where some of the finer structure that appears in the SAGE III measurement is not captured in the OSIRIS retrieval.
Statistical results for the comparison of all of the SAGE III and OSIRIS coincidences are shown in Figs. 4 and 5. In Fig. 4, the coincidences are separated by year and 5
the percent difference in extinction coefficient at each altitude reported for the OSIRIS retrieval is calculated according to the OSIRIS measurement minus the SAGE III mea-surement expressed as a percentage of the average of the two meamea-surements. For all years, the general agreement is quite good with the average of the percent diff er-ence essentially less than 10 % from 15 to 25 km with little to no consistent altitude 10
trend from year to year. In 2005 there is a small positive bias of around 10 % that is basically constant with altitude up to 25 km altitude. Above 25 km, the differences in-crease somewhat, in part due to the very small values of absolute extinction at these altitudes. The standard deviation of the percent differences is also shown in Fig. 4; these are approximately 30 % throughout the bulk of the layer and show the usual in-15
crease toward higher altitude where the aerosol extinction coefficient levels are falling and measurement error is increasing. This level of agreement is very similar to that found by Thomason et al. (2010) in the comparison of SAGE III and Polar Ozone and Aerosol Measurements (POAM) III observations. For details on POAM III see Randall et al. (2001).
20
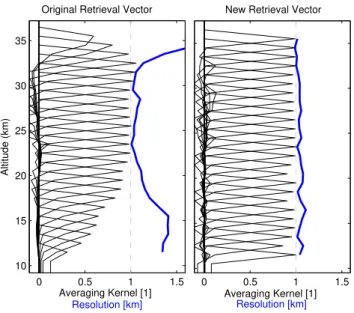
Complementary results from the comparison are presented in Fig. 5 and show a similar picture. Here the coincident SAGE III measurements are plotted as function of the OSIRIS measurement at four altitude levels throughout the lower stratosphere. These are again separated by year and the mean and standard deviation statistics reported on each panel are calculated following Thomason et al. (2010) according to 25
the ratio,
r= kOSIRIS(λ)
ACPD
11, 25785–25811, 2011OSIRIS stratospheric aerosol
A. E. Bourassa et al.
Title Page
Abstract Introduction
Conclusions References
Tables Figures
◭ ◮
◭ ◮
Back Close
Full Screen / Esc
Printer-friendly Version Interactive Discussion
Discussion
P
a
per
|
Dis
cussion
P
a
per
|
Discussion
P
a
per
|
Discussio
n
P
a
per
|
wherek is the aerosol extinction coefficient. This is done in order to include all points in the profile within the same statistical set without biasing the result toward the larger values of extinction typically found at lower altitude. Again, this correlation analysis shows excellent agreement between the two instruments; for years 2002, 2003 and 2004, the mean value shows agreement to less than 10 %. The positive bias in 2005 5
is again evident with a mean value of approximately 1.2.
3.2 Zonal average time series
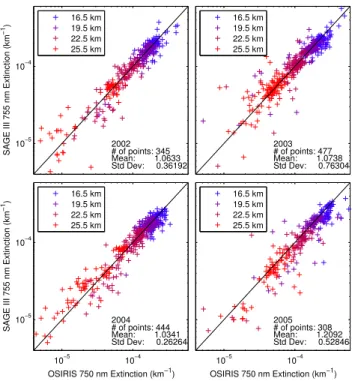
As a further indication of the level of agreement between OSIRIS and SAGE III we have compared the zonal average time series. Figure 6 shows the daily average 755 nm extinction ratio profile measured by SAGE III throughout 2002–2005 in the northern 10
hemisphere. The extinction ratio is the ratio of the aerosol extinction coefficient to the molecular extinction at the same wavelength, i.e. the product of the air density and the Rayleigh cross section. The SAGE III measurements are at essentially the same latitude over the course of a day so we have determined the daily average OSIRIS extinction ratio profile for all OSIRIS measurements within 5◦of latitude of the SAGE III 15
measurement. This is also shown in Fig. 6. The average OSIRIS profile is usually composed of between 16 and 32 profiles depending on whether or not the tangent point is illuminated on both the ascending and descending tracks of the Odin orbit. For both instruments, the daily profile is only shown when both instruments are able to make a measurement. The latitude of the SAGE III measurement and the solar zenith 20
angle of the OSIRIS retrievals is also provided for reference.
The time series measured by the two instruments are extremely similar; the Junge layer is clearly visible in each year with the peak between approximately 18 and 21 km. The systematic rising and falling is driven essentially by the shifting latitude of the mea-surement toward lower latitudes in the summer. In both cases the aerosol levels are 25
ab-ACPD
11, 25785–25811, 2011OSIRIS stratospheric aerosol
A. E. Bourassa et al.
Title Page
Abstract Introduction
Conclusions References
Tables Figures
◭ ◮
◭ ◮
Back Close
Full Screen / Esc
Printer-friendly Version Interactive Discussion
Discussion
P
a
per
|
Dis
cussion
P
a
per
|
Discussion
P
a
per
|
Discussio
n
P
a
per
|
solute value of the percent difference between the daily average profile of extinction ratio. Again, the result is similar with percent differences of less than approximately 10 % throughout the bulk of the stratospheric layer and with larger differences above and below. The large values of extinction ratio that occur at low altitude, particularly in the summer as the measurements progress toward lower latitude, are associated with 5
aerosol and cloud near and below the tropopause. Although both instruments mea-sure much larger values at these low altitudes, the microphysical assumptions about the aerosol composition required for the OSIRIS retrievals break down and it is not expected that the OSIRIS results are trustworthy.
The assumptions of a typical background (non-volcanic) aerosol particle size distri-10
bution may also explain the bias in the OSIRIS results in 2005 after the eruption of Mt. Manam. The SAGE III mission occurred when aerosol levels were at historically low levels with relatively little volcanic perturbation over the four years. This, and the fact that no measurements were made at tropical latitudes makes this study incomplete in terms of a full validation of the OSIRIS aerosol retrievals; however, it does show that 15
for the conditions that we were able to study, the OSIRIS results are of scientific appli-cability with an accuracy of about 10 %, which is on the same order as the occultation measurements over the same time period.
4 The OSIRIS version 5 aerosol extinction data set
One of the biggest strengths of the OSIRIS aerosol extinction coefficient data product 20
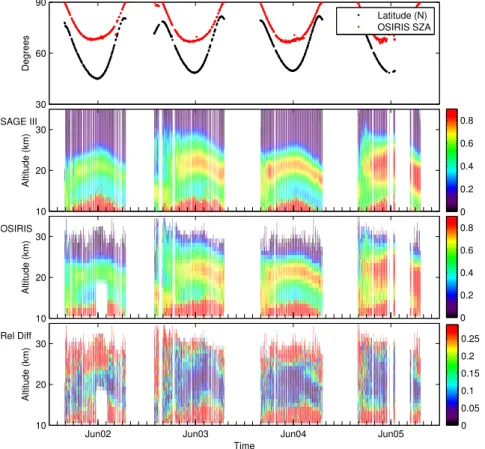
is the relatively good global coverage obtained with the limb scatter technique. To demonstrate this and further show some features of the data set, we have included in Fig. 7 plots of the daily zonal average extinction ratio in four latitude bands throughout the same 2002–2005 time period shown in Fig. 6. These latitude bands, from the top panel to the bottom panel, are 55–65◦N, 15–25◦N, 15–25◦S, and 55–65◦S. The highly 25
ACPD
11, 25785–25811, 2011OSIRIS stratospheric aerosol
A. E. Bourassa et al.
Title Page
Abstract Introduction
Conclusions References
Tables Figures
◭ ◮
◭ ◮
Back Close
Full Screen / Esc
Printer-friendly Version Interactive Discussion
Discussion
P
a
per
|
Dis
cussion
P
a
per
|
Discussion
P
a
per
|
Discussio
n
P
a
per
|
extinction from volcanic eruptions are evident in the tropical time series. The effect of Mt. Manam is first seen in the 15–25◦S time series in January 2005. The enhancement rises slowly and becomes indistinguishable from the bulk layer toward the end of the year. A similar effect is seen in the 15–25◦N time series. A smaller plume is also observed in 2002–2003 from the eruptions of Ruang (2◦N, 125◦E) in September, 2002, 5
and Reventador (0◦S, 77◦W) in November, 2002 (Thomason et al., 2008; Vernier et al., 2011). An additional small plume from an unidentified eruption, which begins at quite high altitude compared to the others, is also observed in the latter half of 2003.
5 Conclusions
The OSIRIS Version 5 data product, which is now publicly available for the entire Odin 10
mission (see odin-osiris.usask.ca) includes retrievals of vertical profiles of the strato-spheric aerosol extinction coefficient at 750 nm. The retrieval algorithm is based on the work of Bourassa et al. (2007) and is further improved as detailed here. These im-provements include the modified retrieval vector formulation with better sensitivity and a normalization technique that incorporates multiple high altitude radiance measure-15
ments to minimize the impact of measurement noise. Additionally, a coupled retrieval of the effective scene albedo and the aerosol extinction profile has been found to im-prove the results at the 10 % level.
Comparisons of coincident measurements made by SAGE III at 755 nm between 2002 and 2005 show excellent agreement to within approximately 10 % over the bulk 20
of the stratospheric layer from about 15 to 25 km. This is essentially at the level of precision and accuracy expected from the SAGE III data, as reported by Thomason et al. (2010). We do not recommend the use of this data product at altitudes below the tropopause, where cloud scattering will tend to bias the retrieved result due to the same issue of incorrect forward modelling with the assumed particle size, shape and 25
ACPD
11, 25785–25811, 2011OSIRIS stratospheric aerosol
A. E. Bourassa et al.
Title Page
Abstract Introduction
Conclusions References
Tables Figures
◭ ◮
◭ ◮
Back Close
Full Screen / Esc
Printer-friendly Version Interactive Discussion
Discussion
P
a
per
|
Dis
cussion
P
a
per
|
Discussion
P
a
per
|
Discussio
n
P
a
per
|
error arising from volcanic aerosol from the eruption of Mt. Manam affecting the particle size distribution. The SAGE III intercomparison does not provide any indication of the fidelity of the OSIRIS retrievals in the tropics, or for the time period after 2005, where in both cases any systematic error that arises from the influence of volcanic eruptions is likely to be more significant; however, it does show that the limb scatter retrievals 5
are of good quality with scientific applicability throughout the bulk of the stratospheric aerosol layer with an accuracy of about 10 %.
Acknowledgements. This work was supported by the Natural Sciences and Engineering Re-search Council (Canada) and the Canadian Space Agency. Odin is a Swedish-led satellite project funded jointly by Sweden (SNSB), Canada (CSA), France (CNES) and Finland (Tekes).
10
The SAGE III data were obtained from the NASA Langley Research Center EOSDIS Distributed Active Archive Center.
References
Bertaux, J. L., Kyrl, E., Fussen, D., Hauchecorne, A., Dalaudier, F., Sofieva, V., Tamminen, J., Vanhellemont, F., Fanton d’Andon, O., Barrot, G., Mangin, A., Blanot, L., Lebrun, J. C., Prot,
15
K., Fehr, T., Saavedra, L., Leppelmeier, G. W., and Fraisse, R.: Global ozone monitoring by occultation of stars: an overview of GOMOS measurements on ENVISAT, Atmos. Chem. Phys., 10, 12091–12148, doi:10.5194/acp-10-12091-2010, 2010 25787
Bourassa, A. E., Degenstein, D. A., Gattinger, R. L., and Llewellyn, E. J.: Stratospheric aerosol retrieval with OSIRIS limb scatter measurements, J. Geophys. Res., 112, D10217,
20
doi:10.1029/2006JD008079, 2007. 25787, 25788, 25789, 25790, 25791, 25794, 25795 Bourassa, A. E., Degenstein, D. A., and Llewellyn, E. J.: SASKTRAN: A spherical geometry
radiative transfer code for efficient estimation of limb scattered sunlight, J. Quant. Spectros. Radiat. Trans., 109, 52–73, 2008a. 25788
Bourassa, A. E., Degenstein, D. A., and Llewellyn, E. J.: Retrieval of stratospheric aerosol
25
size information from OSIRIS limb scattered sunlight spectra, Atmos. Chem. Phys., 8, 6375– 6380, doi:10.5194/acp-8-6375-2008, 2008b. 25787
ACPD
11, 25785–25811, 2011OSIRIS stratospheric aerosol
A. E. Bourassa et al.
Title Page
Abstract Introduction
Conclusions References
Tables Figures
◭ ◮
◭ ◮
Back Close
Full Screen / Esc
Printer-friendly Version Interactive Discussion
Discussion
P
a
per
|
Dis
cussion
P
a
per
|
Discussion
P
a
per
|
Discussio
n
P
a
per
|
D. A.: Fast NO2 retrievals from Odin-OSIRIS limb scatter measurements, Atmos. Meas. Tech., 4, 965–972, doi:10.5194/amt-4-965-2011, 2011. 25788, 25790
Bovensmann, H., Burrows, J. P., Buchwitz, M., Frerick, J., No ¨el, S., Rozanov, V. V., Chance, K. V., and Goede, A. P. H.: SCIAMACHY: Mission Objectives and Measurement Modes, J. Atmos. Sci., 56, 127–150, 1999. 25787
5
Degenstein, D. A., Llewellyn, E. J., and Lloyd, N. D.: Tomographic retrieval of the oxygen infrared atmospheric band with the OSIRIS infrared imager, Can. J. Phys., 82, 501–515, 2004. 25790
Degenstein, D. A., Bourassa, A. E., Roth, C. Z., and Llewellyn, E. J.: Limb scatter ozone retrieval from 10 to 60 km using a multiplicative algebraic reconstruction technique, Atmos.
10
Chem. Phys., 9, 6521–6529, doi:10.5194/acp-9-6521-2009, 2009. 25788, 25790
Deshler, T., Hervig, M. E., Hofmann, D. J., Rosen, J. M., and Liley, J. B.: Thirty years of in-situ stratospheric aerosol size distribution measurements from Laramie, Wyoming (41 N), using balloon-borne instruments, J. Geophys. Res., 108, 1–13, doi:10.1029/2002JD002514, 2003. 25790
15
Llewellyn, E. J., Lloyd, N. D., Degenstein, D. A., Gattinger, R. L., Petelina, S. V., Bourassa, A. E., Wiensz, J. T., Ivanov, E. V., McDade, I. C., Solheim, B. H., McConnell, J. C., Haley, C. S., von Savigny, C., Sioris, C. E., McLinden, C. A., Griffioen, E., Kaminski, J., Evans, W. F., Puckrin, E., Strong, K., Wehrle, V., Hum, R. H., Kendall, D. J. W., Matsushita, J., Murtagh, D. P., Brohede, S., Stegman, J., Witt, G., Barnes, G., Payne, W. F., Pich ´e, L., Smith, K., Warshaw,
20
G., Deslauniers, D.-L., Marchand, P., Richardson, E. H., King, R. A., Wevers, I., McCreath, W., Kyr ¨ol ¨a, E., Oikarinen, L., Leppelmeier, G. W., Auvinen, H., M ´egie, G., Hauchecorne, A., Lef `evre, F., de La N ¨oe, J., Ricaud, P., Frisk, U., Sjoberg, F., von Sch ´eele, F., and Nordh, L.: The OSIRIS instrument on the Odin spacecraft, Can. J. Phys., 82, 411–422, 2004. 25788 Murtagh, D., Frisk, U., Merino, F., Ridal, M., Jonsson, A., Stegman, J., Witt, G., Eriksson, P.,
25
Jim ´enez, C., Megie, G., de La No ¨e, J., Ricaud, P., Baron, P., Pardo, J. R., Hauchcorne, A., Llewellyn, E. J., Degenstein, D. A., Gattinger, R. L., Lloyd, N. D., Evans, W. F. J., McDade, I. C., Haley, C. S., Sioris, C., von Savigny, C., Solheim, B. H., McConnell, J. C., Strong, K., Richardson, E. H., Leppelmeier, G. W., Kyr ¨ol ¨a, E., Auvinen, H., and Oikarinen, L.: Review: An overview of the Odin atmospheric mission, Can. J. Phys., 80, 309–319, 2002. 25788
30
ACPD
11, 25785–25811, 2011OSIRIS stratospheric aerosol
A. E. Bourassa et al.
Title Page
Abstract Introduction
Conclusions References
Tables Figures
◭ ◮
◭ ◮
Back Close
Full Screen / Esc
Printer-friendly Version Interactive Discussion
Discussion
P
a
per
|
Dis
cussion
P
a
per
|
Discussion
P
a
per
|
Discussio
n
P
a
per
|
Rault, D. and Loughman, R.: Stratospheric and upper tropospheric aerosol retrieval from limb scatter signals, Proc. SPIE, 6745, doi:10.1117/12.737325, 2007. 25787, 25795
Rault, D. F.: Ozone profile retrieval from Stratospheric Aerosol and Gas Experiment (SAGE III) limb scatter measurements, J. Geophys. Res., 110, doi:10.1029/2004JD004970, 2005. 25787
5
SPARC: Assessment of Stratospheric Aerosol Properties (ASAP), SPARC Report No. 4, WCRP-124, WMO/TD-No. 1295, February 2006, edited by: Thomason, L. and Peter, Th., 2006.
Thomason, L. W., Burton, S. P., Luo, B.-P., and Peter, T.: SAGE II measurements of stratospheric aerosol properties at non-volcanic levels, Atmos. Chem. Phys., 8, 983–995,
10
doi:10.5194/acp-8-983-2008, 2008. 25801
Thomason, L. W., Moore, J. R., Pitts, M. C., Zawodny, J. M., and Chiou, E. W.: An evaluation of the SAGE˜III version 4 aerosol extinction coefficient and water vapor data products, Atmos. Chem. Phys., 10, 2159–2173, doi:10.5194/acp-10-2159-2010, 2010. 25796, 25797
Tukiainen, S., Hassinen, S., Seppala, A., Auvinen, H., Kyrola, E., Tamminen, J., Haley, C.,
15
Lloyd, N., and Verronen, P.: Description and validation of a limb scatter retrieval method for Odin/OSIRIS, J. Geophys. Res., 113, D04308, doi:10.1029/2007JD008591, 2008. 25787 Vanhellemont, F., Fussen, D., Mateshvili, N., T ´etard, C., Bingen, C., Dekemper, E., Loodts,
N., Kyr ¨ol ¨a, E., Sofieva, V., Tamminen, J., Hauchecorne, A., Bertaux, J.-L., Dalaudier, F., Blanot, L., Fanton D’Andon, O., Barrot, G., Guirlet, M., Fehr, T., and Saavedra, L.: Optical
20
extinction by upper tropospheric/stratospheric aerosols and clouds: GOMOS observations for the period 2002-2008, Atmos. Chem. Phys., 10, 7997–8009, doi:10.5194/acp-10-7997-2010, 2010. 25796, 25799
Vernier, J., Thomason, L., Pommereau, J.-P., Bourassa, A., Pelon, J., Garnier, A., Hauchecorne, A., Blanot, L., Trepte, C., Degenstein, D., , and Vargas, F.: Major influence
25
ACPD
11, 25785–25811, 2011OSIRIS stratospheric aerosol
A. E. Bourassa et al.
Title Page
Abstract Introduction
Conclusions References
Tables Figures
◭ ◮
◭ ◮
Back Close
Full Screen / Esc
Printer-friendly Version Interactive Discussion
Discussion
P
a
per
|
Dis
cussion
P
a
per
|
Discussion
P
a
per
|
Discussio
n
P
a
per
|
0 0.5 1 1.5
10 15 20 25 30 35 40 45
y (original)
Tangent Altitude (km)
0 0.2 0.4 0.6 0.8
10 15 20 25 30 35 40 45
y (modified) OSIRIS scan
Rayleigh Model
Pre−norm Post−norm
Normalization Range
ACPD
11, 25785–25811, 2011OSIRIS stratospheric aerosol
A. E. Bourassa et al.
Title Page
Abstract Introduction
Conclusions References
Tables Figures
◭ ◮
◭ ◮
Back Close
Full Screen / Esc
Printer-friendly Version Interactive Discussion
Discussion
P
a
per
|
Dis
cussion
P
a
per
|
Discussion
P
a
per
|
Discussio
n
P
a
per
|
0 0.5 1 1.5
10 15 20 25 30 35
Original Retrieval Vector
Averaging Kernel [1]
Altitude (km)
0 0.5 1 1.5
New Retrieval Vector
Averaging Kernel [1] Resolution [km] Resolution [km]
ACPD
11, 25785–25811, 2011OSIRIS stratospheric aerosol
A. E. Bourassa et al.
Title Page
Abstract Introduction
Conclusions References
Tables Figures
◭ ◮
◭ ◮
Back Close
Full Screen / Esc
Printer-friendly Version Interactive Discussion
Discussion
P
a
per
|
Dis
cussion
P
a
per
|
Discussion
P
a
per
|
Discussio
n
P
a
per
|
0 1 2 3 4 5
x 10−4 10
15 20 25 30 35
750 nm Extinction (km−1)
Altitude (km)
0 1 2 3 4 5
x 10−4 750 nm Extinction (km−1) 10
15 20 25 30 35
Altitude (km)
OSIRIS Lat: 75.8 Lon: −30.9
∆t = 1.7h
SAGE III Lat: 75.5 Lon: −28.7 ∆t = 1.7h
SAGE III Lat: −37.9 Lon: −120.5 ∆t = 0.7h
OSIRIS Lat: −38.4 Lon: −120.6
∆t = 0.7h
SAGE III Lat: −49.6 Lon: −147.4 ∆t = 0.3h
OSIRIS Lat: −50.3 Lon: −145.9
∆t = 0.3h
SAGE III Lat: −38.5 Lon: −42.3 ∆t = 0.8h
OSIRIS Lat: −39.3 Lon: −41.0
∆t = 0.8h
ACPD
11, 25785–25811, 2011OSIRIS stratospheric aerosol
A. E. Bourassa et al.
Title Page
Abstract Introduction
Conclusions References
Tables Figures
◭ ◮
◭ ◮
Back Close
Full Screen / Esc
Printer-friendly Version Interactive Discussion
Discussion
P
a
per
|
Dis
cussion
P
a
per
|
Discussion
P
a
per
|
Discussio
n
P
a
per
|
14 16 18 20 22 24 26 28 30
2002 117 Coincidences
Altitude (km)
2003 134 Coincidences
−100 −50 0 50 100
14 16 18 20 22 24 26 28 30
2004 137 Coincidences
Altitude (km)
Percent Difference
−100 −50 0 50 100
2005 91 Coincidences
Percent Difference
ACPD
11, 25785–25811, 2011OSIRIS stratospheric aerosol
A. E. Bourassa et al.
Title Page
Abstract Introduction
Conclusions References
Tables Figures
◭ ◮
◭ ◮
Back Close
Full Screen / Esc
Printer-friendly Version Interactive Discussion
Discussion
P
a
per
|
Dis
cussion
P
a
per
|
Discussion
P
a
per
|
Discussio
n
P
a
per
|
10−5 10−4
SAGE III 755 nm Extinction (km
−1
)
2002 # of points: 345 Mean: 1.0633 Std Dev: 0.36192
2003 # of points: 477 Mean: 1.0738 Std Dev: 0.76304
10−5 10−4
10−5 10−4
OSIRIS 750 nm Extinction (km−1)
SAGE III 755 nm Extinction (km
−1
)
2004 # of points: 444 Mean: 1.0341 Std Dev: 0.26264
10−5 10−4
OSIRIS 750 nm Extinction (km−1) 2005 # of points: 308 Mean: 1.2092 Std Dev: 0.52846 16.5 km
19.5 km 22.5 km 25.5 km
16.5 km 19.5 km 22.5 km 25.5 km
16.5 km 19.5 km 22.5 km 25.5 km
16.5 km 19.5 km 22.5 km 25.5 km
ACPD
11, 25785–25811, 2011OSIRIS stratospheric aerosol
A. E. Bourassa et al.
Title Page
Abstract Introduction
Conclusions References
Tables Figures
◭ ◮
◭ ◮
Back Close
Full Screen / Esc
Printer-friendly Version Interactive Discussion
Discussion
P
a
per
|
Dis
cussion
P
a
per
|
Discussion
P
a
per
|
Discussio
n
P
a
per
|
30 60 90
Degrees
10 20 30
Altitude (km)
SAGE III
10 20 30
Altitude (km)
OSIRIS
Jun02 Jun03 Jun04 Jun05
10 20 30
Time
Altitude (km)
Rel Diff
Latitude (N) OSIRIS SZA
0 0.2 0.4 0.6 0.8
0 0.2 0.4 0.6 0.8
0 0.05 0.1 0.15 0.2 0.25
ACPD
11, 25785–25811, 2011OSIRIS stratospheric aerosol
A. E. Bourassa et al.
Title Page
Abstract Introduction
Conclusions References
Tables Figures
◭ ◮
◭ ◮
Back Close
Full Screen / Esc
Printer-friendly Version Interactive Discussion
Discussion
P
a
per
|
Dis
cussion
P
a
per
|
Discussion
P
a
per
|
Discussio
n
P
a
per
|
10 20 30
Altitude (km)
55−65 °N
10 20 30
Altitude (km)
15−25 °N
10 20 30
Altitude (km)
15−25 °S
2002.5 2003.5 2004.5 2005.5
10 20 30
Altitude (km)
55−65 °S
0 0.2 0.4 0.6 0.8
0 0.2 0.4 0.6 0.8
0 0.2 0.4 0.6 0.8
0 0.2 0.4 0.6 0.8
Fig. 7. The daily zonal average OSIRIS aerosol extinction ratio for the SAGE III time period for the following latitude bands shown from top to bottom: 55–65◦N, 15–25◦N, 15–25◦S, and