ACPD
9, 11753–11781, 2009Testing aerosol properties in MODIS
Collection 4 and 5
J. Redemann et al.
Title Page
Abstract Introduction
Conclusions References
Tables Figures
◭ ◮
◭ ◮
Back Close
Full Screen / Esc
Printer-friendly Version
Interactive Discussion Atmos. Chem. Phys. Discuss., 9, 11753–11781, 2009
www.atmos-chem-phys-discuss.net/9/11753/2009/ © Author(s) 2009. This work is distributed under the Creative Commons Attribution 3.0 License.
Atmospheric Chemistry and Physics Discussions
This discussion paper is/has been under review for the journalAtmospheric Chemistry and Physics (ACP). Please refer to the corresponding final paper inACPif available.
Testing aerosol properties in MODIS
(MOD04/MYD04) Collection 4 and 5 using
airborne sunphotometer observations in
INTEX-B/MILAGRO
J. Redemann1, Q. Zhang1, J. Livingston2, P. Russell3, Y. Shinozuka4, A. Clarke5, R. Johnson3, and R. Levy6
1
Bay Area Environmental Research Institute, Sonoma, CA, USA
2
SRI International, Menlo Park, CA, USA
3
NASA Ames Research Center, Moffett Field, CA, USA
4
ORAU/ NASA Ames Research Center, Moffett Field, CA, USA
5
University of Hawaii, Honolulu, HI, USA
6
SSAI/NASA Goddard Space Flight Center, Greenbelt, MD, USA
Received: 31 March 2009 – Accepted: 9 April 2009 – Published: 12 May 2009 Correspondence to: J. Redemann ([email protected])
ACPD
9, 11753–11781, 2009Testing aerosol properties in MODIS
Collection 4 and 5
J. Redemann et al.
Title Page
Abstract Introduction
Conclusions References
Tables Figures
◭ ◮
◭ ◮
Back Close
Full Screen / Esc
Printer-friendly Version
Interactive Discussion Abstract
The 14-channel Ames Airborne Tracking Sunphotometer (AATS) was operated on a Jetstream 31 (J31) aircraft in March 2006 during MILAGRO/INTEX-B (Megacity Initiative-Local And Global Research Observations/Phase B of the Intercontinental Chemical Transport Experiment). We compare AATS retrievals of spectral aerosol 5
optical depth (AOD) and related aerosol properties with corresponding spatially co-incident and temporally near-coco-incident measurements acquired by the MODIS-Aqua and MODIS-Terra satellite sensors. These comparisons are carried out for the older MODIS Collection 4 (C4) and the new Collection 5 (C5) data set, the latter represent-ing a reprocessrepresent-ing of the entire MODIS data set completed durrepresent-ing 2006 with updated 10
calibration and aerosol retrieval algorithm. Our analysis yields a direct, validated as-sessment of the differences between select MODIS C4 and C5 aerosol retrievals. Our analyses of 37 coincident observations by AATS and MODIS-Terra and 18 coincident observations between AATS and MODIS-Aqua indicate notable differences between MODIS C4 and C5 and between the two sensors. For MODIS-Terra, we find an av-15
erage increase in AOD of 0.02 at 553 nm and 0.01 or less at the shortwave infrared (SWIR) wavelengths. The change from C4 to C5 results in less good agreement with the AATS derived spectral AOD, with average differences at 553 nm increasing from 0.03 to 0.05. For MODIS-Aqua, we find an average increase in AOD of 0.008 at 553 nm, but an increase of nearly 0.02 at the SWIR wavelengths. The change from C4 to C5 20
results in slightly less good agreement to the AATS derived visible AOD, with average differences at 553 nm increasing from 0.03 to 0.04. However, at SWIR wavelengths, the changes from C4 to C5 result in improved agreement between MODIS-Aqua and AATS, with the average differences at 2119 nm decreasing from−0.02 to−0.003. Com-paring the Angstrom exponents calculated from AOD at 553 nm and 855 nm, we find an 25
ACPD
9, 11753–11781, 2009Testing aerosol properties in MODIS
Collection 4 and 5
J. Redemann et al.
Title Page
Abstract Introduction
Conclusions References
Tables Figures
◭ ◮
◭ ◮
Back Close
Full Screen / Esc
Printer-friendly Version
Interactive Discussion measurements of size-dependent aerosol extinction, we derive a suborbital measure
of the aerosol submicron fraction (SMF) of AOD and compare it to MODIS retrievals of aerosol fine mode fraction (FMF). Our analysis shows a significant rms-difference be-tween the MODIS-Terra FMF and suborbitally-derived SMF of 0.17 for both C4 and C5. For MODIS-Aqua, there is a slight improvement in the transition from C4 to C5, with the 5
rms-difference from AATS dropping from 0.23 to 0.16. The differences in MODIS C4 and C5 AOD in this limited data set can be traced to changes in the reflectances input to the aerosol retrievals. An extension of the C4-C5 comparisons from the area along the J31 flight track to a larger study region between 18–23◦N and 93–100◦W on each of the J31 flight days supports the finding of significant differences between MODIS C4 10
and C5.
1 Introduction
Aerosols are recognized to have a direct, a semi-direct and several indirect effects on climate. The direct effect on climate is through the absorption and scattering of solar radiation (e.g., Kaufman et al., 2002), while the semi-direct (Ackerman et al., 2000) 15
and the indirect effects (e.g., Albrecht, 1989; Rosenfeld, 1999) involve the modification of cloud properties. The uncertainty in estimates of these aerosol forcings depends crucially on the uncertainty of measured and modeled aerosol properties (Schwartz, 2004). The most basic aerosol property that is used to parameterize the direct aerosol radiative forcing of climate is the aerosol optical depth (AOD), defined as the vertical 20
integral of aerosol extinction. Recent studies conducted as part of NASA’s Global Aerosol Climatology Project reveal that the most likely trend in the period of 1991 to 2005 is a decrease in tropospheric AOD of 0.03 (Mishchenko et al., 2007). There is a need to quantify aerosol trends with small enough uncertainty to allow their inclusion in global climate models to evaluate the combined effects of greenhouse-gas induced 25
ACPD
9, 11753–11781, 2009Testing aerosol properties in MODIS
Collection 4 and 5
J. Redemann et al.
Title Page
Abstract Introduction
Conclusions References
Tables Figures
◭ ◮
◭ ◮
Back Close
Full Screen / Esc
Printer-friendly Version
Interactive Discussion major reprocessing of well established satellite data sets.
In this paper, we analyze a set of MODIS aerosol retrievals acquired over the Gulf of Mexico during MILAGRO/INTEX-B (Megacity Initiative-Local And Global Re-search Observations/Phase B of the Intercontinental Chemical Transport Experiment) in March 2006 (Molina et al., 2009). We track changes in aerosol properties during 5
the transition from the MODIS Collection 4 (C4) to the Collection 5 (C5) data sets (http://modis-atmos.gsfc.nasa.gov/products C005update.html) and quantitatively com-pare the MODIS retrievals to measurements made by the 14-channel Ames Airborne Tracking Sunphotometer (AATS), which was operated on a Jetstream 31 (J31) aircraft based in Veracruz, Mexico. AATS measured AOD at 13 wavelengths (354–2139 nm) 10
and columnar water vapor (CWV) in 13 flights that sampled clean and polluted air-masses over the Gulf of Mexico and Mexico City. J31 flights were coordinated with overflights of several satellites, including Aqua, Aura, Terra, and Parasol. A compan-ion paper to this study (Livingston et al., 2009) compares AATS measurements to aerosol retrievals from several algorithms applied to observations by the OMI instru-15
ment aboard the Aqua satellite.
The first objective of this paper is to compare AATS retrievals of spectral AOD over dark ocean waters with corresponding AOD values retrieved from spatially coincident and temporally near-coincident (±30 min of satellite overpass) measurements acquired by MODIS-Aqua and MODIS-Terra, both for Collection 4 and Collection 5. In this pro-20
cess, we compare C4 to C5, and each Collection directly to AATS measurements to assess which Collection showed quantitatively better agreement with AATS. The sec-ond objective is to compare MODIS retrievals of aerosol fine mode fraction (FMF), an indicator of the anthropogenic fraction of aerosols, to the sub-micron fraction of aerosol scattering, which can be calculated using a combination of in situ measure-25
ACPD
9, 11753–11781, 2009Testing aerosol properties in MODIS
Collection 4 and 5
J. Redemann et al.
Title Page
Abstract Introduction
Conclusions References
Tables Figures
◭ ◮
◭ ◮
Back Close
Full Screen / Esc
Printer-friendly Version
Interactive Discussion
2 Measurements
2.1 AATS measurements of spectral aerosol optical depth
The AATS instrument has been described in detail in several previous publications (e.g., Russell et al., 2005, 2007; Livingston et al., 2007; and references therein), so we provide only a brief synopsis here. The instrument measures the atmospheric 5
transmission of the direct solar beam in 14 spectral channels with center wavelengths,
λ, ranging from 354 to 2139 nm and bandwidths of∼5 nm (exceptions are 2.0 nm for the 354-nm channel and 17.3 nm for the 2139-nm channel). Azimuth and elevation motors rotate a tracking head to lock on to the solar beam and maintain detectors normal to it. During MILAGRO/INTEX-B, AATS was mounted on the J31 in the same configuration 10
(Russell et al., 2007) as used during the 2004 INTEX-A/Intercontinental Transport and Chemical Transformation (ITCT) field deployment.
The AATS channel wavelengths have been chosen to permit separation of aerosol, water vapor, and ozone transmission along the AATS-to-Sun slant path. Our methods for data acquisition, reduction, calibration, and error analysis have been documented 15
in the literature (Russell et al., 1993a, b; Schmid and Wehrli, 1995; Schmid et al., 1996, 2001, 2003; Livingston et al., 2005, 2007) and are briefly summarized here. Spectral AOD is calculated from detector voltages measured in 13 channels, with the channels centered at 940 nm and neighboring wavelengths used for calculation of CWV. Calcu-lation of AOD(λ), whereλis the AATS channel center wavelength, and CWV requires 20
knowledge of exoatmospheric detector voltages, V0(λ). These were calculated from
analysis of sunrise measurements acquired at Mauna Loa Observatory (MLO), Hawaii, before (January 2006) and after (May 2006) the MILAGRO deployment and, following the procedure described in Schmid et al. (2003), by analysis of high altitude clear air AOD spectra obtained during the deployment. Specifically, the V0values were derived 25
ACPD
9, 11753–11781, 2009Testing aerosol properties in MODIS
Collection 4 and 5
J. Redemann et al.
Title Page
Abstract Introduction
Conclusions References
Tables Figures
◭ ◮
◭ ◮
Back Close
Full Screen / Esc
Printer-friendly Version
Interactive Discussion for water vapor absorption. Analysis of the high altitude AOD spectra involved
calcu-lating the best-fit second order polynomial of log(AOD(λ)) vs. log(λ) to ensure positive values of AOD(λ) and a “smooth” variation with wavelength. The residuals between the AOD(λ) calculated from the best fit polynomial and the AOD(λ) calculated from the MLO V0values were then used to calculate small correction factors to be applied to the
5
MLO V0values. In fact, the mean V0values derived from the pre- and post-campaign
MLO data sets agreed to better than 0.5% in 10 of the 13 AOD channels, with diff er-ences of 0.86% and 0.76% for the 380-nm and 1558-nm channels, respectively, and a difference of 2.58% for the 778-nm channel. Because of the good agreement between the two MLO data sets for most channels, we decided to apply the results of the high 10
altitude AOD spectral fits to the pre-MILAGRO (January 2006 MLO) values of V0 and use these adjusted values in the analysis of the MILAGRO data. The statistical com-ponent of the uncertainty in V0 was set equal to 50% of the mean difference between
the January and May MLO results.
2.2 MODIS retrievals of aerosol optical depth 15
The MODIS over-ocean algorithm for the retrieval of AOD has been described in detail in Remer et al. (2005). This algorithm aggregates reflectances from the six channels between 553 and 2119 nm into the nominal 10 by 10 km2 retrieval grid boxes each composed of 20 by 20 pixels at 500 m resolution. The algorithm uses the difference in spatial variability of aerosols and clouds to identify the cloud-free pixels that are suitable 20
for subsequent inclusion in the aerosol retrieval (Martins et al., 2002). Specifically, the standard deviation of 553-nm reflectances of a square set of 3 by 3 500-m pixels is compared to a threshold value of 0.0025. By default, all pixels are set to “cloudy”. If the standard deviation of the reflectances in the nine 500-m pixels is smaller than the threshold value, the center pixel is declared “not cloudy” and the set of 3×3 pixels is 25
ACPD
9, 11753–11781, 2009Testing aerosol properties in MODIS
Collection 4 and 5
J. Redemann et al.
Title Page
Abstract Introduction
Conclusions References
Tables Figures
◭ ◮
◭ ◮
Back Close
Full Screen / Esc
Printer-friendly Version
Interactive Discussion for cirrus, which can be spatially homogeneous. The fraction of “cloudy” 500 by 500 m2
pixels within the 10 by 10 km2 pixel is archived in the level-2 data file for each large pixel for which an AOD is retrieved. It may also erroneously identify inhomogeneous aerosol fields as clouds. After the application of various cloud masks and a residual underwater sediment mask (Li et al., 2003), the brightest 25% and darkest 25% (at 5
855 nm) of the remaining pixels are discarded, in principle to remove any other surface inhomogeneities and cloud contamination. The reflectances in the remaining pixels are averaged and compared to a look-up table consisting of simulated reflectances for four fine and five coarse mode aerosol types, for various viewing geometries and aerosol loadings (Remer et al., 2005). All combinations of fine and coarse mode pairs that fit 10
the measured reflectances to within 3% (or the best three combinations if no solution fits the reflectances to within 3%) are averaged to yield the average combination of fine and coarse mode aerosol and the corresponding spectral AOD at 466, 553, 644, 855, 1243, 1632 and 2119 nm.
During 2006, a complete reprocessing of all available MODIS data produced the 15
MODIS Collection 5 (C5) data set. The main differences between the previous Col-lection 4 and the resulting ColCol-lection 5 are described at http://modis-atmos.gsfc.nasa. gov/products C005update.html. Major changes were made to the over-land aerosol al-gorithm and products. Over the ocean, only minor changes were implemented, specif-ically a small change in the refractive indices of 3 of the 5 coarse aerosol modes. Initial 20
ACPD
9, 11753–11781, 2009Testing aerosol properties in MODIS
Collection 4 and 5
J. Redemann et al.
Title Page
Abstract Introduction
Conclusions References
Tables Figures
◭ ◮
◭ ◮
Back Close
Full Screen / Esc
Printer-friendly Version
Interactive Discussion 2.3 MODIS retrievals of aerosol fine mode fraction and in situ measurements of
the relationship between Angstrom exponent and aerosol submicron fraction of extinction
To derive an estimate of the anthropogenic portion of aerosol radiative forcing of climate an estimate of the anthropogenic contribution to the atmospheric aerosol burden is 5
needed (Kaufman et al., 2002). MODIS provides an estimate of that contribution in the form of the aerosol fine-mode fraction (FMF) which is defined as the ratio of AOD from the fine-mode to the total (fine-mode plus coarse-mode) AOD at 553 nm, viz.:
FMF= AODfine AODfine+AODcoarse
. (1)
The underlying assumption in the use of FMF as a measure of the anhtropogenic 10
fraction of total aerosol loading is that the AOD in the fine mode is due solely to combustion-generated aerosol species, while the AOD in the coarse mode is due only to mechanically-generated, natural aerosols. Testing the retrievals of MODIS FMF is complicated by at least two factors. First, there are only a few methods to evaluate the MODIS FMF. One such method is the use of AERONET observations, either from 15
the inversion of sky-radiance measurements (Kleidman et al., 2005) or from the spec-tral deconvolution method (O’Neill et al., 2003), although neither method has itself been compared to in situ measurements. Another method introduced by Anderson et al. (2005) uses in situ observations of the sub-micron fraction (SMFE) of aerosol extinc-tion, i.e., the fraction of extinction that is due to particles of aerodynamic diameters less 20
than one micrometer, in vertical aircraft profiles. These in situ measurements can be used to derive a functional relationship between the extinction Angstrom exponent and SMFE which is subsequently applied to sunphotometer-derived Angstrom exponents to derive full column measures of the aerosol sub-micron fraction of AOD, SMF:
SMF=AODD<1µm AODtotal
. (2)
ACPD
9, 11753–11781, 2009Testing aerosol properties in MODIS
Collection 4 and 5
J. Redemann et al.
Title Page
Abstract Introduction
Conclusions References
Tables Figures
◭ ◮
◭ ◮
Back Close
Full Screen / Esc
Printer-friendly Version
Interactive Discussion A significant complication in testing FMF with SMF stems from the overlap in the
parti-cle size ranges of the MODIS fine and coarse mode lognormal models, which means that suborbital measurements of size-segregated aerosol extinction cannot unambigu-ously determine whether particles above or below a certain size cut-offcontributed to the extinction of the fine or coarse mode aerosol (Anderson et al. 2005). In fact, the 5
difference in definition between FMF and SMF alone may result in differences of 0.1 or more for a given Angstrom exponent as pointed out by Anderson et al. (2005).
Because the J31 aircraft that carried AATS-14 in INTEX-B/MILAGRO was not equipped with in situ instrumentation, we use the approach devised by Anderson et al. (2005) to derive a suborbital measure of SMF. This approach requires a functional 10
relationship between SMFE and the aerosol Angstrom exponent, defined for aerosol extinction as:
α(λ1, λ2)=−
ln ext(λ1)/ext(λ2)
ln λ1/λ2
. (3)
We then apply this functional relationship to the Angstrom exponent calculated from AATS-14 AOD measurements, thereby deriving SMF for all AATS-14 full column 15
AOD observations.
The in situ measurements used here to determine the relationship between α
and SMFE were taken with nephelometers and particle soot absorption photometers (PSAP) aboard the NASA DC-8 research aircraft during INTEX-B/MILAGRO. For de-tails see Sect. 3.2 of McNaughton et al. (2009). Briefly, the light scattering by dried 20
aerosols was measured at 450, 550 and 700 nm with 2 TSI 3563 nephelometers, one of them with an impactor in line to accept particles smaller than 1µm in aerodynamic di-ameter only. Likewise, the light absorption at 470, 530 and 660 nm was measured with 2 PSAPs, one of them behind the impactor. Two other nephelometers manufactured by Radiance Research were operated, one at relative humidty (RH) below 40% and 25
ACPD
9, 11753–11781, 2009Testing aerosol properties in MODIS
Collection 4 and 5
J. Redemann et al.
Title Page
Abstract Introduction
Conclusions References
Tables Figures
◭ ◮
◭ ◮
Back Close
Full Screen / Esc
Printer-friendly Version
Interactive Discussion the dry scattering coefficient and the ambient RH, provided our best estimate of light
scattering under the ambient conditions. The humidified scattering results for both sub-micron and all particles were added to the absorption coefficients of the respective size ranges to yield the extinction coefficients. Their ratio is the SMFE. The wavelength de-pendence of the total extinction coefficient, obtained from a quadratic least-square fit 5
of log(extinction) versus log(λ), is the Angstrom exponent as defined in Eq. 3.
3 Results
3.1 Spectral AOD comparisons
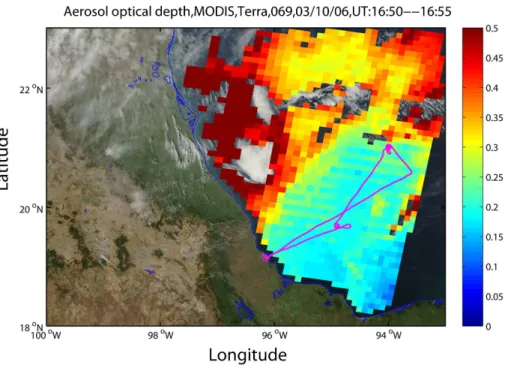
All suborbital measurements considered in this paper for the validation of MODIS aerosol retrievals were taken within ±30 min of satellite overpass time at aircraft al-10
titudes below 80 m (usually at altitudes of 30–40 m). As an example, Fig. 1 shows the J31 flight track on 10 March 2006, overlain onto a MODIS 553 nm AOD retrieval map. The AOD retrievals are themselves overlain on top of an RGB image produced from radiances measured in MODIS bands 1, 3 and 4. In this section, we present compar-isons between MODIS and AATS aerosol measurements for a total of 37 coincident 15
observations with MODIS-Terra on 5, 10 and 12 March 2006 and a total of 18 coin-cident observations with MODIS-Aqua on 10 and 17 March 2006. Within each of the 10×10km2 MODIS aerosol retrieval boxes, the AATS measurements of AOD were av-eraged to yield a spectrum, which was then fitted with a quadratic least-square fit of log(AOD) versus log(λ). From the AATS-fit, the AOD at the intermediate MODIS wave-20
lengths of 466, 553, 644, 855, 1243, 1632 and 2119 nm was determined. Although some MODIS wavelengths are represented within the AATS-14 spectrum, the fit pro-cedure above was used to minimize the impact of possible AATS-14 single-channel contamination, calibration uncertainties, and uncertainties stemming from gaseous ab-sorption at the near-IR wavelengths. For the AATS-MODIS comparisons in this paper 25
ACPD
9, 11753–11781, 2009Testing aerosol properties in MODIS
Collection 4 and 5
J. Redemann et al.
Title Page
Abstract Introduction
Conclusions References
Tables Figures
◭ ◮
◭ ◮
Back Close
Full Screen / Esc
Printer-friendly Version
Interactive Discussion flag, also called Quality Confidence (QC) flag, indicated “successful” AOD retrievals
with values of QC≥1. “Successful” in this context means that the AOD values are recommended for quantitative scientific use.
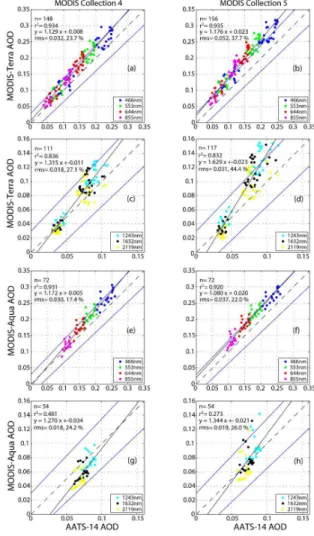
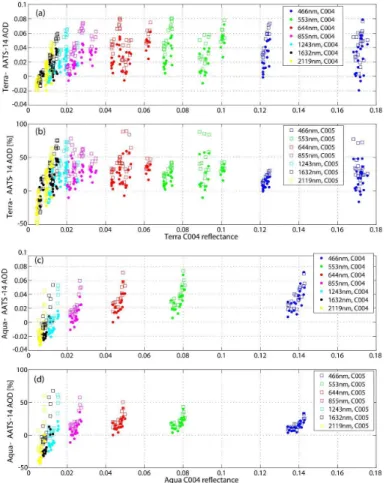
Figure 2 shows scatter plots of MODIS-Terra (Fig. 2a–d) and MODIS-Aqua (Fig. 2e– h) versus AATS-derived AOD. Uncertainty range estimates of±0.03±0.05 AOD (Remer 5
et al., 2005) for the MODIS-derived AOD are given as blue lines. The left hand plots show the comparisons between AATS and MODIS C4, while the right hand plots show comparisons between AATS and MODIS C5. The scatter plots are broken down into “visible” wavelengths (i.e., 466 nm, 553 nm, 644 nm and 855 nm, in Fig. 2, panels a, b, e and f) and SWIR wavelengths (i.e., 1243 nm, 1632 nm and 2119 nm, in Fig. 2, 10
panels c, d, g and h). The transition from C4 to C5 results in larger rms differences be-tween AATS and MODIS for MODIS-Terra, and only small changes in rms differences between AATS and MODIS for MODIS-Aqua. Columns 2 and 3 of Table 1 summarize the mean difference between AATS and C4, and AATS and C5, respectively, for each of the seven MODIS wavelengths. The comparison reveals that in the case of MODIS-15
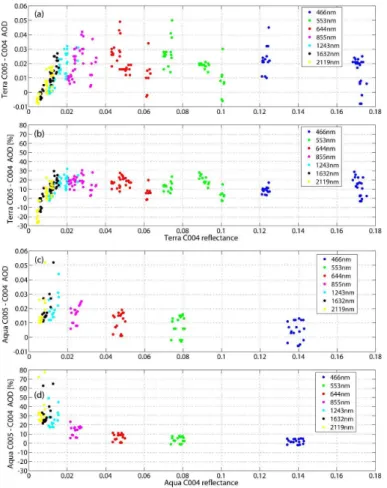
Terra the transition from C4 to C5 results in differences from AATS that increase by up to 0.02 in the visible bands and by up to 0.01 in the SWIR bands. For MODIS-Aqua, the transition from C4 to C5 results in only small increases in the differences to AATS in the visible bands. In the SWIR bands, the differences from AATS generally decrease, indicating improved retrievals at these wavelengths. Figure 3 shows these results as 20
difference plots as a function of the MODIS measured reflectances. These reflectances are the averages of the 500×500 m2pixels that remained after the cloud and sediment masks, as well as the pixel reduction were applied. In Fig. 3, open squares denote the differences between MODIS and AATS-derived AOD for C5, while the solid circles show the difference between AATS and MODIS for C4. Figure 3 supports the general 25
conclusion that with the exception of the MODIS-Aqua SWIR bands, the transition from C4 to C5 results in less good agreement between AATS and MODIS AOD retrievals.
ACPD
9, 11753–11781, 2009Testing aerosol properties in MODIS
Collection 4 and 5
J. Redemann et al.
Title Page
Abstract Introduction
Conclusions References
Tables Figures
◭ ◮
◭ ◮
Back Close
Full Screen / Esc
Printer-friendly Version
Interactive Discussion there is an increase in AOD of about 0.02 at all wavelengths up to 1243 nm, with slightly
smaller absolute differences (albeit larger relative differences, see Fig. 4b) in the 1632 and 2119 nm AOD. For MODIS-Aqua, there is only a small difference of about 0.005 between C4 and C5 in the AOD at 466 nm, but this difference increases to about 0.02 in the SWIR bands, resulting in better agreement with AATS at those wavelengths as 5
noted above.
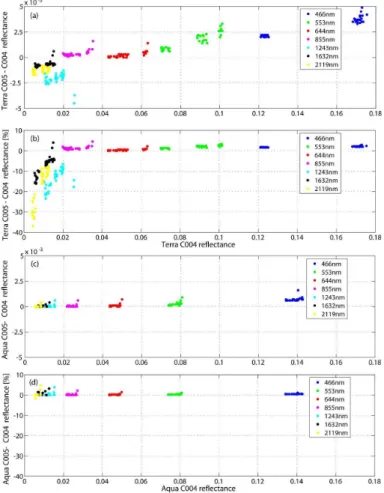
In looking for possible explanations of these findings, we now examine the mean reflectances that were used as input to the MODIS C4 and C5 AOD retrievals. Fig-ure 5 shows that for MODIS-Terra the transition from C4 to C5 resulted in generally increased reflectances at 466 nm and 553 nm, and generally decreased reflectances 10
in the SWIR bands. Column 4 of Table 1 confirms that the reflectances increased by up to 0.003 (2%) at 466 nm and decreased by up to 0.001 (17.6%) at 2119 nm. These changes correspond directly to the changes in AOD presented for MODIS-Terra in Fig. 4. For MODIS-Aqua, Fig. 5c shows that the changes in reflectances between C4 and C5 are much smaller than the changes in MODIS-Terra. The average reflectance 15
increase at 466 nm between C4 and C5 for MODIS-Aqua is less than 0.001. In all MODIS-Aqua channels, the relative change in reflectances between C4 and C5 is less than 1%. However, in Fig. 4 we noted a significant increase in MODIS-Aqua SWIR AOD of∼0.02, which resulted in improved agreement with the AATS observations. We note that the MODIS aerosol retrievals are performed by simultaneously matching the 20
measured spectral reflectances at 6 wavelengths to reflectances calculated from com-binations of two aerosol modes (rather than matching the reflectances in all channels separately). Interestingly, the simultaneous increase in all reflectances of MODIS-Aqua between C4 and C5 resulted in the preferential increase in the AOD contributed by the coarse mode in the Aqua retrievals, and hence the preferential increase in SWIR AOD. 25
ACPD
9, 11753–11781, 2009Testing aerosol properties in MODIS
Collection 4 and 5
J. Redemann et al.
Title Page
Abstract Introduction
Conclusions References
Tables Figures
◭ ◮
◭ ◮
Back Close
Full Screen / Esc
Printer-friendly Version
Interactive Discussion within the context of the aerosol retrievals for C4 and C5. While we found significant
differences in the cloud fractions between C4 and C5, we found no correlation between the differences in cloud fractions and the differences in the input reflectances.
While the number of C4-C5 comparisons discussed so far is relatively small, their utility is obvious: they provide an opportunity for direct comparisons in the presence of 5
a traceable validation instrument (AATS) over dark ocean water, arguably the easiest background for satellite aerosol retrievals. To increase our confidence in the C4-C5 comparison results summarized in Table 1, we extended the comparisons to the entire region bounded by 18–23◦N and 93–100◦W (i.e., the area that is covered by the re-trieval map in Fig. 1) on each of the five study days (three for Terra and two for Aqua) 10
under the assumption that cross-validation with AATS in the entire area would result in the same results as it did in the limited number of case studies along the J31 flight track. In Table 2, columns 2 and 3, we reproduced the results of Table 1, columns 4 and 5, for comparison to the results for the entire region, which covers a total of 2997 valid MOD04 L2 retrievals for the three MODIS-Terra days and 2155 valid MYD04 L2 15
retrievals for the two MODIS-Aqua days. Comparing columns 3 and 5 of Table 2, we note that for MODIS-Aqua, the AOD results for the small number of comparisons that were supported by AATS are virtually identical with the results for the larger study re-gion. For MODIS-Terra, we find similar increases in mid-visible AOD in the transition from C4 to C5 for the larger study region as we did along the J31 flight track. However, 20
for the larger study region, we find an even larger increase in Terra SWIR AOD than what we calculated along the J31 track. This finding could be due to the preferential measurements by the J31 in severely cloud-free regions and larger differences in the MODIS SWIR AOD between C4 and C5 in closer proximity to clouds. In general, our extension of the C4-C5 comparisons from the area along the J31 flight track to the 25
ACPD
9, 11753–11781, 2009Testing aerosol properties in MODIS
Collection 4 and 5
J. Redemann et al.
Title Page
Abstract Introduction
Conclusions References
Tables Figures
◭ ◮
◭ ◮
Back Close
Full Screen / Esc
Printer-friendly Version
Interactive Discussion 3.2 MODIS FMF versus suborbital SMF observations
Similar to the analysis by Anderson et al. (2005), we attempt here to test the MODIS re-trievals of aerosol fine mode fraction, FMF, using a combination of AATS measurements of the aerosol Angstrom exponent with in situ measurements of size-dependent aerosol extinction. As described in Sect. 2.3 our method requires two steps. First, we use size-5
resolved in situ observations of aerosol scattering and absorption to derive a functional relationship between the extinction Angstrom exponent and the sub-micron fraction of aerosol extinction, SMFE. Second, we apply this relationship to AOD Angstrom ex-ponents to calculate the sub-micron fraction of AOD, SMF, under the assumption that vertical integration of SMFE yields SMF in the same manner that vertical integration of 10
aerosol extinction yields AOD; this assumption was shown by Anderson et al. (2005) to be valid for all cases considered in their study.
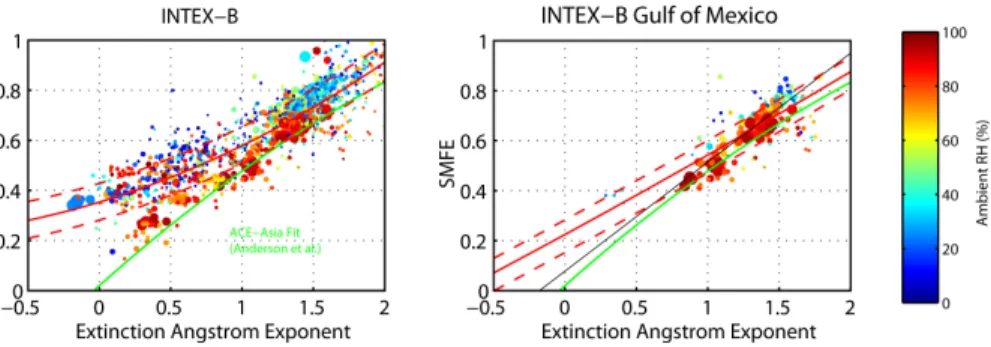
Using the INTEX-B in situ observations aboard the DC-8 in the Gulf of Mexico de-scribed in Sect. 2.3, we found the functional relationship shown as a solid red line in Fig. 6b between SMFE and the aerosol extinction Angstrom exponent,α:
15
SMFE=0.0075α2+0.3106α+0.2244 (4)
We found further that one standard deviation of all SMFE/αpairs were bounded by the range given by
SMFElow=0.0075α2+0.3106α+0.1524 (5a) SMFEhigh=0.0075α2+0.3106α+0.2827 (5b)
20
effectively providing an uncertainty in SMFE of the order of 0.065. For comparison, the functional relationship found by Anderson et al. (2005) in ACE-Asia plotted as green lines in Fig. 6a and b was:
ACPD
9, 11753–11781, 2009Testing aerosol properties in MODIS
Collection 4 and 5
J. Redemann et al.
Title Page
Abstract Introduction
Conclusions References
Tables Figures
◭ ◮
◭ ◮
Back Close
Full Screen / Esc
Printer-friendly Version
Interactive Discussion A comparison of Eqs. (4) and (6) reveals that for Angstrom exponents greater than 0.9,
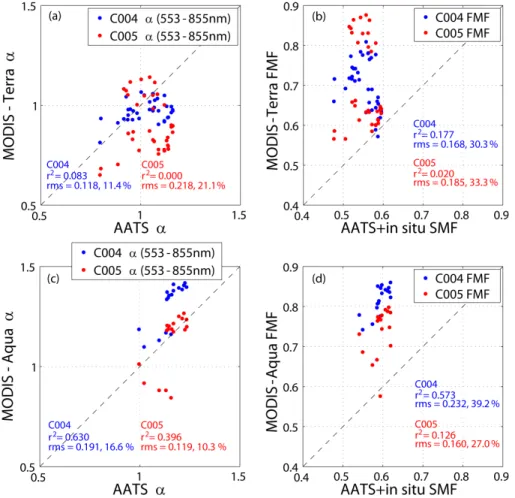
the fits agree with each other within the uncertainty range established by Eq. (5). Figure 7a and c compares the AATS-14 retrievals of AOD Angstrom exponent to the MODIS retrievals of Angstrom exponent, both calculated from AOD at 553 nm and 855 nm, for MODIS-Terra (Fig. 7a) and MODIS-Aqua (Fig. 7c), respectively. In the 5
case of MODIS-Terra, the rms-difference to the AATS retrievals increased between C4 and C5, while in the case of MODIS-Aqua, the rms-difference to the AATS results decreased, indicating again an improvement between C4 and C5 for MODIS-Aqua.
Applying Eq. (4) to the full column AOD Angstrom exponents calculated from AATS-14 AOD spectra yields the SMF values plotted as ordinates in Fig. 7b and d for MODIS-10
Terra and MODIS-Aqua, respectively. In the case of MODIS-Terra, the rms-difference between MODIS FMF and suborbital SMF shows no significant change between C4 and C5. Similar to the Angstrom exponent analysis, for MODIS-Aqua, the FMF/SMF comparison shows significant improvement in going from C4 to C5, with the rms-difference reduced from 0.23 to 0.16. However, both the Terra and Aqua C5 retrievals 15
of FMF show a consistent high-bias when compared to the suborbital SMF results.
4 Conclusions
In this paper we compare AATS retrievals of spectral aerosol optical depth (AOD) and derived aerosol properties with corresponding spatially coincident and temporally near-coincident measurements acquired by the MODIS-Aqua and MODIS-Terra satellite 20
sensors. These comparisons are carried out for the older MODIS Collection 4 (C4) and the new Collection 5 (C5) data set, the latter representing a reprocessing of the entire MODIS data set completed during 2006. They allow us a direct, validated as-sessment of the differences between select MODIS C4 and C5 aerosol retrievals. Our analyses indicate notable differences between MODIS C4 and C5. For MODIS-Terra, 25
ACPD
9, 11753–11781, 2009Testing aerosol properties in MODIS
Collection 4 and 5
J. Redemann et al.
Title Page
Abstract Introduction
Conclusions References
Tables Figures
◭ ◮
◭ ◮
Back Close
Full Screen / Esc
Printer-friendly Version
Interactive Discussion derived visible AOD, with average differences at 553 nm increasing from 0.03 to 0.05.
For MODIS-Aqua, we find an average increase in AOD of 0.008 at 553 nm, but an in-crease of nearly 0.02 at the SWIR wavelengths. The change from C4 to C5 results in slightly less good agreement with the AATS derived spectral AOD, with average dif-ferences at 553 nm increasing from 0.03 to 0.04. However, at SWIR wavelengths, the 5
changes from C4 to C5 result in improved agreement between MODIS and AATS, with the average differences at 2119 nm decreasing from −0.02 to −0.003. We note that our previous work (Redemann et al., 2006) with MODIS-Aqua AOD retrievals at SWIR wavelengths had indicated notable underestimates of MODIS AOD when compared to AATS measurements and that the increase in AOD between C4 and C5 found here 10
would have improved the comparisons between AATS and MODIS-Aqua considered in that paper.
Comparing the Angstrom exponents calculated from AOD at 553 nm and 855 nm, we find an increased rms difference from AATS derived Angstrom exponents in going from C4 to C5 for MODIS-Terra. Conversely, we find a decrease in rms difference and hence 15
an improvement for the transition from C4 to C5 in MODIS-Aqua. Combining the AATS retrievals with in situ measurements of size-dependent aerosol extinction, we derive a suborbital measure of the aerosol submicron fraction (SMF) of AOD and compare it to MODIS retrievals of aerosol fine mode fraction (FMF). Our analysis indicates a signifi-cant rms-difference between the MODIS-Terra FMF and AATS-derived SMF of 0.17 for 20
both C4 and C5. For MODIS-Aqua, there is a slight improvement in the transition from C4 to C5, with the rms-difference to AATS dropping from 0.23 to 0.16.
The differences in MODIS C4 and C5 AOD in this limited data set can be traced to changes in the mean reflectances that serve as input to the MODIS aerosol retrievals. We investigated possible reasons for these differences by looking for differences in the 25
ACPD
9, 11753–11781, 2009Testing aerosol properties in MODIS
Collection 4 and 5
J. Redemann et al.
Title Page
Abstract Introduction
Conclusions References
Tables Figures
◭ ◮
◭ ◮
Back Close
Full Screen / Esc
Printer-friendly Version
Interactive Discussion region along the J31 flight track to a larger study region between 18–23◦N and 93–
100◦W on each of the J31 flight days supports the findings of significant differences between MODIS C4 and C5, both in terms of reflectances as well as spectral AOD. Acknowledgements. The MILAGRO/INTEX-B Campaign is a collaborative effort of a large number of participants with the support of multi-national agencies. The MILAGRO/INTEX-B
5
participants would like to thank the governments of the Federal District, the States of Mexico, Hidalgo and Veracruz, the Mexican Ministries of the Environment, Foreign Relations, Defense and Finance for their logistical support; IMP, U-Tec ´amac, and Rancho La Bisnega for host-ing the supersites as well as many other Mexican institutions for their support. We thank all INTEX-B/MILAGRO participants and sponsoring agencies for making this research possible.
10
J31 measurements were supported by the NASA Radiation Science Program.
References
Ackerman, A. S., Toon, O. B., Stevens, D. E., Heymsfield, A. J., Ramanathan, V., and Welton, E. J.: Reduction of tropical cloudiness by soot, Science, 288, 1042–1047, 2000.
Albrecht, B. A., Aerosols, cloud microphysics, and fractional cloudiness, Science, 245, 1227–
15
1230, 1989.
Anderson, T. L., Wu, Y., Chu, D. A., Schmid, B., Redemann, J., and Dubovik, O.: Testing the MODIS satellite retrieval of aerosol fine-mode fraction, J. Geophys. Res., 110, D18204, doi:10.1029/2005JD005978, 2005.
Kaufman, Y., Tanr ´e, D., and Boucher, O.: A satellite view of aerosols in the climate system,
20
Nature, 419, 215–223, 2002.
Kleidman, R. G., O’Neill, N. T., Remer, L. A., Kaufman, Y. J., Eck, T. F., Tanre’, D., Dubovik, O., and Holben, B. N.: Comparison of Moderate Resolution Imaging Spectroradiometer (MODIS) and Aerosol Robotic Network (AERONET) remote-sensing retrievals of aerosol fine mode fraction over ocean, J. Geophys. Res., 110, D22205, doi:10.1029/2005JD005760, 2005.
25
Li, R.-R., Kaufman, Y. J., Gao, B.-C., and Davis, C. O.: Remote sensing of suspended sedi-ments and shallow coastal waters, IEEE T. Geosci. Remote, 41, 559–566, 2003.
ACPD
9, 11753–11781, 2009Testing aerosol properties in MODIS
Collection 4 and 5
J. Redemann et al.
Title Page
Abstract Introduction
Conclusions References
Tables Figures
◭ ◮
◭ ◮
Back Close
Full Screen / Esc
Printer-friendly Version
Interactive Discussion
Johnson, R., and Zhang, Q.: Comparison of aerosol optical depths from the Ozone Moni-toring Instrument (OMI) on Aura with results from airborne sunphotometry, other space and ground measurements during MILAGRO/INTEX-B, Atmos. Chem. Phys. Discuss., 9, 9961– 10013, 2009,
http://www.atmos-chem-phys-discuss.net/9/9961/2009/.
5
Livingston, J. M., Schmid, B., Russell, P. B., Eilers, J. A., Kolyer, R. W., Redemann, J., Ramirez, S. R., Yee, J.-H., Swartz, W. H., Trepte, C. R., Thomason, L. W., Pitts, M. C., Avery, M. A., Randall, C. E., Lumpe, J. D., Bevilacqua, R. M., Bittner, M., Erbertseder, T., McPeters, R. D., Shetter, R. E., Browell, E. V., Kerr, J. B., and Lamb, K.: Retrieval of ozone column content from airborne Sun photometer measurements during SOLVE II: comparison with coincident
10
satellite and aircraft measurements, Atmos. Chem. Phys., 5, 2035–2054, 2005, http://www.atmos-chem-phys.net/5/2035/2005/.
Livingston, J. M., Schmid, B., Redemann, J., Russell, P. B., Ramirez, S. A., Eilers, J., Gore, W., Howard, S., Pommier, J., Fetzer, E. J., Seemann, S. W., Borbas, E., Wolfe, D. E., and Thompson, A. M.: Comparison of water vapor measurements by airborne Sun photometer
15
and near-coincident in situ and satellite sensors during INTEX/ITCT 2004, J. Geophys. Res., 112, D12S16, doi:10.1029/2006JD007733, 2007.
Martins, J. V., Tanr ´e, D., Remer, L., Kaufman, Y., Mattoo, S., and Levy, R.: MODIS cloud screening for remote sensing of aerosols over oceans using spatial variability, Geophys. Res. Lett., 29(12), 8009, doi:10.1029/2001GL013252, 2002.
20
McNaughton, C. S., Clarke, A. D., Kapustin, V., Shinozuka, Y., Howell, S. G., Anderson, B. E., Winstead, E., Dibb, J., Scheuer, E., Cohen, R. C., Wooldridge, P., Perring, A., Huey, L. G., Kim, S., Jimenez, J. L., Dunlea, E. J., DeCarlo, P. F., Wennberg, P. O., Crounse, J. D., Weinheimer, A. J., and Flocke, F.: Observations of heterogeneous reactions between Asian pollution and mineral dust over the Eastern North Pacific during INTEX-B, Atmos. Chem.
25
Phys. Discuss., 9, 8469–8539, 2009,
http://www.atmos-chem-phys-discuss.net/9/8469/2009/.
Michalsky, J. J., Liljegren, J. C., and Harrison, L. C.: A comparison of Sun photometer deriva-tions of total column water vapor and ozone to standard measures of same at the Southern Great Plains Atmospheric Radiation site, J. Geophys. Res., 100, 25 995–26 003, 1995.
30
ACPD
9, 11753–11781, 2009Testing aerosol properties in MODIS
Collection 4 and 5
J. Redemann et al.
Title Page
Abstract Introduction
Conclusions References
Tables Figures
◭ ◮
◭ ◮
Back Close
Full Screen / Esc
Printer-friendly Version
Interactive Discussion
Molina, L. T., Madronich, S., Gaffney, J., et al.: An Overview of MILAGRO 2006 Campaign: Mexico City Emissions and its Transport and Transformation, Atmos. Chem. Phys. Discuss., in preparation, 2009.
O’Neill, N. T., Eck, T. F., Smirnov, A., Holben, B. N., and Thulasiraman, S.: Spectral dis-crimination of coarse and fine mode optical depth, J. Geophys. Res., 108(D17), 4559,
5
doi:10.1029/2002JD002975, 2003.
Reagan, J., Thome, K., Herman, B., Stone, R., Deluisi, J., and Snider, J.: A comparison of columnar water-vapor retrievals obtained with near-IR solar radiometer and microwave ra-diometer measurements, J. Appl. Meteorol., 34, 1384–1391, 1995.
Redemann, J., Zhang, Q., Schmid, B., Russell, P. B., Livingston, J. M., Jonsson, H., and
10
Remer, L. A.: Assessment of MODIS-derived visible and near-IR aerosol optical properties and their spatial variability in the presence of mineral dust, Geophys. Res. Lett., 33, L18814, doi:10.1029/2006GL026626, 2006.
Remer, L., Kaufman, Y. J., Tanr ´e, D., Mattoo, S., Chu, D. A., Martins, J. V., Li, R.-R., Ichoku, C., Levy, R. C., Kleidman, R. G., Eck, T. F., Vermote, E., and Holben, B. N.: The MODIS aerosol
15
algorithm, products and validation, J. Atmos. Sci., 62, 947–973, 2005.
Rosenfeld, D.: TRMM Observed First Direct Evidence of Smoke from Forest Fires Inhibiting Rainfall, Geophys. Res. Lett., 26(20), 3105–3108, 1999.
Russell, P. B., Livingston, J. M., Dutton, E. G., Pueschel, R. F., Reagan, J. A., DeFoor, T. E., Box, M. A., Allen, D., Pilewskie, P., Herman, B. M., Kinne, S. A., and Hofmann, D. J.: Pinatubo
20
and pre-Pinatubo optical-depth spectra: Mauna Loa measurements, comparisons, inferred particle size distributions, radiative effects, and relationship to lidar data, J. Geophys. Res., 98, 22 969–22 985, 1993a.
Russell, P. B., Livingston, J. M., Pueschel, R. F., Reagan, J. A., Browell, E. V., Toon, G. C., Newman, P. A., Schoeberl, M. R., Lait, L. R., Pfister, L., Gao, Q., and Herman, B. M.:
Post-25
Pinatubo optical depth spectra vs. latitude and vortex structure: Airborne tracking sunpho-tometer measurements in AASE II, Geophys. Res. Lett., 20, 2571–2574, 1993b.
Russell, P., Livingston, J., Schmid, B., Eilers, J., Kolyer, R., Redemann, J., Ramirez, S., Yee, J.-H., Swartz, W., Shetter, R., Trepte, C., Risley Jr., A., Wenny, B., Zawodny, J., Chu, W., Pitts, M., Lumpe, J., Fromm, M., Randall, C., Hoppel, K., and Bevilacqua, R.: Aerosol optical
30
ACPD
9, 11753–11781, 2009Testing aerosol properties in MODIS
Collection 4 and 5
J. Redemann et al.
Title Page
Abstract Introduction
Conclusions References
Tables Figures
◭ ◮
◭ ◮
Back Close
Full Screen / Esc
Printer-friendly Version
Interactive Discussion
Russell, P. B., Livingston, J. M., Redemann, J., Schmid, B., Ramirez, S. A., Eilers, J., Kahn, R., Chu, A., Remer, L., Quinn, P. K., Rood, M. J., and Wang, W.: Multi-grid-cell validation of satellite aerosol property retrievals in INTEX/ITCT/ICARTT 2004, J. Geophys. Res., 112, D12S09, doi:10.1029/2006JD007606, 2007.
Schmid, B. and Wehrli, C.: Comparison of sun photometer calibration by Langley technique
5
and standard lamp, Appl. Optics, 34, 4500–4512, 1995.
Schmid, B., Thome, K. J., Demoulin, P., Peter, R., Matzler, C., and Sekler, J.: Comparison of modeled and empirical approaches for retrieving columnar water vapor from solar transmit-tance measurements in the 0.94-µm region, J. Geophys. Res., 101, 9345–9358, 1996. Schmid, B., Michalsky, J. J., Slater, D. W., Barnard, J. C., Halthore, R. N., Liljegren, J. C.,
Hol-10
ben, B. N., Eck, T. F., Livingston, J. M., Russell, P. B., Ingold, T., and Slutsker, I.: Comparison of columnar water-vapor measurements from solar transmittance methods, Appl. Optics, 40, 1886–1896, 2001.
Schmid, B., Hegg, D. A., Wang, J., Bates, D., Redemann, J., Russell, P. B., Livingston, J. M., Jonsson, H. H., Welton, E. J., Seinfeld, J. H., Flagan, R. C., Covert, D. S., Dubovik, O.,
15
and Jefferson, A.: Column closure studies of lower tropospheric aerosol and water vapor during ACE-Asia using airborne sunphotometer, airborne in-situ and ship-based lidar mea-surements, J. Geophys. Res., 108(D23), 8656, doi:10.10292002JD003361, 2003.
Smirnov, A., Holben, B. N., Eck, T. F., Dubovik, O., and Slutsker, I.: Cloud screening and quality control algorithms for the AERONET data base, Remote Sens. Enviorn., 73(3), 337–349,
20
2000.
ACPD
9, 11753–11781, 2009Testing aerosol properties in MODIS
Collection 4 and 5
J. Redemann et al.
Title Page
Abstract Introduction
Conclusions References
Tables Figures
◭ ◮
◭ ◮
Back Close
Full Screen / Esc
Printer-friendly Version
Interactive Discussion
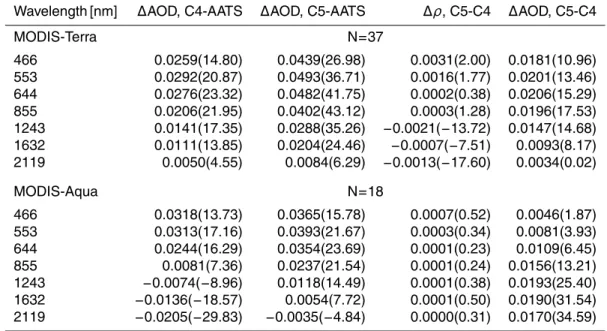
Table 1. Comparison of MODIS Collection 4 and Collection 5 AOD retrievals to AATS
mea-surements (columns 2 and 3) and to each other (column 5). Column 4 shows the difference in reflectances between C4 and C5. Column 5 shows the difference in AOD between C4 and C5. Results are the mean of the differences of all retrieval pairs (37 Terra and 18 MODIS-Aqua cases) considered. Numbers in parentheses are changes in percent.
Wavelength [nm] ∆AOD, C4-AATS ∆AOD, C5-AATS ∆ρ, C5-C4 ∆AOD, C5-C4
MODIS-Terra N=37
466 0.0259(14.80) 0.0439(26.98) 0.0031(2.00) 0.0181(10.96) 553 0.0292(20.87) 0.0493(36.71) 0.0016(1.77) 0.0201(13.46) 644 0.0276(23.32) 0.0482(41.75) 0.0002(0.38) 0.0206(15.29) 855 0.0206(21.95) 0.0402(43.12) 0.0003(1.28) 0.0196(17.53) 1243 0.0141(17.35) 0.0288(35.26) −0.0021(−13.72) 0.0147(14.68) 1632 0.0111(13.85) 0.0204(24.46) −0.0007(−7.51) 0.0093(8.17) 2119 0.0050(4.55) 0.0084(6.29) −0.0013(−17.60) 0.0034(0.02)
MODIS-Aqua N=18
ACPD
9, 11753–11781, 2009Testing aerosol properties in MODIS
Collection 4 and 5
J. Redemann et al.
Title Page
Abstract Introduction
Conclusions References
Tables Figures
◭ ◮
◭ ◮
Back Close
Full Screen / Esc
Printer-friendly Version
Interactive Discussion
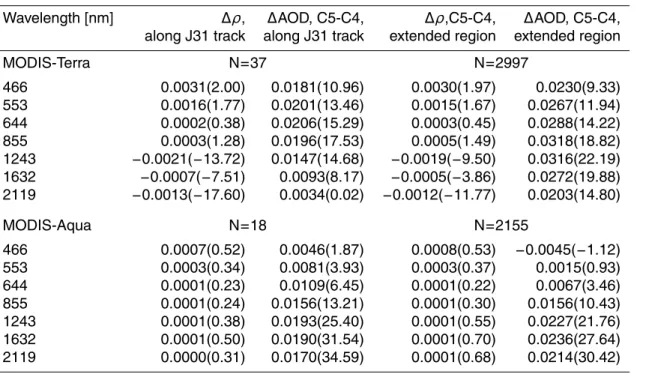
Table 2.Comparison of MODIS C4 and C5. Columns 2 and 3 are the same as columns 4 and
5 of Table 1 and are given here for easy comparison to the results in columns 4 and 5, which show the results on the same days as the J31 flight days, but for the extended area of 18–23◦N and 93–100◦W, i.e., the area that is covered by the retrieval map in Fig. 1.
Wavelength [nm] ∆ρ, ∆AOD, C5-C4, ∆ρ,C5-C4, ∆AOD, C5-C4, along J31 track along J31 track extended region extended region
MODIS-Terra N=37 N=2997
466 0.0031(2.00) 0.0181(10.96) 0.0030(1.97) 0.0230(9.33) 553 0.0016(1.77) 0.0201(13.46) 0.0015(1.67) 0.0267(11.94) 644 0.0002(0.38) 0.0206(15.29) 0.0003(0.45) 0.0288(14.22) 855 0.0003(1.28) 0.0196(17.53) 0.0005(1.49) 0.0318(18.82)
1243 −0.0021(−13.72) 0.0147(14.68) −0.0019(−9.50) 0.0316(22.19)
1632 −0.0007(−7.51) 0.0093(8.17) −0.0005(−3.86) 0.0272(19.88)
2119 −0.0013(−17.60) 0.0034(0.02) −0.0012(−11.77) 0.0203(14.80)
MODIS-Aqua N=18 N=2155
ACPD
9, 11753–11781, 2009Testing aerosol properties in MODIS
Collection 4 and 5
J. Redemann et al.
Title Page
Abstract Introduction
Conclusions References
Tables Figures
◭ ◮
◭ ◮
Back Close
Full Screen / Esc
Printer-friendly Version
Interactive Discussion
Fig. 1.Example of a J31 flight track on 10 March 2006, that was overlain on a MODIS 553 nm
ACPD
9, 11753–11781, 2009Testing aerosol properties in MODIS
Collection 4 and 5
J. Redemann et al.
Title Page
Abstract Introduction
Conclusions References
Tables Figures
◭ ◮
◭ ◮
Back Close
Full Screen / Esc
Printer-friendly Version
Interactive Discussion
ACPD
9, 11753–11781, 2009Testing aerosol properties in MODIS
Collection 4 and 5
J. Redemann et al.
Title Page
Abstract Introduction
Conclusions References
Tables Figures
◭ ◮
◭ ◮
Back Close
Full Screen / Esc
Printer-friendly Version
Interactive Discussion
Fig. 3. (a)Absolute difference in spectral AOD between MODIS-Terra C4 and AATS-14 (solid
ACPD
9, 11753–11781, 2009Testing aerosol properties in MODIS
Collection 4 and 5
J. Redemann et al.
Title Page
Abstract Introduction
Conclusions References
Tables Figures
◭ ◮
◭ ◮
Back Close
Full Screen / Esc
Printer-friendly Version
Interactive Discussion
Fig. 4. (a) Absolute difference in spectral AOD between C4 and C5 for MODIS-Terra as a
ACPD
9, 11753–11781, 2009Testing aerosol properties in MODIS
Collection 4 and 5
J. Redemann et al.
Title Page
Abstract Introduction
Conclusions References
Tables Figures
◭ ◮
◭ ◮
Back Close
Full Screen / Esc
Printer-friendly Version
Interactive Discussion
ACPD
9, 11753–11781, 2009Testing aerosol properties in MODIS
Collection 4 and 5
J. Redemann et al.
Title Page
Abstract Introduction
Conclusions References
Tables Figures
◭ ◮
◭ ◮
Back Close
Full Screen / Esc
Printer-friendly Version
Interactive Discussion
Fig. 6. In situ observations of SMFE and extinction Angstrom exponent from all INTEX-B
ACPD
9, 11753–11781, 2009Testing aerosol properties in MODIS
Collection 4 and 5
J. Redemann et al.
Title Page
Abstract Introduction
Conclusions References
Tables Figures
◭ ◮
◭ ◮
Back Close
Full Screen / Esc
Printer-friendly Version
Interactive Discussion
Fig. 7. (a)Comparison of MODIS-Terra and AATS-14 derived AOD Angstrom exponent for C4