Urban Chinese with Metabolic Syndrome and Application
to Coronary Heart Disease Prediction: A Longitudinal
Study
Zhenxin Zhu
1☯, Yanxun Liu
1☯, Chengqi Zhang
2, Zhongshang Yuan
1, Qian Zhang
1, Fang Tang
2, Haiyan
Lin
3, Yongyuan Zhang
1, Longjian Liu
4, Fuzhong Xue
1*1 Department of Epidemiology and Biostatistics, School of Public Health, Shandong University, Jinan, Shandong, China, 2 Health Management Center, Shandong Provincial QianFoShan Hospital, Jinan, Shandong, China, 3 Center for Health Management, Provincial Hospital affiliated to Shandong University, Jinan, Shandong, China, 4 Department of Epidemiology and Biostatistics, Drexel University School of Public Health, Philadelphia, Pennsylvania, United States of America
Abstract
Background: Metabolic syndrome (MetS) is proposed as a predictor for cardiovascular disease (CVD). It involves the mechanisms of insulin resistance, obesity, inflammation process of atherosclerosis, and their complex relationship in the metabolic network. Therefore, more cardiovascular risk-related biomarkers within this network should be considered as components of MetS in order to improve the prediction of CVD.
Methods: Factor analysis was performed in 5311 (4574 males and 737 females) Han Chinese subjects with MetS to extract CVD-related factors with specific clinical significance from 16 biomarkers tested in routine health check-up. Logistic regression model, based on an extreme case-control design with 445 coronary heart disease (CHD) patients and 890 controls, was performed to evaluate the extracted factors used to identify CHD. Then, Cox model, based on a cohort design with 1923 subjects followed up for 5 years, was conducted to validate their predictive effects. Finally, a synthetic predictor (SP) was created by weighting each factor with their risks for CHD to develop a risk matrix to predicting CHD.
Results: Eight factors were obtained from both males and females with a similar pattern. The AUC to classify CHD under the extreme case-control suggested that SP might serve as a useful tool in identifying CHD with 0.994 (95%CI 0.984-0.998) for males and 0.998 (95%CI 0.982-1.000) for females respectively. In the cohort study, the AUC to predict CHD was 0.871 (95%CI 0.851-0.889) for males and 0.899 (95%CI 0.873-0.921) for females, highlighting that
SP was a powerful predictor for CHD. The SP-based 5-year CHD risk matrix provided as convenient tool for CHD risk appraisal.
Conclusions: Eight factors were extracted from sixteen biomarkers in subjects with MetS and the SP adds to new insights into studies of prediction of CHD risk using data from routine health check-up.
Citation: Zhu Z, Liu Y, Zhang C, Yuan Z, Zhang Q, et al. (2013) Identification of Cardiovascular Risk Components in Urban Chinese with Metabolic Syndrome and Application to Coronary Heart Disease Prediction: A Longitudinal Study. PLoS ONE 8(12): e84204. doi:10.1371/journal.pone.0084204 Editor: Weiqing Han, VCU, United States of America
Received August 11, 2013; Accepted November 13, 2013; Published December 17, 2013
Copyright: © 2013 Zhu et al. This is an open-access article distributed under the terms of the Creative Commons Attribution License, which permits unrestricted use, distribution, and reproduction in any medium, provided the original author and source are credited.
Funding: The study was supported by grant 81273177 from the National Natural Science Foundation of China. The funders had no role in study design, data collection and analysis, decision to publish, or preparation of the manuscript.
Competing interests: The authors have declared that no competing interests exist. * E-mail: [email protected]
☯ These authors contributed equally to this work.
Introduction
Metabolic syndrome (MetS) is a public health challenge because of its high prevalence and association with the risk of cardiovascular disease (CVD) [1,2] and type 2 diabetes [3,4]. Several studies have applied MetS as a marker to predict the
This criterion is slightly different from the international definition of MetS [6]. In pathogenesis, MetS, defined by either Chinese or international criteria, is defined using factors including obesity, diabetes, hypertension, and dyslipidemia. Because these factors are involved in the mechanisms of insulin resistance, and the process of inflammation and atherosclerosis, this complex relationship has been suggested in study as the metabolic network of MetS [7]. Therefore, a generalized definition of MetS could be extended using multiple components within this network. Several studies have suggested that the definition of MetS may further include microalbuminuria, proinflammatory cytokines, prothrombotic & fibrinolytic factors, and oxidative stress [8,9]. However, the structure and inclusion of MetS components are inconclusive [10]. Some studies found three or four factors, underlying the overall correlation between metabolic variables [11,12], while in recent years, some researchers verified a single-factor model that can represent MetS [13,14]. The different patterns of MetS components resulted from differences in data availability, the number of biomarkers incorporated into specific models, and studies with specific purposes. In the present study, we aimed to select several cardiovascular risk biomarkers involved in the above metabolic network using robust bio-statistical modeling technique to develop a MetS related synthetic predictor (SP) for classifying subjects with or without CVD, and to predict high risk of CVD using data from a large-scale routine health check-up sample among urban Chinese residents.
Materials and Methods
Ethics Statement
This study was approved by the Ethics Committee of School of Public Health, Shandong University, and all participants were informed by written consent to participate in this study. The data was de-identified before it was provided to us. The data can’t be shared with researchers upon request because while we cooperate with the hospital and have the right to use the data, the hospital is reluctant to let us share the data.
Study population
The study population includes a cohort of all participants who received routine health check-ups from 2005 to 2010 at the Center for Health Management of Shandong Provincial QianFoShan Hospital, and the Health Examination Center of Shandong Provincial Hospital. These two hospitals are affiliated teaching hospitals of the Shandong University, Jinan, Shandong province, China. Participants are urban residents living in Jinan city, the capital of Shandong province, and they were primarily employees. Participants who had completed physical examinations and the measurements of the study of biomarkers were included (n=28200). Of them, 5311 were classified having MetS (4574 males and 737 females) at their first health check-up using the criteria of the Chinese Medical Association. In the study, we used CHD as the study outcome, because MetS is suggested as an independent predictor for CHD [15-17]. Of 5311 MetS subjects, 445 cases (292 males and 153 females) had CHD diagnosed by physicians. Controls (n=890, males=584, and females=306) were randomly selected
from the individuals without any components of MetS in the present case-control study design. Of 28200, 1923 participants (1263 males and 660 females) who had no CHD at baseline and completed a 5-year follow-up were included in the present cohort study design. At the end of the follow-up period, 134 incident CHD cases (90 males and 44 females) were diagnosed and the cumulative incidence rate was 6.97% (7.13% in males and 6.67% in females) (Table S1).
Selection of biomarkers and measurements
In the present study, according to the complex relationship and the concept of metabolic network [7], we selected 16 biomarkers from the routine health check-up. They included non-alcoholic fatty liver (NAFLD), body mass index (BMI), systolic blood pressure (SBP), diastolic BP (DBP), total cholesterol (TC), low-density lipoprotein cholesterol (LDL-C), triglycerides (TG), high-density lipoprotein cholesterol (HDL-C), hemoglobin (Hb), hematokrit (HCT), alanine aminotransferase (ALT), gamma-glutamyl transpeptidase (GGT), serum uric acid (SUA), white blood cell (WBC) count, serum creatinine (CREA), and fasting blood-glucose (FBG). Among them, BMI, SBP, DBP, TG, HDL-C and FBG have been included in the traditional definition of MetS. Also, the others had been confirmed to meet the above criterion in longitudinal cohort studies, including NAFLD [18], TC [19-22], LDL-C [23], Hb/HCT [24], ALT/GGT [25-29], SUA [30-34], WBC count [35-39], and CREA [40].
All participants received a general health questionnaire survey, anthropometric measurement, and routine blood Table 1. Distribution of age and the sixteen biomarkers between male and female metabolic syndrome groups.
Male(n=4574) Female(n=737)P value
mean SD mean SD
Age (years) 50.85 11.96 60.65 11.19 <0.001
Body mass index (kg/m2) 28.13 2.57 27.88 3.04 0.03
Systolic blood pressure (mmHg) 143.00 17.45 150.45 20.51 <0.001 Diastolic blood pressure (mmHg) 87.24 12.00 81.65 12.09 <0.001 Serum uric acid (umol/L) 383.15 81.91 307.91 70.95 <0.001
Fasting blood-glucose (mmol/L) 6.48 1.86 6.67 1.94 0.01
Total cholesterol (mmol/L) 5.56 1.05 5.97 1.14 <0.001
Triglycerides (mmol/L) 2.94 2.33 2.32 1.42 <0.001
High-density lipoprotein cholesterol
(mmol/L) 1.22 0.34 1.35 0.37 <0.001
Low-density lipoprotein cholesterol
(mmol/L) 3.23 0.77 3.45 0.79 <0.001
White blood cell count (109/L) 7.07 1.68 6.90 1.64 0.01
Alanine aminotransferase (U/L) 31.21 22.39 22.66 16.69 <0.001 Gamma-glutamyl transpeptidase (U/L) 54.86 52.15 26.67 29.69 <0.001 Serum creatinine (umol/L) 88.13 13.69 72.63 16.08 <0.001
Hemoglobin (g/L) 157.72 10.45 137.99 11.17 <0.001
Hematokrit (%) 45.75 2.98 41.01 2.87 <0.001
Non-alcoholic fatty liver (n/%) 2875 62.86 417 56.58 <0.001 SD denotes standard deviation.
doi: 10.1371/journal.pone.0084204.t001
Metabolic Syndrome and Risk Appraisal of CHD
sample tests. The questionnaire covered demographic background and medical history. Anthropometric measurements included height, weight, and BP; both height and weight were measured with light clothing without shoes. BMI was calculated by weight/height2 (kg/m2). BP was
measured on the right arm from a sitting position after a 5-minute rest. Blood samples were drawn after overnight fasting (>8 hours) for laboratory tests. All lab tests were conducted by certified experimental specialists using standard protocols at the hospital’s Department of Laboratory. WBC, Hb and HCT were measured using SYSMEX XE-2100 automatic whole blood count system. FBG was measured by enzymic method, TC & GGT by enzymic colorimetric method, SUA & TG by colorimetric method, HDL-C & LDL-C by direct method, ALT by the criteria of International Federation of Clinical Chemistry (IFCC), and CREA by picric acid method using Roche Cobas 8000 Automatic Biochemical Analyzer. NAFLD was diagnosed by abdominal ultrasonography as brightness of the liver and a diffusely echogenic change in the liver parenchyma, with participants who were diagnosed alcoholic fatty liver disease, infected hepatitis virus (Hepatitis B antigen or hepatitis C antibody positive), and other causes of steatosis (Wilson disease) excluded. Based on the diagnostic criteria recommended by the Diabetes Branch of Chinese Medical Association[5], MetS was defined as presence of three or more of the following four risk factors: 1) overweight or obesity (BMI≥25.0 Kg/M2); 2) hypertension (SBP≥140mmHg,
DBP≥90mmHg or those with history of hypertension); 3) hyperglycemia (FPG≥6.1mmol/L or 2h plasma glucose≥7.8 mmol/L, or those with history of diabetes); 4) dyslipidemia (TG≥1.7 mmol/L, or C<0.9 mmol/L in male and HDL-C<1.0 mmol/L in female). CHD was diagnosed by physicians using the World Health Organization’s criteria (symptoms plus either diagnostic ECG changes or elevated levels of cardiac enzymes) [41].
Strategy of the development of synthetic predictor In the study, the orthogonal exploratory factor analysis (EFA), a standard method to identify patterns of MetS, was used to extract cardiovascular risk-related factors from the above 16 manifest biomarkers in the MetS population. After EFA, the clinical significance of each latent factor was named. Furthermore, the logistic regression discrimination (LRD) model based on an extreme case-control design was performed to evaluate their discriminant effects for CHD, and the Cox proportional hazard prediction model based on a cohort design was further conducted to validate their predictive effects. Finally, SP was created by weighting each factor with their risks for CHD for developing a risk matrix to predict CHD in the practice of routine health check-up.
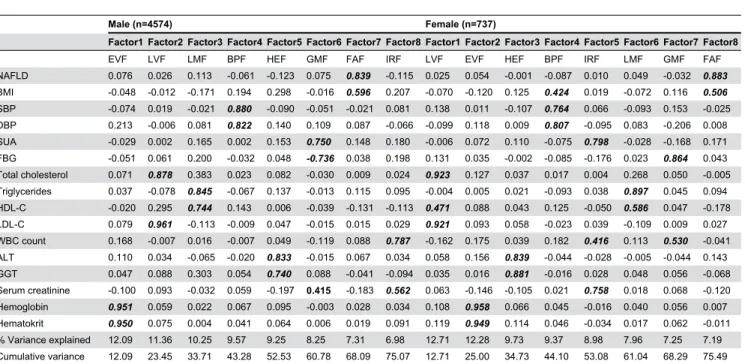
Table 2. Factor loadings by principal component analysis with varimax rotation on 16 routine health check-up biomarkers in MetS patients.
Male (n=4574) Female (n=737)
Factor1 Factor2 Factor3 Factor4 Factor5 Factor6 Factor7 Factor8 Factor1 Factor2 Factor3 Factor4 Factor5 Factor6 Factor7 Factor8
EVF LVF LMF BPF HEF GMF FAF IRF LVF EVF HEF BPF IRF LMF GMF FAF
NAFLD 0.076 0.026 0.113 -0.061 -0.123 0.075 0.839 -0.115 0.025 0.054 -0.001 -0.087 0.010 0.049 -0.032 0.883
BMI -0.048 -0.012 -0.171 0.194 0.298 -0.016 0.596 0.207 -0.070 -0.120 0.125 0.424 0.019 -0.072 0.116 0.506
SBP -0.074 0.019 -0.021 0.880 -0.090 -0.051 -0.021 0.081 0.138 0.011 -0.107 0.764 0.066 -0.093 0.153 -0.025
DBP 0.213 -0.006 0.081 0.822 0.140 0.109 0.087 -0.066 -0.099 0.118 0.009 0.807 -0.095 0.083 -0.206 0.008
SUA -0.029 0.002 0.165 0.002 0.153 0.750 0.148 0.180 -0.006 0.072 0.110 -0.075 0.798 -0.028 -0.168 0.171
FBG -0.051 0.061 0.200 -0.032 0.048 -0.736 0.038 0.198 0.131 0.035 -0.002 -0.085 -0.176 0.023 0.864 0.043
Total cholesterol 0.071 0.878 0.383 0.023 0.082 -0.030 0.009 0.024 0.923 0.127 0.037 0.017 0.004 0.268 0.050 -0.005
Triglycerides 0.037 -0.078 0.845 -0.067 0.137 -0.013 0.115 0.095 -0.004 0.005 0.021 -0.093 0.038 0.897 0.045 0.094
HDL-C -0.020 0.295 0.744 0.143 0.006 -0.039 -0.131 -0.113 0.471 0.088 0.043 0.125 -0.050 0.586 0.047 -0.178
LDL-C 0.079 0.961 -0.113 -0.009 0.047 -0.015 0.015 0.029 0.921 0.093 0.058 -0.023 0.039 -0.109 0.009 0.027
WBC count 0.168 -0.007 0.016 -0.007 0.049 -0.119 0.088 0.787 -0.162 0.175 0.039 0.182 0.416 0.113 0.530 -0.041
ALT 0.110 0.034 -0.065 -0.020 0.833 -0.015 0.067 0.034 0.058 0.156 0.839 -0.044 -0.028 -0.005 -0.044 0.143
GGT 0.047 0.088 0.303 0.054 0.740 0.088 -0.041 -0.094 0.035 0.016 0.881 -0.016 0.028 0.048 0.056 -0.068
Serum creatinine -0.100 0.093 -0.032 0.059 -0.197 0.415 -0.183 0.562 0.063 -0.146 -0.105 0.021 0.758 0.018 0.068 -0.120
Hemoglobin 0.951 0.059 0.022 0.067 0.095 -0.003 0.028 0.034 0.108 0.958 0.066 0.045 -0.016 0.040 0.056 0.007
Hematokrit 0.950 0.075 0.004 0.041 0.064 0.006 0.019 0.091 0.119 0.949 0.114 0.046 -0.034 0.017 0.062 -0.011
% Variance explained 12.09 11.36 10.25 9.57 9.25 8.25 7.31 6.98 12.71 12.28 9.73 9.37 8.98 7.96 7.25 7.19
Cumulative variance 12.09 23.45 33.71 43.28 52.53 60.78 68.09 75.07 12.71 25.00 34.73 44.10 53.08 61.04 68.29 75.49
Statistical analysis
Descriptive analysis. For patients with MetS, student t test (for continuous variables) and the χ2 test (for categorical
variables) were used to test the significant differences of the sixteen biomarkers between males and females. The difference in the prevalence of the four basic components (obesity, hypertension, dyslipidemia and hyperglycemia) and their
combination between males and females were tested by χ2
test.
Steps of the development of synthetic predictor. EFA with principal component algorithm and varimax rotation from correlation matrix was performed to extract independent factors of MetS from above 16 manifest biomarkers for male and female MetS groups respectively. The criteria for retaining Figure 1. ROC curve for discrimination and prediction of coronary heart disease. A1 and B1 show the discriminative curve under extreme case-control design for male and female respectively; A2 and B2 show the predictive curve under cohort design for male and female respectively. ROC, receiver operating characteristic.
doi: 10.1371/journal.pone.0084204.g001
Metabolic Syndrome and Risk Appraisal of CHD
15% of the factor variance, corresponding to a factor loading of at least 0.40 were used for further analytical interpretation [42,43]. After EFA, the clinical significance of each latent factor was named, and SP was created using a weighted approach:SP= 1F1+ 2F2+⋯+ kFk, where F1,F2,⋯Fk were the
extracted independent factors with specific clinical significance from the 16 manifest biomarkers, and 1, 2,⋯ kdenoted their
risks to CHD, which were partial regression coefficients in LRD and Cox regression models described below.
40-years-old and having AR of 0.082 has an EAR of 0.064 (0.082-0.018) and RAR of 4.56 (0.082/0.018), while a male aged 60-years-old and having AR of 0.082, has the EAR of -0.043 (0.082-0.125) and RAR of 0.656 (0.082/0.125). These show that although their predictive probabilities for CHD over 5 years are the same, the CHD risk of the younger male is higher than the average risk of the same age, almost 4.56 times that of his peers, indicating that changes in lifestyle and social intervention strategies are needed for him. Alternatively the older male has a lower CHD risk compared to his peers, only 65.6% of the average risk of 60-year-old population, indicating that he has a good health status compared with his peers.
Figure 3 shows the proportion of identified individuals with high risk of CHD among the total study sample (n=28200) using the cutoff point of AR with 0.0701 for male and 0.0739 for female as discriminate criterion (see Figures 1_A2 and 1_B2). The proportion of identified high risk individuals showed an S curve with age. For example, people at age 65 are at high risk of CHD (>90% for both genders) in the next 5 years.
Discussion
The present study is the first to apply a large population-based data sample from routine health check-ups in an urban resident sample in China. The study extended previous studies by adding new biomarkers to the network of MetS. The main findings suggest that a weighted SP developed from 8 latent variables are able to classify patients with and without CHD, and to predict subjects who are at high risk of CHD in 5 years.
The components of MetS
Clinical use of criteria for MetS is primarily to predict risk of CVD and diabetes. MetS was commonly defined by the presence of obesity, diabetes, hypertension, and dyslipidemia, and these factors were involved in the mechanisms of insulin resistance, inflammation, and atherosclerosis [7]. This complex relationship can be considered as the metabolic network of MetS. Therefore, other cardiovascular risks related to this network should be included in the concept of MetS in order to predict risk of CVD and diabetes more precisely. Several studies have suggested that NAFLD [45,46], SUA [47], microalbuminuria, proinflammatory cytokines, prothrombotic and fibrinolytic factors, and oxidative stress [8,9] should be part of the components of MetS. However, the inclusion of extended biomarkers may be differ by study populations, and the availability of measurements. For example, data from routine health check-ups, the generalized concept of MetS should be extended using biomarkers, which are routinely measured with simple, inexpensive and standardized approaches. In this paper, we extended previous studies using factor analysis to identify 8 factors from 16 biomarkers they are measured in routine health check-up. Of 8 factors, EVF, LMF, HEF, and FAF were contributed by Hb & HCT, TG &HDL-C, ALT & GGT, and NAFLD & BMI in both males and females, standing for erythrocyte viscosity, lipid metabolism, hepatic enzyme metabolism, and fat accumulation respectively. LVF stood for lipid viscosity with inclusive (i.e. high loadings in factor analysis) of TC & LDL-C in both genders, and with further
inclusive of HDL-C in females BPF reflected SBP & DBP in both genders, while BMI also had high loading on this factor in females. GMF, with FBG as the main manifestation, stood for glucose metabolism status, while SUA & CREA also had high loadings in males, and WBC count in females. This finding suggests that serum glucose concentration may be involved in renal function and inflammatory response. Similarly, IRF stood for inflammation response status with WBC count as the key element, clustered together with CREA in males while SUA & CREA in females, suggesting that WBC count was related to inflammation response status, which may link with renal function.
Synthetic predictor and its application
In CVD prevention, a well-established primary healthcare strategy is to identify population at higher risk using prediction models in order to prevent CVD at earlier stages [48]. Several prediction models, including the Framingham risk score, have been applied in healthcare and management in different populations [49-54]. However, the predictive powers of these models are relatively low (AUC usually around 0.80), which may be partially due to the limited number of selected predictive factors in these models. To improve and optimize the predictive models, one of the methods is to identify and add new predictors in the predictive models. In China, as part of primary healthcare support, routine health check-up for urban residents has been developed rapidly in recent years. A number of convenient and inexpensive measurements for CVD and diabetes related biomarkers are included in the health check-up. It provides us with a unique opportunity to develop new predictive models using these biomarkers to extend the concept of MetS in a cost-effective manner. In our present study, a weighted SP was created by summarizing eight latent factors. The results show that SP was not only a good discriminative index (assessed by ROC curves, Figures 1_A1 and 1_B1), but also a significantly improved predictor for CHD (Figures 1_A2 and 1_B2). The AUC for the prediction of 5-year risk of CHD in the total study population was more than 0.85 in both genders (Figures 1_A2 and 1_B2) and demonstrated the SP could be used as a simple and effective health management tool in routine health check-up to predict subjects at high risk of CHD. Furthermore, SP-based 5-year CHD absolute risk matrix and relative absolute risk matrix can be easily applied in practice (Figure 2). For example, for a male at a given age who receives health check-up, the matrices show his absolute hazard (A1) and the relative hazard ratio (A2) as compared with the average hazard in the same age group in males.
Advantages and limitations
LVF, LMF, BPF, HEF, GMF, FAF, and IRF). This approach has the advantage of taking into consideration the associations between predictors and outcomes (i.e., the use of weighting method), rather than simply summing up the number of predictors [55]. Meanwhile, two main limitations should be kept in mind when interpreting the results. First, although the study included a large population-based sample size, the results cannot be generalized for the general population because the participants who received routine health check-ups are urban residents and are employed. Second, the time period of follow-up in this cohort analysis is relatively short. Therefore, further studies are needed to confirm the findings.
Despite the aforementioned limitations above, the present study, using data from routine health check-ups, extends the previous concept of MetS by including variables related to the MetS network that are ready to use from routine health check-up. The developed SP shows as a simple and validate predictor for identifying subjects at high risk of CHD.
Supporting Information
Figure S1. The combined proportion of the 4 basic components between male and female metabolic syndrome groups. OB, obesity; HT, hypertension; HG, hyperglycemia; DY, dyslipidemia.
(TIF)
Table S1. The incidence of coronary heart disease by follow-up year.
(DOC)
Table S2. Correlation matrix of sixteen biomarkers. (DOC)
Table S3. The prevalence of the 4 basic components for both male and female metabolic syndrome groups.
(DOC)
Table S4. The standardized scoring coefficients of each factor for males and females.
(DOC)
Acknowledgements
We thank all the participants of the Center for Health Management of Shandong Provincial QianFoShan Hospital and the Health Examination Center of Shandong Provincial Hospital for their continued cooperation.
Author Contributions
Conceived and designed the experiments: FX YL. Performed the experiments: CZ FT HL. Analyzed the data: ZY QZ YZ ZZ. Contributed reagents/materials/analysis tools: CZ HL. Wrote the manuscript: ZZ FX. Reviewed the article and provided scientific comments and advice: LL.
References
1. Lakka HM, Laaksonen DE, Lakka TA, Niskanen LK, Kumpusalo E et al. (2002) The metabolic syndrome and total and cardiovascular disease mortality in middle-aged men. JAMA 288: 2709-2716. doi:10.1001/ jama.288.21.2709. PubMed: 12460094.
2. Scott R, Donoghoe M, Watts GF, O'Brien R, Pardy C et al. (2011) Impact of metabolic syndrome and its components on cardiovascular disease event rates in 4900 patients with type 2 diabetes assigned to placebo in the FIELD randomised trial. Cardiovasc Diabetol 10: 102. doi:10.1186/1475-2840-10-102. PubMed: 22104275.
3. Sattar N, McConnachie A, Shaper AG, Blauw GJ, Buckley BM et al. (2008) Can metabolic syndrome usefully predict cardiovascular disease and diabetes? Outcome data from two prospective studies. Lancet 371: 1927-1935. doi:10.1016/S0140-6736(08)60602-9. PubMed: 18501419. 4. Hanson RL, Imperatore G, Bennett PH, Knowler WC (2002)
Components of the "metabolic syndrome" and incidence of type 2 diabetes. Diabetes 51: 3120-3127. doi:10.2337/diabetes.51.10.3120. PubMed: 12351457.
5. Metabolic syndrome study cooperation group of Chinese diabetes society (2004) Suggestions about metabolic syndrome of Chinese diabetes society. Chin J Diab 12: 156-161
6. Grundy SM, Cleeman JI, Daniels SR, Donato KA, Eckel RH et al. (2005) Diagnosis and management of the metabolic syndrome: an American Heart Association/National Heart, Lung, and Blood Institute Scientific Statement. Circulation 112: 2735-2752. doi:10.1161/ CIRCULATIONAHA.105.169404. PubMed: 16157765.
7. Reaven GM (1993) Role of insulin resistance in human disease (syndrome X): an expanded definition. Annu Rev Med 44: 121-131. doi: 10.1146/annurev.me.44.020193.001005. PubMed: 8476236.
8. Grundy SM, Brewer HB Jr., Cleeman JI, Smith SC Jr., Lenfant C (2004) Definition of metabolic syndrome: Report of the National Heart, Lung, and Blood Institute/American Heart Association conference on scientific issues related to definition. Circulation 109: 433-438. doi: 10.1161/01.CIR.0000111245.75752.C6. PubMed: 14744958. 9. Deedwania PC (2004) Metabolic syndrome and vascular disease: is
nature or nurture leading the new epidemic of cardiovascular disease?
Circulation 109: 2-4. doi:10.1161/01.CIR.0000122867.89751.59. PubMed: 14707015.
10. Steinberger J, Daniels SR, Eckel RH, Hayman L, Lustig RH et al. (2009) Progress and challenges in metabolic syndrome in children and adolescents: a scientific statement from the American Heart Association Atherosclerosis, Hypertension, and Obesity in the Young Committee of the Council on Cardiovascular Disease in the Young; Council on Cardiovascular Nursing; and Council on Nutrition, Physical Activity, and Metabolism. Circulation 119: 628-647. doi:10.1161/ CIRCULATIONAHA.108.191394. PubMed: 19139390.
11. Hong TK, Trang NH, Dibley MJ (2012) Prevalence of metabolic syndrome and factor analysis of cardiovascular risk clustering among adolescents in Ho Chi Minh City. Vietnam - Prev Med 55: 409-411. 12. Tsai CH, Li TC, Lin CC, Tsay HS (2011) Factor analysis of modifiable
cardiovascular risk factors and prevalence of metabolic syndrome in adult Taiwanese. Endocrine 40: 256-264. doi:10.1007/ s12020-011-9466-1. PubMed: 21499818.
13. Povel CM, Beulens JW, van der Schouw YT, Dollé ME, Spijkerman AM et al. (2013) Metabolic syndrome model definitions predicting type 2 diabetes and cardiovascular disease. Diabetes Care 36: 362-368. doi: 10.2337/dc11-2546. PubMed: 22933442.
14. Stevenson JE, Wright BR, Boydstun AS (2012) The metabolic syndrome and coronary artery disease: a structural equation modeling approach suggestive of a common underlying pathophysiology. Metabolism 61: 1582-1588. doi:10.1016/j.metabol.2012.04.010. PubMed: 22626764.
15. Lempiäinen P, Mykkänen L, Pyörälä K, Laakso M, Kuusisto J (1999) Insulin resistance syndrome predicts coronary heart disease events in elderly nondiabetic men. Circulation 100: 123-128. doi:10.1161/01.CIR. 100.2.123. PubMed: 10402440.
16. Pyörälä M, Miettinen H, Halonen P, Laakso M, Pyörälä K (2000) Insulin resistance syndrome predicts the risk of coronary heart disease and stroke in healthy middle-aged men: the 22-year follow-up results of the Helsinki Policemen Study. Arterioscler Thromb Vasc Biol 20: 538-544. doi:10.1161/01.ATV.20.2.538. PubMed: 10669654.
Metabolic Syndrome and Risk Appraisal of CHD
17. Lehto S, Rönnemaa T, Pyörälä K, Laakso M (2000) Cardiovascular risk factors clustering with endogenous hyperinsulinaemia predict death from coronary heart disease in patients with Type II diabetes. Diabetologia 43: 148-155. doi:10.1007/s001250050023. PubMed: 10753035.
18. Treeprasertsuk S, Leverage S, Adams LA, Lindor KD, St Sauver J et al. (2012) The Framingham risk score and heart disease in nonalcoholic fatty liver disease. Liver Int 32: 945-950. doi:10.1111/j. 1478-3231.2011.02753.x. PubMed: 22299674.
19. Lemieux I, Lamarche B, Couillard C, Pascot A, Cantin B et al. (2001) Total cholesterol/HDL cholesterol ratio vs LDL cholesterol/HDL cholesterol ratio as indices of ischemic heart disease risk in men: the Quebec Cardiovascular Study. Arch Intern Med 161: 2685-2692. doi: 10.1001/archinte.161.22.2685. PubMed: 11732933.
20. Cui R, Iso H, Yamagishi K, Saito I, Kokubo Y et al. (2012) High serum total cholesterol levels is a risk factor of ischemic stroke for general Japanese population: the JPHC study. Atherosclerosis 221: 565-569. doi:10.1016/j.atherosclerosis.2012.01.013. PubMed: 22341595. 21. Suzuki K, Izumi M, Sakamoto T, Hayashi M (2011) Blood pressure and
total cholesterol level are critical risks especially for hemorrhagic stroke in Akita, Japan. Cerebrovasc Dis 31: 100-106. doi:10.1159/000321506. PubMed: 21079399.
22. Cui R, Iso H, Toyoshima H, Date C, Yamamoto A et al. (2007) Serum total cholesterol levels and risk of mortality from stroke and coronary heart disease in Japanese: the JACC study. Atherosclerosis 194: 415-420. doi:10.1016/j.atherosclerosis.2006.08.022. PubMed: 16970954.
23. Kwon CH, Kim BJ, Kim BS, Kang JH (2011) Low-density lipoprotein cholesterol to apolipoprotein B ratio is independently associated with metabolic syndrome in Korean men. Metabolism 60: 1136-1141. doi: 10.1016/j.metabol.2010.12.007. PubMed: 21306749.
24. Nebeck K, Gelaye B, Lemma S, Berhane Y, Bekele T et al. (2012) Hematological parameters and metabolic syndrome: findings from an occupational cohort in Ethiopia. Diabetes Metab Syndr 6: 22-27. doi: 10.1016/j.dsx.2012.05.009. PubMed: 23014250.
25. Nguyen QM, Srinivasan SR, Xu JH, Chen W, Hassig S et al. (2011) Elevated liver function enzymes are related to the development of prediabetes and type 2 diabetes in younger adults: the Bogalusa Heart Study. Diabetes Care 34: 2603-2607. doi:10.2337/dc11-0919. PubMed: 21953798.
26. Xu Y, Bi YF, Xu M, Huang Y, Lu WY et al. (2011) Cross-sectional and longitudinal association of serum alanine aminotransaminase and gamma-glutamyltransferase with metabolic syndrome in middle-aged and elderly Chinese people. J Diabetes 3: 38-47. doi:10.1111/j. 1753-0407.2010.00111.x. PubMed: 21199427.
27. Onat A, Can G, Ornek E, Cicek G, Ayhan E et al. (2012) Serum gamma-glutamyltransferase: independent predictor of risk of diabetes, hypertension, metabolic syndrome, and coronary disease. Obesity (Silver Spring) 20: 842-848. doi:10.1038/oby.2011.136.
28. Cheung BM, Ong KL, Tso AW, Cherny SS, Sham PC et al. (2011) Gamma-glutamyl transferase level predicts the development of hypertension in Hong Kong Chinese. Clin Chim Acta 412: 1326-1331. doi:10.1016/j.cca.2011.03.030. PubMed: 21466796.
29. Jimba S, Nakagami T, Oya J, Wasada T, Endo Y et al. (2009) Increase in gamma-glutamyltransferase level and development of established cardiovascular risk factors and diabetes in Japanese adults. Metab Syndr Relat Disord 7: 411-418. doi:10.1089/met.2008.0082. PubMed: 19419267.
30. Zhang Q, Zhang C, Song X, Lin H, Zhang D et al. (2012) A longitudinal cohort based association study between uric acid level and metabolic syndrome in Chinese Han urban male population. BMC Public Health 12: 419. doi:10.1186/1471-2458-12-419. PubMed: 22682157. 31. Sui X, Church TS, Meriwether RA, Lobelo F, Blair SN (2008) Uric acid
and the development of metabolic syndrome in women and men. Metabolism 57: 845-852. doi:10.1016/j.metabol.2008.01.030. PubMed: 18502269.
32. Lin YC, Chen JD, Lo SH, Chen PC (2010) Worksite health screening programs for predicting the development of Metabolic Syndrome in middle-aged employees: a five-year follow-up study. BMC Public Health 10: 747. PubMed: 21126351.
33. Liese AD, Hense HW, Löwel H, Döring A, Tietze M et al. (1999) Association of serum uric acid with all-cause and cardiovascular disease mortality and incident myocardial infarction in the MONICA Augsburg cohort. World Health Organization Monitoring Trends and Determinants in Cardiovascular Diseases. Epidemiology 10: 391-397. doi:10.1097/00001648-199907000-00009. PubMed: 10401873. 34. Lehto S, Niskanen L, Rönnemaa T, Laakso M (1998) Serum uric acid is
a strong predictor of stroke in patients with non-insulin-dependent
diabetes mellitus. Stroke 29: 635-639. doi:10.1161/01.STR.29.3.635. PubMed: 9506605.
35. Meng W, Zhang C, Zhang Q, Song X, Lin H et al. (2012) Association between Leukocyte and Metabolic Syndrome in Urban Han Chinese: A Longitudinal Cohort Study. PLOS ONE 7: e49875. doi:10.1371/ journal.pone.0049875. PubMed: 23209610.
36. Chen W, Srinivasan SR, Xu J, Berenson GS (2010) Black-white divergence in the relation of white blood cell count to metabolic syndrome in preadolescents, adolescents, and young adults: the Bogalusa Heart Study. Diabetes Care 33: 2474-2476. doi:10.2337/ dc10-0619. PubMed: 20798336.
37. Lao XQ, Neil Thomas G, Jiang C, Zhang W, Adab P et al. (2008) White blood cell count and the metabolic syndrome in older Chinese: the Guangzhou Biobank Cohort Study. Atherosclerosis 201: 418-424. doi: 10.1016/j.atherosclerosis.2007.12.053. PubMed: 18295770.
38. Odagiri K, Uehara A, Mizuta I, Yamamoto M, Kurata C (2011) Longitudinal study on white blood cell count and the incidence of metabolic syndrome. Intern Med 50: 2491-2498. doi:10.2169/ internalmedicine.50.5877. PubMed: 22041347.
39. Lee CD, Folsom AR, Nieto FJ, Chambless LE, Shahar E et al. (2001) White blood cell count and incidence of coronary heart disease and ischemic stroke and mortality from cardiovascular disease in African-American and White men and women: atherosclerosis risk in communities study. Am J Epidemiol 154: 758-764. doi:10.1093/aje/ 154.8.758. PubMed: 11590089.
40. Onat A, Can G, Ademoğlu E, Çelik E, Karagöz A et al. (2013) Coronary disease risk curve of serum creatinine is linear in Turkish men, u-shaped in women. J Investig Med 61: 27-33. PubMed: 23160183. 41. Rose GA, Blackburn H (1968) Cardiovascular survey methods. Monogr
Ser World Health Organ 56: 1-188. PubMed: 4972212.
42. Edwards KL, Austin MA, Newman B, Mayer E, Krauss RM et al. (1994) Multivariate analysis of the insulin resistance syndrome in women. Arterioscler Thromb 14: 1940-1945. doi:10.1161/01.ATV.14.12.1940. PubMed: 7981183.
43. Goodman E, Dolan LM, Morrison JA, Daniels SR (2005) Factor analysis of clustered cardiovascular risks in adolescence: obesity is the predominant correlate of risk among youth. Circulation 111: 1970-1977. doi:10.1161/01.CIR.0000161957.34198.2B. PubMed: 15837951. 44. Normann J, Mueller M, Biener M, Vafaie M, Katus HA, et al. (2012)
Effect of older age on diagnostic and prognostic performance of high-sensitivity troponin T in patients presenting to an emergency department. Am Heart J 164: 698-705 e694
45. Hamaguchi M, Takeda N, Kojima T, Ohbora A, Kato T et al. (2012) Identification of individuals with non-alcoholic fatty liver disease by the diagnostic criteria for the metabolic syndrome. World J Gastroenterol 18: 1508-1516. doi:10.3748/wjg.v18.i13.1508. PubMed: 22509083. 46. Treeprasertsuk S, Lopez-Jimenez F, Lindor KD (2011) Nonalcoholic
fatty liver disease and the coronary artery disease. Dig Dis Sci 56: 35-45. doi:10.1007/s10620-010-1241-2. PubMed: 20464495. 47. Borges RL, Ribeiro AB, Zanella MT, Batista MC (2010) Uric Acid as a
Factor in the Metabolic Syndrome. Curr Hypertens Rep 12: 113-119. doi:10.1007/s11906-010-0098-2. PubMed: 20424936.
48. Gaziano TA, Young CR, Fitzmaurice G, Atwood S, Gaziano JM (2008) Laboratory-based versus non-laboratory-based method for assessment of cardiovascular disease risk: the NHANES I Follow-up Study cohort. Lancet 371: 923-931. doi:10.1016/S0140-6736(08)60418-3. PubMed: 18342687.
49. Wilson PW, D'Agostino RB, Levy D, Belanger AM, Silbershatz H et al. (1998) Prediction of coronary heart disease using risk factor categories. Circulation 97: 1837-1847. doi:10.1161/01.CIR.97.18.1837. PubMed: 9603539.
50. Assmann G, Cullen P, Schulte H (2002) Simple scoring scheme for calculating the risk of acute coronary events based on the 10-year follow-up of the prospective cardiovascular Munster (PROCAM) study. Circulation 105: 310-315. doi:10.1161/hc0302.102575. PubMed: 11804985.
51. Conroy RM, Pyörälä K, Fitzgerald AP, Sans S, Menotti A et al. (2003) Estimation of ten-year risk of fatal cardiovascular disease in Europe: the SCORE project. Eur Heart J 24: 987-1003. doi:10.1016/ S0195-668X(03)00114-3. PubMed: 12788299.
52. Ferrario M, Chiodini P, Chambless LE, Cesana G, Vanuzzo D et al. (2005) Prediction of coronary events in a low incidence population. Assessing accuracy of the CUORE Cohort Study prediction equation. Int J Epidemiol 34: 413-421. doi:10.1093/ije/dyh405. PubMed: 15659467.
Cohort Study. JAMA 291: 2591-2599. doi:10.1001/jama.291.21.2591. PubMed: 15173150.
54. Wu Y, Liu X, Li X, Li Y, Zhao L et al. (2006) Estimation of 10-year risk of fatal and nonfatal ischemic cardiovascular diseases in Chinese
adults. Circulation 114: 2217-2225. doi:10.1161/CIRCULATIONAHA. 105.607499. PubMed: 17088464.
55. Elkind MS, Ramakrishnan P, Moon YP, Boden-Albala B, Liu KM et al. (2010) Infectious burden and risk of stroke: the northern Manhattan study. Arch Neurol 67: 33-38. doi:10.1001/archneurol.2009.271. PubMed: 19901154.
Metabolic Syndrome and Risk Appraisal of CHD