Combined CUTLASS, EISCAT and ESR observations
of ionospheric plasma ¯ows at the onset of an isolated substorm
T. K. Yeoman, J. A. Davies, N. M. Wade, G. Provan, S. E. Milan
Department of Physics and Astronomy, University of Leicester, University Road, Leicester, LE1 7RH, UK
Received: 24 January 2000 / Revised 12 May 2000 / Accepted: 16 May 2000
Abstract. On August 21st 1998, a sharp southward turning of the IMF, following on from a 20 h period of northward directed magnetic ®eld, resulted in an isolat-ed substorm over northern Scandinavia and Svalbard. A combination of high time resolution and large spatial scale measurements from an array of coherent scatter and incoherent scatter ionospheric radars, ground magnetometers and the Polar UVI imager has allowed the electrodynamics of the impulsive substorm electrojet region during its ®rst few minutes of evolution at the expansion phase onset to be studied in great detail. At the expansion phase onset the substorm onset region is characterised by a strong enhancement of the electron temperature and UV aurora. This poleward expanding auroral structure moves initially at 0.9 km s)1poleward,
®nally reaching a latitude of 72.5°. The optical signature expands rapidly westwards at 6 km s)1, whilst the
eastward edge also expands eastward at 0.6 km s)1.
Typical ¯ows of 600 m s)1 and conductances of 2 S
were measured before the auroral activation, which rapidly changed to100 m s)1and 10±20 S respectively
at activation. The initial ¯ow response to the substorm expansion phase onset is a ¯ow suppression, observed up to some 300 km poleward of the initial region of auroral luminosity, imposed over a time scale of less than 10 s. The high conductivity region of the electrojet acts as an obstacle to the ¯ow, resulting in a region of low-electric ®eld, but also low conductivity poleward of the high-conductivity region. Rapid ¯ows are observed at the edge of the high-conductivity region, and subse-quently the high ¯ow region develops, ¯owing around the expanding auroral feature in a direction determined by the ¯ow pattern prevailing before the substorm intensi®cation. The enhanced electron temperatures associated with the substorm-disturbed region extended some 2°further poleward than the UV auroral signature associated with it.
Key words: Ionosphere (auroral ionosphere) ± Magnetospheric physics (magnetosphere ± ionosphere interactions; storms and substorms)
1 Introduction
The ionospheric electrojets during the substorm expan-sion phase are known to have a highly time-dependent electric ®eld and conductivity structure, as a conse-quence of the ®elds and particle precipitation imposed on the nightside ionosphere by the Earth's magnetotail. These ionospheric electric ®eld and conductivity changes combine to produce the characteristic ground magnetic perturbations during the substorm expansion phase. VHF coherent scatter radars were ®rst used to study the spatial structure of the substorm electric ®elds (Baum-johann et al., 1981; Inhester et al., 1981; Opgenoorth
et al., 1983) and suggested a region of low-electric ®eld within the dynamic structure of the substorm electrojets. Incoherent scatter radars also oer an excellent tech-nique for the study of both the ionospheric ¯ow velocities and ionospheric particle precipitation during the substorm expansion phase. EISCAT has provided detailed information on the growth and onset of the substorm (e.g. Perssonet al., 1994), the conductivity and structure of the westward travelling surge (WTS, Opgenoorthet al., 1989; Olssonet al., 1996), and other dynamic features in the expansion phase (LuÈhr et al., 1998). The extensive ®elds-of-view of high frequency (HF) coherent scatter ionospheric radars make them excellent complementary instruments for the investiga-tion of the larger-scale spatial and temporal develop-ment of the ionospheric electric ®elds (e.g. Morelliet al., 1995; Shand et al., 1998; Lewis et al., 1997). This is especially true for the SuperDARN network, which oers an extensive network of such radars in the Northern and Southern Hemispheres. During the sub-storm expansion phase, such HF coherent radars have observed dynamic convection features, which
correspond to azimuthally propagating ®eld aligned current systems, which may be related to reconnection and bursty bulk ¯ows in the magnetotail (Yeoman and LuÈhr, 1997; Yeoman et al., 1998). Localised electrojet features in which ionospheric ¯ows were suppressed to values as low as 50 m s)1and accelerated up to values as
high as 1 km s)1 within a few minutes have also been
observed at the western edge of the substorm-disturbed electrojet, accompanied by conductance variations between 20 and 100 S (Morelli et al., 1995). Here the capabilities of coherent scatter radars (CUTLASS) and incoherent scatter radars (EISCAT and the EISCAT Svalbard radar, the ESR) are combined to provide a detailed study of the electrodynamics of the ®rst few minutes of evolution of the eastern edge of the substorm-disturbed electrojet region at the expansion phase onset.
2 Instrumentation
The ionospheric convection velocities in this study are provided by a combination of four ionospheric radar systems, the CUTLASS-Hankasalmi (Finland) and CUTLASS-³ykkvibñr (Iceland) radars of the Super-DARN chain of coherent scatter HF radars (Greenwald
et al., 1995), the EISCAT VHF radar at Tromsù (e.g. Rishbeth and Williams, 1985) and the EISCAT Sval-bard radar (ESR), located at Longyearbyen (e.g. Wannberg et al., 1997). The ®elds-of-view of these systems during the interval under study are illustrated in Fig. 1.
The SuperDARN radars form 16 beams of separa-tion 3.24°. Each beam is gated into 75 range bins, each of length 45 km in standard operations. During stan-dard operations the dwell time for each beam is 7 s, giving a full 16 beam scan, covering 52°in azimuth and
over 3000 km in range (an area of over 4 ´106km2),
every 2 min. For the interval presented here both radars were operating in a non-standard scan mode. The integration time for each beam was reduced to 2 s. This reduced integration time raises the radar data signal-to-noise ratio slightly. The data presented are thresholded as normal at 0 dB, thus the reduced integration period reduces the data coverage, as low returned powers will be lost. In the auroral region, where powerful HF scatter is commonly observed, this has little overall aect on the data coverage. In addition to reduced integration periods, in the scan employed here, rather than the usual anticlockwise (clockwise) sweep through beams 15;14;13;. . .;0 0;1;2;. . .;15 the Hankasalmi (³ykkvibñr) radar scanned through the sequence 15;9; 14;9;13;9;. . .;1;9;0;9 0;10;1;10;2;10;. . .;14;10;15. This allows the construction of full 16 beam scans at an enhanced temporal resolution of 64 s, in addition to the provision of very high-time resolution (4 s) data along a single look direction for each radar (in this case beam 9 for Hankasalmi, a beam which approximately overlies the main meridional chain of the IMAGE array, and beam 10 for³ykkvibñr).
During the interval of interest, the two EISCAT radar systems were running the UK special programme
SP-UK-CSUB. This programme was run over four four-hour intervals commencing at 21 UT on 20, 21, 22 and 23 August 1998. The ESR was, during SP-UK-CSUB, directed southward, with a geographic azimuth of 161.6°
and an elevation of 31.0°. This pointing direction allows the ESR beam to be aligned in azimuth along beam 9 of the Hankasalmi radar ®eld-of-view. The ESR was transmitting the GUP0 radar code, a multi-frequency long pulse. Received signals were integrated over 10 s and the data subsequently analysed at a temporal resolution of 60 s. Analysis of ESR data is such that the user can vary the range resolution, in this case with gating of 12 km below a range of 330 km, which
corresponds to an altitude of around 175 km, and 36 km range gates above 330 km; ESR observations span the altitude range from 110 to 500 km.
In SP-UK-CSUB, the EISCAT VHF radar operated in a split beam mode with one beam (beam 2) directed along the boresight which corresponds to a geographic azimuth of 359.5°and the other (beam 1) phased 14.5°
west to an azimuth of 345.0°; both beams are at a elevation of 30°. In SP-UK-CSUB, which is identical to the VHF common programme CP-4, long pulse and power pro®le codes are transmitted. The long pulse provides observations, on each beam, over 20 gates of range resolution 65.3 km with the ®rst gate centred at a range of 533.0 km; this corresponds to an altitude coverage from around 280 km to over 1000 km. The power pro®le pulse scheme yields returned power measurements at a range resolution of 4.5 km over 83 gates the ®rst of which corresponds to an height of some 85 km. Like those from Svalbard, VHF observations were analysed at 1 min temporal resolution. Beam 1 of the VHF radar is aligned in azimuth along beam 7 of the Hankasalmi radar whereas beam 2 crosses beams 8, 9 and 10 of the Hankasalmi radar.
Standard analysis of the long pulse signal from both the Svalbard and VHF radars provide estimates along each beam of both ion and electron temperature, electron density and ion velocity. Moreover, estimates of the Hall and Pedersen conductance can be derived from the VHF power pro®le measurements with the incorporation of appropriate input from the MSIS-90 thermospheric model and the IGRF model of the geomagnetic ®eld.
Data from the far ultraviolet imager (UVI) instru-ment carried by thePolarspacecraft (Torret al., 1995) is also examined. This instrument measures auroral emis-sion in the Lyman-Birge-Hop®eld system of bands, the result of electron impact excitation of N2, with two
®lters, LBHl and LBHs, which are centred on 1700 AÊ and 1500 AÊ, respectively. The auroral features under study appear in both the LBHl and LBHs observations, though are perhaps clearer in LBHs and hence it is these images which will be presented. An image is acquired every 3 min, with an integration period of 37 s.
This data set is supplemented here by data from ground-based ¯uxgate magnetometers, provided by stations from the International Monitor for Auroral Geomagnetic Eects, IMAGE) (LuÈhr, 1994). The IM-AGE array has 10 s sampling for the interval under consideration here. The IMAGE data is presented inX,
Y, Z co-ordinates, where X is geographic northwards,
Ygeographic eastwards andZis vertically downwards.
3 Observations
3.1 Wind
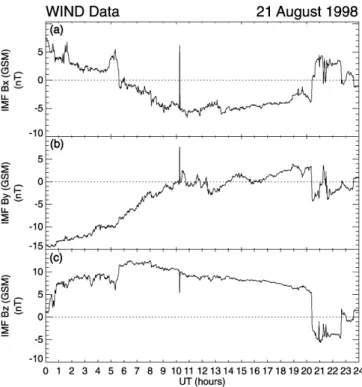
Magnetic ®eld data (Leppinget al., 1995) from theWind
spacecraft upstream in the solar wind are presented in Fig. 2.Windwas at coordinates 80,)33,)5RE(X,Y,Z
GSE) at the time of interest. The observed solar wind
velocity of300 km s)1suggests that a delay from the
spacecraft to the subsolar magnetopause of 33 min is appropriate. Prior to 2025 UT on August 21, 1998, the IMF had been northward for 20 h. The IMF By
component was positive for 4 h prior to 2025 UT. At 2025 UT (2058 UT at the magnetopause) both theBy
and Bzcomponents abruptly switched polarity, turning negative. The IMF remained in this con®guration until 2238 UT, (2311 UT at the magnetopause) when the IMFBz component became close to zero, although the IMF By component did have a brief excursion to positive values at 2118 UT. Assuming a further 2 min delay for the eect of the IMF southward turning to reach the ionospheric footprint of the subsolar mag-netopause, and 15 min for the subsequent recon®gura-tion of the ionospheric convecrecon®gura-tion pattern to expand to the nightside (Cowley and Lockwood, 1992), the eects of the southward turning would be expected to reach the nightside ionosphere at2115 UT. Some time after this, at 2140 UT, measurements of the equatorward bound-ary of the Hankasalmi HF radar backscatter are ®rst available (prior to this the data is masked by ground scatter), and can be seen to be migrating equatorward at this time. This is a phenomenon previously associated with the substorm growth phase (Lewis et al., 1997), and is discussed further in Sect. 4.
3.2 Ground magnetometer data
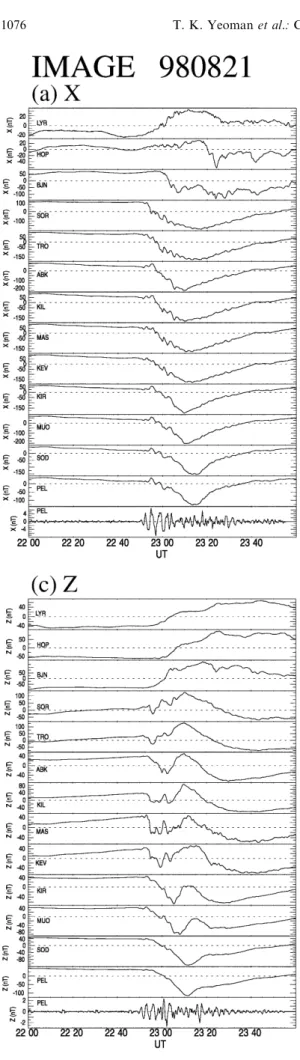
X, Y and Z component magnetic ®eld data from the IMAGE array between 2000±2400 UT on the 21st August, 1998 is presented in Fig. 3. Magnetically quiet
conditions apply up to 2250 UT, when a clear mid-latitude Pi2 pulsation, indicating the substorm expan-sion phase onset, is observed, with a further Pi2 burst at 2305 UT. The onset of the ®rst Pi2 burst coincides with a strong negative bay (up to 300 nT) in theXcomponent auroral magnetograms, indicating a substorm-enhanced westward electrojet. The onset of this magnetic distur-bance in the X component can be seen to propagate poleward, reaching BJN at 2258 UT and HOP at 2318 UT. In the mainland Scandinavian magnetometer stations theZcomponent magnetograms similarly show a negative disturbance at 2250 UT. Poleward, this Z
component response is positive, only deviating negative when the westward electrojet signature has propagated poleward, as outlined already. After 2250 UT, at lower latitudes, complex Z component disturbances are ob-served until 2310 UT, when the substorm electrojet is clearly centered north of the mainland magnetometer stations. In the Y component, two large positive excursions are observed, centred at 2300 and 2308 UT. Such features are usually associated with auroral loop and surge features (see relevant parts of Sect. 4, Untiedt and Baumjohann, 1993 and references therein), and in this case an eastward motion may be calculated from the azimuthally separated stations KIL, MAS and KEV, to be 0.6 km s)1. It is the electrodynamics of
these two surge features which are the focus of the present study.
3.3 EISCAT, ESR and Hankasalmi data
Data from the ESR radar is presented in Fig. 4. The four panels present electron density, electron tempera-ture, ion temperature and line-of-sight ion velocity data from the radar, as a function of geomagnetic latitude and time (Altitude Adjusted Corrected Geomagnetic coordinates, AACGM, based on Baker and Wing, 1989, are used throughout this study). Line-of-sight velocity data from the ESR is colour-coded with blue represent-ing ¯ow away from the radar (equatorward ¯ow) and red ¯ow toward the radar (poleward ¯ow). In subse-quent plots data from the Hankasalmi radar are colour-coded with blue representing ¯ow toward the radar (equatorward ¯ow) and red ¯ow away from the radar (poleward ¯ow). This colour scheme is chosen to give consistent colour coding in plots of data from both radar systems. The ESR beam has an elevation of 31°, so the panels in Fig. 4 cover 750±350 km altitude.
Before 2250 the ionosphere is relatively undisturbed, with a pair of equatorward drifting arcs, most easily distinguished as enhancements in the electron and ion temperature data, propagating away from the radar between 2120 and 2220 UT. Such features are charac-teristic of the substorm growth phase (Persson et al., 1994). At 2250, the time of the substorm onset, there is no immediate response apparent in the ESR data, with very low line-of-sight velocities being measured. How-ever, at 2300 UT, a sudden increase in the negative (equatorward) line-of-sight velocity is observed below 70° latitude, accompanied by a short-lived burst of
greatly enhanced ion temperatures, as expected for intervals of large electric ®eld, and elevated electron temperatures, indicative of enhanced particle precipita-tion. This region of enhanced ¯ow and precipitation expands poleward at 0.9 km s)1 initially, slowing to
0.6 km s)1 by 71.5° latitude. This poleward-expanding
auroral feature ®nally reaches a latitude of 72.5°, and is visible in both the beams of the EISCAT VHF radar (not shown) as well as in the ESR data. The poleward-expanding auroral feature results in a depletion of the F-region electron density (Fig. 4a). Such density deple-tions are frequently observed in conjunction with ion frictional heating (e.g. Williams and Jain, 1986; Davies
et al., 1995). The reduction in the F-region electron density is generally ascribed to a combination of two factors, increased plasma recombination and enhanced ®eld-aligned ¯ows. During the subsequent hour of the expansion phase there are a number of shortlived bursts of poleward ¯ow, before the convection in general turns poleward.
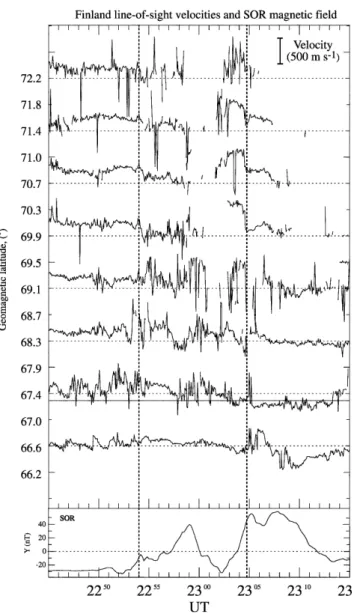
The relationship between the precipitation regions and the region of enhanced ¯ow velocities is examined in more detail in Fig. 5, which presents the electron temperature and ion velocity from the ESR, together with high-time resolution velocity data from the Han-kasalmi radar, measured at the same azimuth and latitude range, between 2230 and 2330 UT. The poleward expansion of the region of electron temper-ature and enhanced equatorward velocities after 2300 UT are remarkably similar. Before this a sudden change in the equatorward ¯ow velocity at 2254 UT is observed, most clearly in the high-time resolution data from Hankasalmi. This velocity drop is observed essentially simultaneously at latitudes below 72° some
6 min before the poleward expanding region of en-hanced precipitation moves into the ESR ®eld of view. The region of low velocity is followed by an interval of data loss from the Hankasalmi radar, possibly due to a loss of ionospheric irregularities in the very low electric ®eld region (Milanet al., 1999). The increasing strength of the equatorward ¯ows at 2300 UT see the Hanka-salmi data returning, and a further sudden velocity decrease is observed at 2305 UT. This velocity decrease is also visible in the ESR data. Subsequent to this feature an extended data gap appears in the Hanka-salmi data, probably as a result of changing HF propagation conditions.
equator-ward ¯ow decreases, whereas at the lowest latitudes there is some evidence for an increase in the equator-ward ¯ow. The transition region between these regimes is at 68.3°±69.1° geomagnetic latitude. These sharp changes in ionospheric ¯ow velocity occur near the beginnings of the intervals of positive Y component magnetic disturbances measured at SOR.
Additional information on the ionospheric ¯ows and particle precipitation during this interval may be obtained from the EISCAT VHF radar system. Figure 7 presents velocity measurements obtained from a beam-swinging analysis of the line of sight ion velocity data from the two VHF beams illustrated in Fig. 1. In the
beam-swinging process the data from the two beams of the EISCAT VHF radar are actually measured simul-taneously, and the line-of-sight velocities in the two look directions from a given geomagnetic latitude are combined together under the assumption of spatial uniformity between the appropriate range cells. These beam-swung velocities are overlaid on colour-coded Hankasalmi line-of-sight velocities from beam 7, which is close to the VHF beam locations. The beam-swung velocity measurements show a predominantly equator-ward velocity orientation, and the intervals of ¯ow suppression at 2254 and 2305 UT are clearly visible. Where the EISCAT VHF beams are at an appropriate
Fig. 4a±d. A latitude-time-pa-rameter representation of data from the ESR, 2100 on the 21st August to 0100 on the 22nd August, 1998.aElectron density,
altitude, they can also give an estimate of the iono-spheric conductivities. Inspection of the radar power pro®les (not shown) reveals the measured conductivities to be dominated by the ionosphere at 68.0±68.5°
latitude, where the radar beam passes through the E region ionosphere, due to the VHF beam elevation of 30°. The interval after the substorm expansion phase
onset is clearly characterised by enhanced Hall conduc-tance, particularly at the times of velocity reduction noted at higher latitudes in Fig. 5, at 2254 UT, and subsequently after 2305 UT. At 2254 UT the Hall conductivity increases rapidly from3 S to 12 S, whilst the Pedersen conductivity increased from1 to 5 S.
3.4 SuperDARN convection maps and Polar UVI
The detailed measurements of the ionospheric ¯ow velocities and particle precipitation regions provided by the EISCAT, ESR and Hankasalmi beam 9 observa-tions in Sect. 3.3 may be put into context by two-dimensional observations of ionospheric ¯ows and auroral intensity from the CUTLASS pair of Super-DARN radars and the Polar UVI instrument, respec-tively. Figure 8 presents a magnetic local time (MLT) ± magnetic latitude representation of data from both these instruments for two intervals during the substorm expansion phase onset. These times are chosen to
coincide withPolarimages. Figure 8a showsPolarUVI auroral intensity data for scans beginning 2253:53 and 2303:05 UT. A number of estimates of the horizontal ¯ow vector, calculated using a beam-swinging algorithm where the ¯ow component parallel to the L-shell is assumed constant across the scan (Villain et al., 1987; Ruohoniemi et al., 1989) are overlaid. These velocity vectors are derived from beam-swinging constrained by measurements from both the ³ykkvibñr and Hanka-salmi radars (the line-of-sight data from which is shown in Fig. 8b and c respectively). Ideally bistatic velocity vectors would be used to examine the two-dimensional ionospheric ¯ow patterns, but such data are scarce from HF radars during substorms. To present the clearest
picture we therefore present full scans of line-of-sight velocities, in addition to beam-swung vectors, and also use the potential map technique, as described later. These approaches produce largely consistent results. The ®rst column of Fig. 8, at close to 2254 UT, shows the time when the substorm expansion phase onset initially suppressed the ionospheric ¯ow. The auroral intensity can be seen to start as a small intense region at about 68° latitude and 0030±0200 MLT. At this time, low ionospheric ¯ows are observed, with equatorward ¯ow dominant. A westward ¯ow component exists at higher latitudes and an eastward component at lower latitudes. The second column of Fig. 8 presents data from 2303 UT, when the ¯ow magnitudes have increased during the substorm expansion phase. The auroral observations can be seen to have expanded rapidly westwards. The ionospheric ¯ows have strength-ened considerably. A predominantly eastward compo-nent is now observed, with equatorward ¯ow in the west and poleward ¯ow in the east. These regions of rapid ¯ow encircle the equatorward edge of a region of low ¯ow in the centre of the Hankasalmi ®eld of view.
An alternative technique for the visualisation of the ionospheric convection patterns during the interval is presented in Fig. 9. Here the spherical harmonic poten-tial ®tting or ``potenpoten-tial map'' technique (Ruohoniemi and Baker, 1998) has been applied to calculate the potential pattern which is most consistent with the line-of-sight velocities determined by the Hankasalmi and
³ykkvibñr radars. In Fig. 9 three 64 s intervals are presented in MLT-geomagnetic latitude coordinates for latitudes ranging from 60°to 80°and local times from 21 to 03 MLT. Contours of electric equipotentials are displayed, with solid (dashed) lines indicating negative (positive) potentials. Ionospheric ¯ow vectors are also displayed. These are deduced from the combination of the measured line-of-sight velocities and beam-perpen-dicular ¯ows derived from the calculated ionospheric potential pattern. In these maps the electric potential is expanded to order 8, with the lower latitude limit of the convection pattern ®xed to 60°. No temporal median ®ltering has been applied. The potential pattern calcu-lation is stabilised by the statistical model of Ruohon-iemi and Greenwald (1996) for the prevailing IMF conditions measured by Wind, with a time delay of 50 min. In fact the calculated equipotential pattern is insensitive to the exact upstream conditions assumed.
Figure 9a presents the convection pattern from 2251:04±2252:08 UT, just before substorm expansion phase onset. A typical, fairly symmetrical two-cell convection pattern can be observed. Figure 9b, shows data from 2255:20±2256:24 UT, a little later than Fig. 8a, and at a time when the suppression of ionospheric electric ®eld has fully developed, and hence the reduced ¯ow magnitudes are clearly illustrated by a ``pushing apart'' of the equipotential contours just after local midnight. Figure 9c (2303:52±2304:56 UT) shows a strengthening ionospheric electric ®eld with the pattern of ¯ow deduced from Fig. 8c pushing eastwards into the dawn convection cell.
Fig. 6. Line-of-sight velocities from beam 9 of the Hankasalmi radar, 2245±2315 UT, on the 21st August, 1998. For clarity, data from every other range cell are displayed. Positive velocities represent ¯ow toward the radar (equatorward ¯ow). Thelower panelshows theY
component magnetic ®eld data from SOR for comparison. The latitude of SOR is marked in theupper panelby ahorizontal solid line. Impulsive changes in the ionospheric convection are indicated with
4 Discussion
This interval presented here provides some uniquely well instrumented observations of a ``classical'' isolated substorm. Prior to a sharp southward turning of the IMF, a 20 h interval of northward IMF had prevailed, and such a situation should remove many of the complexities introduced by ¯uctuating dayside condi-tions and multiple substorm onsets.
At 2025 UT both the Byand Bz components of the
IMF measured at Wind abruptly switched polarity, turning negative. Allowing for the propagation of this IMF rotation through the solar wind, magnetosheath and magnetosphere leads to an expected commencement of the substorm growth phase at 2115 UT. Up to 2140, ground scatter obscures the lower latitude data from the SuperDARN Finland radar. From this time on, how-ever, the equatorward edge of the scatter can be seen to progress steadily equatorward. This is a classic signature of the substorm growth phase in HF radar data (Lewis
et al., 1997), at least for isolated substorms.
A pair of auroral arcs, most easily distinguished as enhancements in the electron and ion temperature data in the ESR data in Fig. 4, are observed to propagate equatorward away from the radar at 200±400 m s)1,
between 2120 and 2220 UT. These drift speeds are consistent with the background ionospheric ¯ow veloc-ity, although the peak ¯ow in the vicinity of the arcs is 1.2 km s)1. Such features are also characteristic of the
substorm growth phase (Persson et al., 1994). Thus we can conclude that the substorm growth phase com-menced close to 2115 UT, and had a duration of 1 h 35 min, with the ®rst signs of the substorm expansion phase onset occurring at 2250 UT, as manifested by a
Pi2 pulsation and a clear, poleward expanding auroral disturbance (Fig. 3).
Shortly after the Pi2 pulsation, the ESR detected a poleward-expanding region of enhanced electron tem-perature, which is expected to accompany an auroral form (such incoherent scatter radar observations of poleward expanding substorm aurora are relatively rare (LuÈhr et al., 1998)), and Polar UVI also detects a co-located poleward-expanding optical aurora. The loca-tion of the initial disturbance is at 65° geomagnetic latitude (Fig. 8a) and thus would map to a location in the near-Earth magnetotail as suggested by e.g. Samson
et al.(1992), Samson (1994), and Yeomanet al.(1994). The poleward expanding auroral structure moves ini-tially at 0.9 km s)1poleward, slowing to 0.6 km s)1by
71.5°latitude. This poleward-expanding auroral feature ®nally reaches a latitude of 72.5°. This propagation is
consistent with the magnetic signatures observed on the IMAGE magnetometer array. The ionospheric convec-tion and height integrated conductivity in the vicinity of the expanding substorm region exhibit a number of characteristic features. Typical ¯ows of 600 m s)1 and
conductances of 2 S before the auroral activation give way to values of 100 m s)1 and 10±20 S respectively.
These values are consistent with previous measurements with EISCAT and with HF radars, which have suggested that typical values of ¯ow and conductance within the substorm-disturbed electrojet are 50±200 m s)1and 20±
100 S (Morelliet al., 1995; Olssonet al., 1996; Yeoman and LuÈhr, 1997; LuÈhr et al., 1998). Previous measure-ments have employed either incoherent or coherent scatter radars, and have had a temporal resolution of no better than 1 min. Here the two techniques are available together, and a temporal resolution of 4 s is available
from beam 9 of the Hankasalmi radar. This combination of instruments reveals that at the moment of onset of the impulsive electrojet region, the equatorward ¯ow is very rapidly suppressed, over a time scale of 10 s (most clearly illustrated in Fig. 6). Furthermore, the ¯ow suppression is nearly simultaneous over a region of several hundred kilometres, and extends 3°poleward of
the substorm disturbance as de®ned by the auroral and electron temperature data. The poleward expanding region of aurora and elevated electron temperatures itself is characterised by stronger equatorward line-of-sight velocity, and ion temperature enhancements, indi-cating an extended region of enhanced precipitation and dynamic electric ®elds. The most intense ion temperature enhancements are con®ned to the edge of the poleward expanding structure. The broad region of ¯ow suppres-sion poleward of, and the enhanced ¯ows around the edge of, the substorm-disturbed region are consistent with the disruption and subsequent de¯ection of the ¯ow around the boundary of the substorm-disturbed region, as observed by Fox et al.(2000). The enhanced precip-itation implied by the elevated electron temperatures results in a fourfold increase in the Hall conductance at 68°±68.5° latitude. The conductivity reaches a peak in association with both impulsive changes in the substorm onset region. The region of suppressed electric ®eld is not, however, con®ned to the region of high conductiv-ity. The high-conductivity region forms an obstacle to the ¯ow, thus creating a region of low-electric ®eld and low conductivity poleward of the main substorm dis-turbed electrojet. This combination of low conductivity and low-electric ®eld results in the modest magnetic ®eld disturbances observed poleward of the main substorm electrojet by BJN at 2254 in Fig. 3.
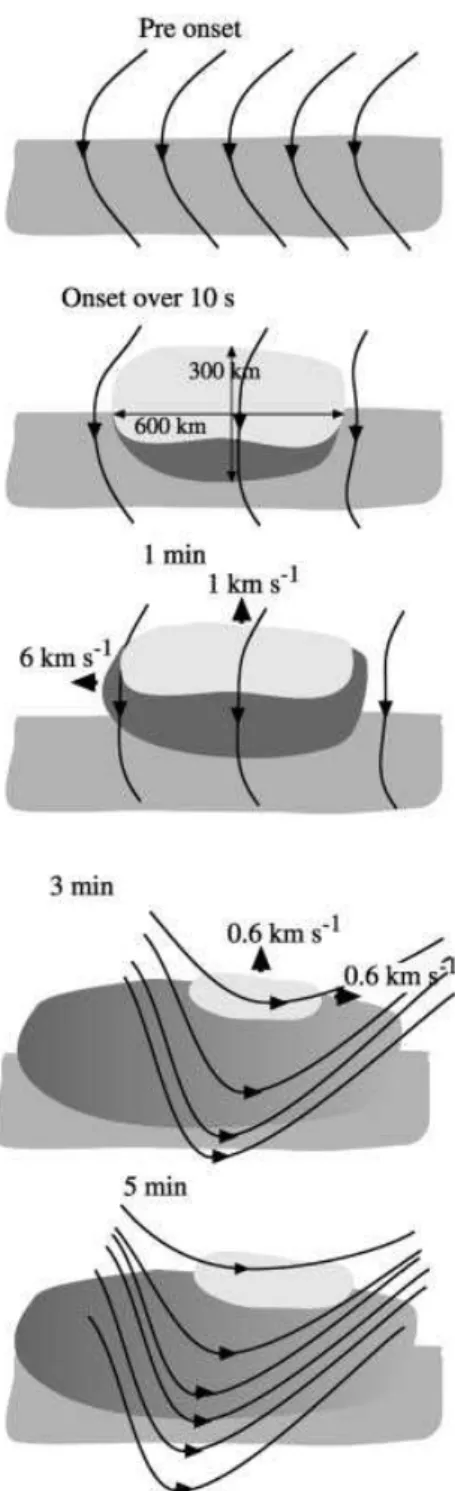
The two-dimensional ionospheric convection mea-surements available from the SuperDARN radars at Hankasalmi and³ykkvibñr allow a picture to be built of the eects of these dynamic ¯ow changes on the larger scale nightside convection pattern. This sequence of dynamic ¯ow observations is illustrated schematically in Fig. 10. Before the substorm onset ¯ow is predominant-ly equatorward. Figures 8 and 9 demonstrate that the dominant eect on the large-scale convection at the moment of substorm onset is the stagnation of ¯ow caused by the highly conducting substorm-disturbed region. This coincides with the commencement of the
enhanced auroral intensity over a smaller area, and occurs over an area of 300 km in latitude and 600 km longitude over a time scale of less than 10 s. Two similar instances of ¯ow suppression are observed at 2254 and 2305 UT. Subsequently, over a time scale of a few minutes, ¯ow magnitudes increase as the ¯ows are diverted around the expanding obstacle. At this time the auroral observations can be seen to have expanded rapidly westwards, whilst the ionospheric ¯ows have strengthened considerably. A predominantly eastward ¯ow component is now observed, with equatorward ¯ow in the west and poleward ¯ow in the east. These regions of rapid ¯ow encircle the equatorward edge of a region of low ¯ow in the centre of the Hankasalmi ®eld-of-view. The ¯ow direction around the region of low ¯ow is likely to be determined by the background ¯ow direction prior to the substorm activity, as suggested by Morelliet al. (1995).
Fig. 8a±c. Magnetic local time±Magnetic latitude representation of CUTLASS velocity andPolarUVI auroral data.aPolarUVI auroral intensity data for scans beginning 2253:53 UT and 2303:05 UT. Velocity vectors derived from a beam-swinging technique using both the ³ykkvibñr and Hankasalmi radars (scans shown in b and c
respectively) are overlaid (see text for details). b Line-of-sight velocities from the ³ykkvibñr radar, colour coded with positive velocitiesblue(toward the radar) and negative velocities red(away from the radar), for scans beginning 2253:52 UT and 2303:05 UT.c
Line-of-sight velocities from the Hankasalmi radar,colour codedwith positive velocitiesblue(toward the radar) and negative velocitiesred
(away from the radar), for scans beginning 2253:34 UT and 2303:01 UT. The beam-swung velocity vectors fromaare superimposed. The location of the SOR magnetometer is marked with adotin each panel b
The impulsive changes in the ionospheric electric ®eld occur at the beginnings of the intervals of positive Y
component disturbance in the ground magnetic ®eld (Fig. 6). The existence of aYcomponent magnetic ®eld perturbation implies a signi®cant north±south current ¯ow in addition to the westward electrojet at the
eastward edge of the substorm onset region. The positive Y component disturbance implies an equator-ward current, and thus presumably corresponds to the relative increase in equatorward current caused by the reduction in equatorward ¯ow measured by the radars. Some positiveYcomponent de¯ection occurs before the ¯ow suppression at 2305 UT, and may be the signature of the highly dynamic ¯ows which occur between the two ¯ow suppressions. These north-south current sys-tems are transient in nature, and represent substructure within the main substorm current wedge currents. The highly structured ionospheric electric and ground mag-netic ®elds seen here are consistent with the observations of Nakamuraet al.(1993), who demonstrated that there were highly structured aurora expanding eastward at the eastern end of the substorm auroral bulge. The existence of considerable north-south currents in this region also demonstrates that there may be larger total currents currents ¯owing than would be predicted by a simple east-west electrojet model, as suggested by Kamide (1996). Such observations, in addition to being impor-tant elements of the ionospheric signature of substorm onset, may provide useful input to future modelling of the substorm process which includes magnetospheric and ionospheric eects (e.g. Kan, 1998).
The poleward expanding electron temperature fea-ture described is essentially the radar signafea-ture of the poleward-expanding substorm bulge. It is interesting to compare the poleward motion and extent of this signature with that observed by the Polar UVI instru-ment. Figure 11 presents a latitude-time-parameter rep-resentation of data from Hankasalmi, Polar UVI and the ESR, between 2230 and 2330 UT between 63° and 76° magnetic latitude. Figure 11a illustrates the
equa-torward migration of the HF radar scatter in the growth phase of the substorm, between 2230 and 2250, as discussed earlier in this section and in Sect. 3.1. Flow suppression, and subsequent dynamic ¯ows can be seen after this during the expansion phase. The initial onset of auroral luminosity observed byPolar at 2253 UT in Fig. 11b can be seen to coincide, within the time resolution of the UVI instrument, to the rapid stagna-tion of ¯ow observed by Hankasalmi between 69° and 72°(Fig. 11a). Both the UVI data and the ESR electron
temperature data subsequently expand poleward (Fig. 11b, c). The UVI signature, however, appears to expand only as far as 70°, whereas the enhanced electron temperatures, presumably resulting from softer precipitation than the required for a signi®cant UVI intensity, expand to 72°. This disparity between the ESR
and UVI data is consistent with the statistical oset found between Viking UV images and particle precip-itation boundaries derived from 32 eV±30 keV particles measured by the DMSP spacecraft observed by Kauris-tieet al.(1999).
5 Summary
On August 21st 1998, a sharp southward turning of the IMF, following on from a 20 h period of northward
Fig. 10. A schematic of the development of the impulsive electrojets and plasma ¯ows for 5 min after the substorm expansion phase onset.
Arrowed solid lines indicate plasma ¯ow streamlines.Dark shading
directed magnetic ®eld resulted in an isolated substorm over northern Scandinavia and Svalbard. A combination of high-time resolution and large spatial scale measure-ments from an array of coherent scatter and incoherent scatter ionospheric radars, ground magnetometers and thePolarUVI imager has allowed the electrodynamics of the impulsive substorm onset region at the expansion phase onset to be studied in great detail. The observa-tions are made at the eastward edge of the expanding electrojet. A number of new features are observed.
The substorm-disturbed electrojet region is charac-terised by a strong enhancement of the electron temperature and UV aurora. The poleward expanding auroral structure moves initially at 0.9 km s)1poleward,
slowing to 0.6 km s)1by 71.5°latitude. This
poleward-expanding auroral feature ®nally reaches a latitude of 72.5°. The optical signature expands rapidly westwards at 6 km s)1, whilst the eastward edge also expands
eastward at 0.6 km s)1. Typical ¯ows of 600 m s)1
and conductances of 2 S were measured before the auroral activation, which rapidly changed to 100 m s)1 and 10±20 S respectively. These values are
consistent with previous measurements with EISCAT and with HF radars, which have suggested that typical values of ¯ow and conductance within the substorm-disturbed electrojet are 50±200 m s)1and 20±100 S. The
initial ¯ow response to the substorm expansion phase onset is a ¯ow suppression. This region of suppressed
¯ow is observed up to some 300 km poleward of the initial region of auroral luminosity, imposed over a time scale of less than 10 s. Thus the high-conductivity region of the electrojet region acts as an obstacle to the ¯ow, resulting in a region of low-electric ®eld, but also low conductivity poleward of the high-conductivity region. Rapid ¯ows are observed at the edge of the high-conductivity region, and subsequently the ¯ow enhances, ¯owing around the expanding auroral feature in a direction determined by the ¯ow pattern prevailing before the substorm intensi®cation. The precipitation region associated with the substorm-disturbed region extended some 2°further poleward than the UV auroral signature associated with it.
Acknowledgements. The authors thank the director and sta of EISCAT for the operation of the facility and dissemination of the data. EISCAT is an international facility funded collaboratively by the research councils of Finland (SA), France (CNRS), the Federal Republic of Germany (MPG), Japan (NIPR), Norway (NAVF), Sweden (NFR) and the United Kingdom (PPARC). The Super-DARN Hankasalmi and³ykkvibñr HF radars are deployed and operated by the University of Leicester, and funded by the PPARC (Grant PPA/R/R/1997/00256), the Finnish Meteorological Insti-tute, and the Swedish Institute for Space Physics. IMAGE data were kindly supplied by the Finnish Meteorological Institute. We would like to thank G. Parks, M. Brittnacher and NASA for the provision ofPolarUVI data. We are grateful to Ron Lepping and Keith Ogilvie, principal investigators on theWindspacecraft MFI and SWE instruments respectively. JAD, SEM, NMW and GP are supported on PPARC Grant PPA/G/O/1997/000254. We would also like to thank Paul Eglitis for the loan of his horsebox.
The Editor-in-chief thanks K. Kauristie for the help in evaluating this paper.
References
Baker, K. B., and S. Wing,A new magnetic coordinate system for conjugate studies at high latitudes,J. Geophys. Res.,94,9139, 1989.
Baumjohann, W., R. J. Pellinen, H. J. Opgenoorth, and E. Nielsen,
Joint two-dimensional observations of ground magnetic and ionospheric electric ®elds associated with auroral zone currents: current systems associated with local auroral break-ups,Planet Space Sci.,29,431, 1981.
Cowley, S. W. H., and M. Lockwood,Excitation and decay of solar wind-driven ¯ows in the magnetosphere-ionosphere system,
Ann. Geophysicae,10,103, 1992.
Davies, J. A., M. Lester, B. Jenkins, and R. J. Moett,Dayside ion frictional heating: EISCAT observations and comparison with model results,J. Atmos. Terr. Phys.,57,775, 1995.
Fox, N. J., S. W. H. Cowley, J. A. Davies, R. A. Greenwald, M. Lester, M. Lockwood, and H. LuÈhr, Ionospheric ion and electron heating at the poleward boundary of a poleward-expanding substorm-disturbed region, (in Press.) J. Geophys. Res., 2000.
Greenwald, R. A., K. B. Baker, J. R. Dudeney, M. Pinnock, T. B. Jones, E. C. Thomas, J.-P. Villain, J.-C. Cerisier, C. Senior, C. Hanuise, R. D. Hunsucker, G. Sofko, J. Koehler, E. Nielsen, R. Pellinen, A. D. M. Walker, N. Sato, and H. Yamagishi,Darn/Superdarn: a global view of the dynamics of high-latitude convection,Space Sci. Rev.,71,761, 1995.
Inhester, B., W. Baumjohann, R. A. Greenwald, and E. Nielsen,
Joint two-dimensional observations of ground magnetic and ionospheric electric ®elds associated with auroral zone currents 3. Auroral zone currents during the passage of a westward travelling surge,J. Geophys.,49,155, 1981.
Kamide, Y., The substorm current system: predicting speci®c features,Proc. ICS-3, ESA SP-389, p5, 1996.
Kan, J. R.,A globally integrated substorm model: tail reconnection and magnetosphere-ionosphere coupling,J. Geophys. Res.,103,
11 787, 1998.
Kauristie, K., J. Wegand, T. I. Pulkkinen, J. S., Murphree, and P. T. Newell, Size of the auroral oval: UV and precipitation boundaries compared,J. Geophys. Res.,104,2321, 1999.
Lepping, R. P. et al., The WIND magnetic ®eld investigation,
Space Sci. Rev.,71,207, 1995.
Lewis, R. V., M. P. Freeman, A. S. Rodger, G. D. Reeves, and D. K. Milling,The electric ®eld response to the growth phase and expansion phase onset of a small isolated substorm,Ann. Geophysicae,15,289, 1997.
LuÈhr, H.,The IMAGE magnetometer network,STEP Int.Newsl.4
(10), 4, 1994.
LuÈhr, H., A. Aylward, S. C. Buchert, A. PajunpaÈaÈ, T. Holmboe, and S. M. Zalewski,Westward moving dynamic substorm features observed with the IMAGE magnetometer network and other ground-based instruments,Ann. Geophysicae,16,425, 1998.
Milan, S. E., J. A. Davies, and M. Lester, Coherent HF radar backscatter characteristics associated with auroral forms iden-ti®ed by incoherent radar techniques: a comparison of CUT-LASS and EISCAT observations,J. Geophys. Res.,104,22 591, 1999.
Morelli, J. P., R. J. Bunting, S. W. H. Cowley, C. J. Farrugia, M. P. Freeman, E. Friis-Christensen, G. O. L. Jones, M. Lester, R. V. Lewis, H. LuÈhr, D. Orr, M. Pinnock, G. D. Reeves, P. J. S. Williams, and T. K. Yeoman, Radar observations of auroral zone ¯ows during a multiple-onset substorm,Ann. Geophysicae,
13,1144, 1995.
Nakamura, R., T. Oguti, T. Yamamoto, and S. Kokubun, Equator-ward and poleEquator-ward expansion of the auroras during auroral substorms,J. Geophys. Res.,98,5743, 1993.
Olsson, A., M. A. L. Persson, H. J. Opgenoorth, and S. Kirkwood,
Particle precipitation in auroral breakups and westward trav-elling surges,J. Geophys. Res.,101,24 661, 1996.
Opgenoorth, H. J., R. J. Pellinen, W. Baumjohann, E. Nielsen, G. Marklund, and L. Eliasson,Three dimensional current ¯ow and particle precipitation in a westward travelling surge (observed during the Barium-GEOS rocket experiment),
J. Geophys. Res.,88,3138, 1983.
Opgenoorth, H. J., B. Bromage, D. Fontaine, C. LaHoz, A. Huuskonen, H. Kohl, U.-P. Lùvhaug, G. Wannberg, G. Gustason, J. S. Murphree, L. Eliasson, G. Marklund, T. A. Potemra, S. Kirkwood, E. Nielsen, and J.-E. Wahlund,
Coordinated observations with EISCAT and the Viking satel-lite: the decay of a westward travelling surge,Ann. Geophysicae,
7,479, 1989.
Persson, M. A. L., A. T. Aikio, and H. J. Opgenoorth, Satellite-ground coordination: late growth and Early expansion phase of a substorm, in,Proc. ICS-2, Eds. J. R. Kan, J. D. Craven, and S.-I. Akasofu, Fairbanks, USA, 1994.
Rishbeth, H., and P. J. S. Williams, The EISCAT ionospheric radar: the system and its early results,Q. J. R. Astr. Soc.,26,
478, 1985.
Ruohoniemi, J. M., and K. B. Baker,Large-scale imaging of high-latitude convection with Super Dual Auroral Radar Network HF radar observations,J. Geophys. Res.,103,20 797, 1998.
Ruohoniemi, J. M., and R. A. Greenwald,Statistical patterns of high-latitude convection obtained from Goose Bay HF radar observations,J. Geophys. Res.,101,21 743, 1996.
Ruohoniemi, J. M., R. A. Greenwald, K. B. Baker, J.-P. Villain, C. Hanuise, and J. Kelly, Mapping high-latitude plasma convection with coherent HF radars,J. Geophys. Res.,94, 13 463, 1989.
Samson, J. C., Mapping substorm intensi®cations from the ionosphere to the magnetosphere, in, Proc. ICS-2, Eds. J. R. Kan, J. D. Craven, and S.-I. Akasofu, Fairbanks, USA, 1994.
and ®eld line resonances in the nightside magnetosphere,
J. Geophys. Res.,97,8495, 1992.
Shand, B. A., T. K. Yeoman, R. V. Lewis, R. A. Greenwald, and M. R. Hairston,Inter-hemispheric contrasts in the ionospheric convection response to changes in the interplanetary magnetic ®eld and substorm activity: a case study,Ann. Geophysicae,16,
764, 1998.
Torr, M. R., D. G. Torr, M. Zukic, R. B. Johnson, J. Ajello, P. Banks, K. Clark, K. Cole, C. Keer, G. Parks, B. Tsurutani, and J. Spann, A far ultraviolet imager for the international solar-terrestrial physics mission,Space Sci. Rev.,71,329, 1995.
Untiedt, J., and W. Baumjohann,Studies of polar current systems using the IMS Scandinavian magnetometer array, Space Sci. Rev.,63,245, 1993.
Villain, J.-P., J. M. Ruohoniemi, R. A. Greenwald, and K. B. Baker,
HF radar observations of E region plasma irregularities produced by oblique plasma streaming, J. Geophys. Res., 92,
12 327, 1987.
Wannberg G., L. Wolf, L.-G. Vanhainen, K. Koskenniemi, J. RoÈttger, M. Postila, J. Markkanen, R. Jacobsen, A. Stenberg, R. Larsen, S. Eliassen, S. Heck and A. Huuskonen,The EISCAT Svalbard radar: a case study in modern incoherent scatter radar system design,Radio Sci.,32,2283, 1997.
Williams, P. J. S., and A. R. Jain,Observations of the high-latitude trough using EISCAT,J. Atmos. Terr. Phys.,48,423, 1986.
Yeoman, T. K., and H. LuÈhr,CUTLASS/IMAGE observations of high latitude convection features during substorms, Ann. Geophysicae,15,692, 1997.
Yeoman, T. K., H. LuÈhr, R. W. H. Friedel, S. Coles, M. GrandeÂ, C. H. Perry, M. Lester, P. N. Smith, H. J. Singer, and D. Orr,
CRRES/ground-based multi-instrument observations of an interval of substorm activity,Ann. Geophysicae,12,1174, 1994.