Submitted11 November 2016 Accepted 31 December 2016 Published31 January 2017
Corresponding author Kyosuke Momota, [email protected]
Academic editor Magnus Johnson
Additional Information and Declarations can be found on page 16
DOI10.7717/peerj.2952
Copyright
2017 Momota and Nakaoka
Distributed under
Creative Commons CC-BY 4.0
OPEN ACCESS
Influence of different types of sessile
epibionts on the community structure of
mobile invertebrates in an eelgrass bed
Kyosuke Momota1and Masahiro Nakaoka2
1Graduate School of Environmental Science, Hokkaido University, Akkeshi, Hokkaido, Japan
2Akkeshi Marine Station, Field Science Center for Northern Biosphere, Hokkaido University, Akkeshi,
Hokkaido, Japan
ABSTRACT
Eelgrass (Zostera marina) beds are known to have high ecological and economical values within coastal ecosystems of the temperate northern hemisphere although their biodiversity and functions varied greatly from sites to sites. The variation in the biomass, abundance and diversity of mobile invertebrates in eelgrass beds has been examined in relation to various abiotic and biotic factors, such as water temperature, salinity, eelgrass biomass and epiphytic microalgae presence. However, the importance of sessile epibionts, such as macroalgae and calcific spirorbid polychaetes attached to eelgrass blades, has not been the focus of previous studies. In the present study, we examined the effects of three different sessile epibionts, namely, branched red algae, filamentous green algae, and calcific spirorbid polychaetes, on the biomass and diversity of mobile invertebrates in the eelgrass beds of Akkeshi in northeastern Japan. The relationships between seven abiotic and biotic variables including three types of epibionts, and biomass of 11 dominant mobile invertebrate species as well as three community-level variables (the total biomass of mobile invertebrates, species richness and the Shannon-Wiener species diversity index) were analyzed using a linear mixed model. Our results show that branched red algae are correlated with Pontogeneia rostrata, Lacunaspp., Nereissp.,Syllissp. and the total biomass of mobile invertebrates, filamentous green algae withP. rostrata,Ansola angustataand the species diversity of mobile invertebrates, and spirorbid polychaetes withA. angustata,Lacunaspp.,Siphonacmea oblongata,Syllis sp., the species richness and diversity of mobile invertebrates. The effect size of the epibionts was similar or even higher than that of abiotic and eelgrass factors on the total biomass of mobile invertebrates, species richness, species diversity and most of dominant invertebrate populations across the taxonomic groups. Consequently, epibiotic macroalgae and spirorbid polychaetes can be good predictors of the variation in the total biomass, species richness and species diversity of mobile invertebrates and the biomass of major dominant species, especially for species that have a relatively high dependency on eelgrass blades. These results suggest that the different functional groups of sessile epibionts have significant roles in determining the biomass and diversity of mobile invertebrates in eelgrass beds.
SubjectsBiodiversity, Ecology, Environmental Sciences, Marine Biology
INTRODUCTION
The abundance, biomass and species diversity of marine benthic invertebrate communities vary greatly with multiple abiotic/biotic factors. The effects of temperature and salinity as environmental filters have been known to be critical factors that regulate population/ community patterns and processes in coastal habitats, especially in estuaries where strong environmental gradients are generated by tidal fluctuation and freshwater inflow (e.g.,
Ysebaert et al., 2003;Yamada et al., 2007b; Douglass et al., 2010;Blake & Duffy, 2010). Water temperature can either increase or decrease the abundance and diversity of component species (e.g.,Somero, 2002;Harley et al., 2006;Hoegh-Guldberg & Bruno, 2010;
Meager, Schlacher & Green, 2011), whereas a decrease in salinity generally leads to a lower species diversity and higher dominance by tolerant species (e.g., Ysebaert et al., 2003;
Yamada et al., 2007b). Marine plants act as both a food resource because plant resource utilizers dominate in marine benthic invertebrate communities (e.g.,Valentine & Heck Jr, 1999;Harley, 2006;Poore et al., 2012) and as habitat-former (e.g.,Attrill, Strong & Rowden, 2000;Lee, Fong & Wu, 2001;Thomsen, 2010;Gartner et al., 2013).
requirement and life history traits is thus necessary to deepen our understanding of the organization of animal assemblages in eelgrass beds and of the influences these organisms have on each other and on eelgrass.
An extensive eelgrass meadow, consisting mostly of Zostera marinaand partly of Z. japonicaandRuppia maritima, is located in the Akkeshi-ko estuary and the Akkeshi Bay in eastern Hokkaido, Japan (Hasegawa, Hori & Mukai, 2007). From early summer to late fall, a large variety of algae and sessile animals (epibiotic species), which attach to eelgrass blades, are observed, including microalgae, branched red algae, Neosiphonia sp., Chondria dasyphylla, filamentous green algae, Cladophorasp., calcareous algae, Pneophyllum zostericola, and spirorbid polychaetes, such asNeodexiospira brasiliensis, bryozoans, hydrozoans, and tunicates. Among them, microalgae, the branched red algae and the spirorbid polychaetes are dominant in eelgrass beds for a long term, between early summer and late fall, with the peak of abundance between August and September (Hamamoto & Mukai, 1999; Kasim & Mukai, 2006; Hasegawa, Hori & Mukai, 2007; K Momota, 2013, unpublished data). Previous studies on benthic invertebrate assemblages in the Akkeshi-ko estuary and Akkeshi Bay have focused on their variability in relation to the salinity gradient (Yamada et al., 2007a;Yamada et al., 2007b). In addition to salinity, the spatial heterogeneity of other abiotic/biotic factors (e.g., water temperature, microalgal biomass and eelgrass biomass) is also high in estuarine systems, such as the Akkeshi-ko estuary (Iizumi et al., 1996;Kasim & Mukai, 2006; Hasegawa, Hori & Mukai, 2007). Nevertheless, no previous study has investigated the mobile invertebrate community structure using an approach that simultaneously accounts for the details of sessile epibionts and environmental control by abiotic factors in the seagrass beds in Akkeshi.
In the present study, we investigated how multiple abiotic and biotic factors are related to the variation in the community structure (total mobile invertebrate biomass, species richness and species diversity) of the mobile invertebrates and the population biomass of the dominant species in the eelgrass beds in Akkeshi. Our specific focus was to test the relationship between various sessile epibionts on eelgrass blades and the mobile inverte-brates that live on eelgrass blades. Including these factors in the multivariate model, this analysis expands the classical models that consider only abiotic factors, eelgrass and microalgae as the explanatory variables.
MATERIALS AND METHODS
Study area
Yamada et al., 2007a;Yamada et al., 2007b). Here, freshwater input from the Bekanbeushi River, which accounts for 98.8% of all of the flow volume (Iizumi et al., 1996), and tidal seawater input from the Akkeshi Bay cause steep physical and chemical environmental gradients (Iizumi et al., 1996;Yamada et al., 2007a).
Akkeshi Bay has an area of approximately 110 km2 and opens to the Pacific Ocean
at the south end. Two seagrass species Z. marina andZ. asiaticaare present from the intertidal zone to the subtidal zone (5 m below mean low water); the former occurs at depths shallower than 2 m and the latter dominates in deeper water (Watanabe, Nakaoka & Mukai, 2005). The influence of the freshwater discharge on species composition of seagrass community is observed near the channel connecting the bay to the Akkeshi-ko estuary (Yamada et al., 2007a).
In this study, we established stations in the Akkeshi-ko estuary (BK: river mouth of the Bekanbeushi River, HN: Horonitai, TB: Toubai, SL: the southern lake, CL: the central lake and CK: Chikarakotan) and one station in Akkeshi Bay (SR: Shinryu) (Fig. 1). BK (mean sea level, MSL hereafter: 0.9 m) is located at the mouth of the Bekanbeushi River and is strongly affected by freshwater inflow. The vegetation is dense with small-sized Z. marina(average shoot length of 1.0 m in August). HN (MSL: 1.1 m) is in a location with a high water temperature and medium salinity relative to the other stations. In addition toZ. marina,Ruppia maritima, a seagrass species that is more tolerant to low-saline water, occurs at HN. The eelgrass beds at HN are mostly continuous but have some gaps, and the average shoot length in August is 1.3 m. TB (MSL: 1.1 m) and SL (MSL: 1.0 m) have a relatively low salinity compared to that of the other stations and are the furthest stations from the Akkeshi Bay. Although these two stations are in a similar environment, the water is often more turbid and the eelgrass bed is patchier at TB than SL. SL has a higher seagrass biomass and shoot density than TB. The average shoot length of eelgrass is approximately 1.3 m in August at both of these stations. CL (MSL: 1.4 m) and CK (MSL: 1.5 m) are deeper stations with a higher salinity and are dominated by longer eelgrass (shoot length: 1.5–3.5 m at the peak season). The eelgrass at SR (MSL: 1.5 m) in the Akkeshi Bay, has a similar shoot size to that in CL and CK. Here, the dominant seagrass species changes from Z. marinabed toZ. asiaticaat a depth of approximately 2 m, as mentioned above.
According toYamada et al. (2007a), salinity varies significantly among stations but does not vary greatly among seasons. During the summer (from July to August), eelgrass biomass, microalgal biomass and mobile invertebrates reach their peak (Hasegawa, Hori & Mukai, 2007;Yamada et al., 2007b). Seasonal changes in the mobile invertebrate species richness are not clearly understood (Yamada et al., 2007b).
Field sampling
conditions. We targeted mobile invertebrates but excluded some species with remarkably high mobility and low dependency on eelgrass habitat, such as mysids and decapods (Yamada et al., 2007b), which were not quantitatively collected by our method (see below).
We measured water temperature and salinity once at each station using a memory sensor (AAQ-175 RINKO; JFE Advantech Co. Ltd., Japan). To obtain the representative values, the sensor was carefully placed approximately 50 cm from the bottom to accurately reflect the environment inside of the seagrass meadow.
We collected three replicate samples (a total of 21 samples from all stations) of mobile invertebrates, spirorbid polychaetes and epiphytic macroalgae together with the entire above-ground parts of the eelgrass using a mesh bag (bore diameter: 20 cm, mesh size: 0.1 mm) based on the mouth area of the mesh bag (314 cm2). Upon collection, we counted the number of eelgrass shoots to determine shoot density. For microalgae, five replicate samples were collected per station, using separate plastic zip bags for each eelgrass shoot, because microalgae easily fell off from eelgrass blades when collected with the mesh bag.
Laboratory procedures
Immediately after being transported to the laboratory, the microalgae were scraped from the eelgrass blades using a glass slide; separated from other organisms such as macroalgae and spirorbid polychaetes; and then filtered using glass fiber filters (Whatman GF/F filter
ϕ 47 mm; Whatman International Ltd., Maidstone, UK). If other organisms were present in the microalgal samples, we carefully removed them from the filters with forceps. Other epibiotic organisms collected using mesh bags were separated from the eelgrass by scraping them off with a glass slide; these organisms were classified as red algae, green algae, spirorbid polychaetes and mobile invertebrates. To obtain dry mass, eelgrass shoots, red algae, green algae, spirorbid polychaetes and filtered microalgae were dried at 60◦C for 4 days in small aluminum foil bags, and then weighed. We counted and identified the mobile invertebrates after extraction with a sieve (500µm) and fixation with 70% ethanol. Identification of mobile invertebrates was made to the lowest taxonomical unit possible (mostly to species) using detailed guides from the literature (Gammarid amphipod:Nishimura, 1995;Carlton, 2007, Caprella amphipod, Isopod, Copepod, Cumacea:Nishimura, 1995;Carlton, 2007, Gastropod:Okutani, 2000, Polychaeta:Nishimura, 1992;Imajima, 1996;Imajima, 2001, Turbellaria:Nishimura, 1992,Carlton, 2007, Hirunoidea:Nishimura, 1992) and the World Register of Marine Species online database (WoRMS:http://www.marinespecies.org).
Statistical analysis
We used, as predictors, two abiotic factors (water temperature and salinity) and six biotic factors (eelgrass biomass (g dry weight per unit area: g DW m−2), eelgrass shoot density
(shoots m−2), microalgal biomass (g DW m−2), red algal biomass (g DW m−2), green algal biomass (g DW m−2) and spirorbid polychaete biomass (g DW m−2)). For eelgrass
green algae by a morphological trait (red algae: branched, green algae: filamentous). All invertebrate biomass (mg ash-free dry weight per unit area: mg AFDW m−2) was estimated
from the abundance and the size fraction using the empirical equations inEdgar (1990). To test which of the eight biotic/abiotic factors was a likely predictor of the variation in the mobile invertebrate community, we fitted linear mixed models (LMMs) with a Gaussian distribution (Bolker et al., 2009). The station was used as a random variable. As response variables, we used the biomass of 11 dominant species for the population-level analyses, and total invertebrate biomass, species richness and species diversity (Shannon-Wiener diversity index; calculated based on biomass data) for community-level analyses. The 11 most dominant species were selected by a threshold whereby the biomass proportion accounted for more than 1% of the total invertebrate biomass (see Table S1).Ostreobdella kakibir (Hirudinea) was omitted from the analysis because it occurred only at one station (SR), even though they satisfied the requirement. R software (version 3.1.3) was used for all of the analyses (R Development Core Team, 2015).
Prior to the LMM fit, all of the variables excluding species diversity were square root transformed to improve homoscedasticity and meet the assumptions of normality of the LMMs after checking for normality with the Shapiro–Wilk test. To test for collinearity between the eight environmental variables, we calculated Pearson’s correlation coefficients for all pairs. If the absolute value of the coefficient (r) was greater than 0.7, the level where collinearity does not affect model predictions (Dormann et al., 2013), we removed the relevant predictor as necessary. Because water temperature and microalgal biomass were highly correlated (Pearson’sr= −0.82,P<0.01), we removed microalgal biomass from the models. After this removal, we tested potential multicollinearity among the remaining predictors using the variance inflation factor (VIF) analysis with a cutoff of 10 (e.g.,
Dormann et al., 2013). VIF values were calculated using thevif.mer function developed by Frank (https://raw.githubusercontent.com/aufrank/R-hacks/master/mer-utils.R). However, all seven predictors were below the VIF value of 10 and remained. We therefore defined a reduced model with the seven predictors as the full model.
We fitted the LMMs using thelmer function in the lme4 package (Bates et al., 2014). To obtainP-values of the LMMs, we used thelmerTest package (Kuznetsova, Brockhoff & Christensen, 2014). We selected the optimal model comparing the candidate models on all combinations of the predictors by the Akaike information criterion as corrected for the small sample size (AICc:Burnham & Anderson, 2002). We obtained AICcbased on the maximum
likelihood (ML) for comparisons among the LMMs because the restricted maximum likelihood (REML) is inappropriate in the case when the fixed structure is different between the candidate models (Zuur et al., 2009), but the parameters were estimated by REML. We used theAICc tab function in thebbmle library (Bolker & R Development
Core Team, 2013) to compare the AICc. After setting the optimal models, we obtained
the standardized coefficients as effect sizes by re-fitting using standardized variables that were scaled by the sample standard deviation and centered by sample mean values.
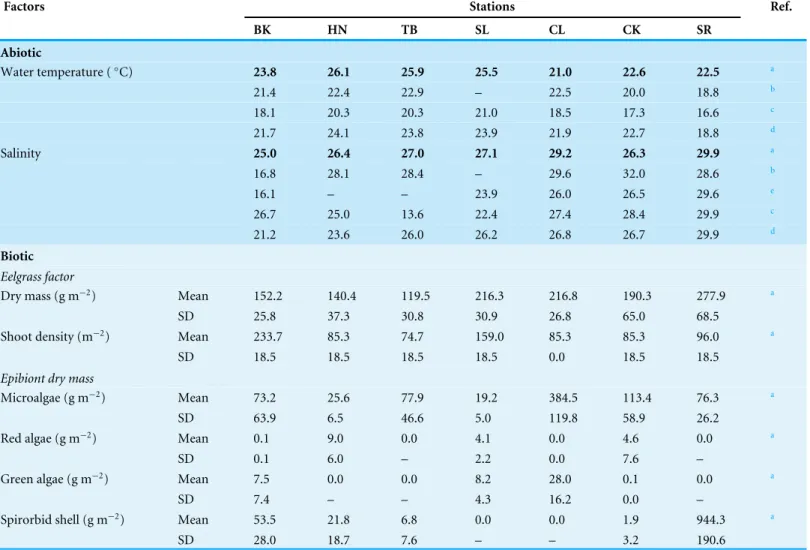
Table 1 Environmental conditions at seven stations in the Akkeshi-ko estuary and Akkeshi Bay.Abiotic factors in this study are indicated by boldface. For water temperature and salinity, we also presented data in August reported by the other studies.
Factors Stations Ref.
BK HN TB SL CL CK SR
Abiotic
Water temperature (◦C) 23.8 26.1 25.9 25.5 21.0 22.6 22.5 a
21.4 22.4 22.9 – 22.5 20.0 18.8 b
18.1 20.3 20.3 21.0 18.5 17.3 16.6 c
21.7 24.1 23.8 23.9 21.9 22.7 18.8 d
Salinity 25.0 26.4 27.0 27.1 29.2 26.3 29.9 a
16.8 28.1 28.4 – 29.6 32.0 28.6 b
16.1 – – 23.9 26.0 26.5 29.6 e
26.7 25.0 13.6 22.4 27.4 28.4 29.9 c
21.2 23.6 26.0 26.2 26.8 26.7 29.9 d
Biotic
Eelgrass factor
Dry mass (g m−2) Mean 152.2 140.4 119.5 216.3 216.8 190.3 277.9 a
SD 25.8 37.3 30.8 30.9 26.8 65.0 68.5
Shoot density (m−2) Mean 233.7 85.3 74.7 159.0 85.3 85.3 96.0 a
SD 18.5 18.5 18.5 18.5 0.0 18.5 18.5
Epibiont dry mass
Microalgae (g m−2) Mean 73.2 25.6 77.9 19.2 384.5 113.4 76.3 a
SD 63.9 6.5 46.6 5.0 119.8 58.9 26.2
Red algae (g m−2) Mean 0.1 9.0 0.0 4.1 0.0 4.6 0.0 a
SD 0.1 6.0 – 2.2 0.0 7.6 –
Green algae (g m−2) Mean 7.5 0.0 0.0 8.2 28.0 0.1 0.0 a
SD 7.4 – – 4.3 16.2 0.0 –
Spirorbid shell (g m−2) Mean 53.5 21.8 6.8 0.0 0.0 1.9 944.3 a
SD 28.0 18.7 7.6 – – 3.2 190.6
Notes. aThis study.
bIizumi et al. (1996).
cM Nakaoka et al. (2010, unpublished data).
dK Momota (2013, unpublished data).
eKasim & Mukai (2006).
RESULTS
Environmental factors
Water temperature was lower at the four stations (BK, CL, CK and SR) near the channel than at the other three stations in the inner parts of the estuary (HN, TB and SL) (Table 1). Salinity was lower at the lake-side stations (BK, HN, TB, SL and CK) that were influenced by freshwater inputs. For these stations, the inter-annual variation was also higher as shown by data collected by ourselves and other studies (Table 1).
Eelgrass biomass varied between 140 and 278 g DW m−2among the stations. It was
not largely different among other stations. Microalgal biomass varied by more than ten-fold between the lowest station (SL) and the highest station (CL). In the latter, the microalgal biomass exceeded the biomass of the eelgrass. Macroalgae were not present at TB and SR. Branched red algae were dominated byNeosiphoniasp. andChondria dasyphylla, and filamentous green algae were dominated byCladophorasp. The mean biomass of red algae was highest at HN and that of green algae was highest at CL, though their biomasses were less than 15% of that of eelgrass. Spirorbid polychaetes were not present at SL and CL. They were highly abundant at SR where their biomass was more than three-fold greater than the eelgrass biomass.
Mobile invertebrate community
A total of 32 mobile invertebrate species were collected in this study (Table S1). At taxo-nomic levels, polychaete worms made up 32.2% of the total biomass, followed by gastropods (31.3%), gammarid amphipods (23.0%), and isopods (8.8%). At the species level, a poly-chaeteNereissp. was most dominant (24.6%), followed by gastropodsLacunaspp. (23.4%) and the gammarid amphipodAmpithoe lacertosa(18.0%). For an additional eight species including two gammarid amphipods (Monocorophiumspp. andPontogeneia rostrata), two isopods (Cymodoce japonicaandParanthura japonica), two gastropods (Ansola angustata andSiphonacmea oblongata) and two polychaetes (Exogone naidinaandSyllissp.), their proportions were less than 5% at most.
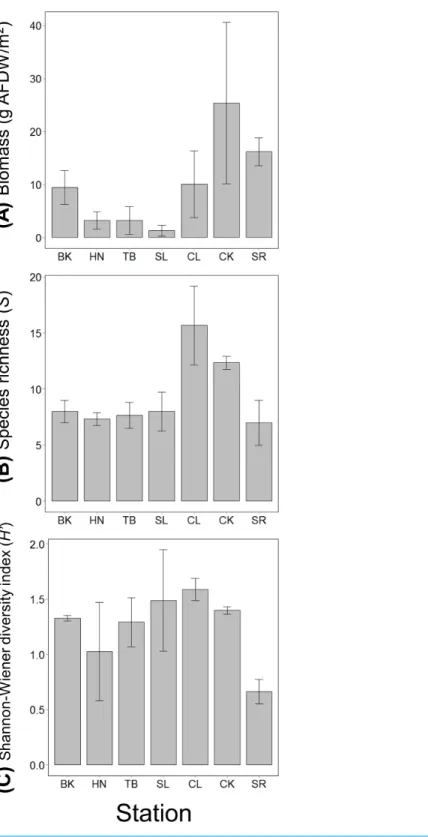
The mean value of the total mobile invertebrate biomass was the highest at CK and much lower at stations along the coastline (HN, TB and SL). Species richness was the highest at CL, followed by CK and was approximately the same level at the other stations (Fig. 2). The mean value of species diversity was the highest at CL and the lowest at SR (Fig. 2).
Population level analyses
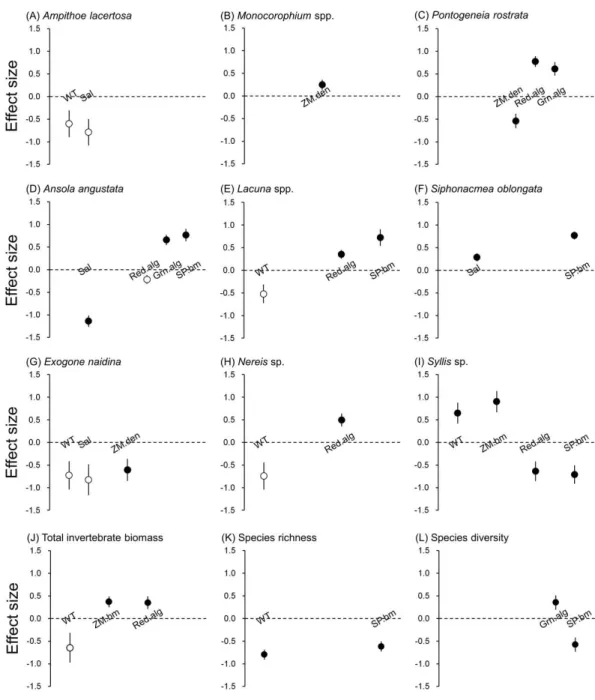
We found that each of the nine invertebrate populations belonging to gammarida, gastropoda and polychaeta was predicted by a different combination of environmental factors in the optimal models (Table 2). The effect size of three epibionts on dominant invertebrate species was either similar or larger than abiotic and eelgrass factors (Fig. 3). For two isopods, no environmental factor correlated with their biomass.
Water temperature was selected as the responsible factor for the variation ofA. lacertosa, Lacunaspp. and all three polychaetes. Among them, onlySyllissp. showed a significant correlation (positive). The significant effect of the salinity gradient was detected forA. angustata(negative) andS. oblongata(positive).
For the two predictors relevant to the characteristics of the eelgrass bed, the above-ground biomass showed a significant positive relationship only with Syllissp., whereas shoot density was significantly correlated withMonocorophiumspp. (positive),P. rostrata (negative) andE. naidina(negative) (Table 2).
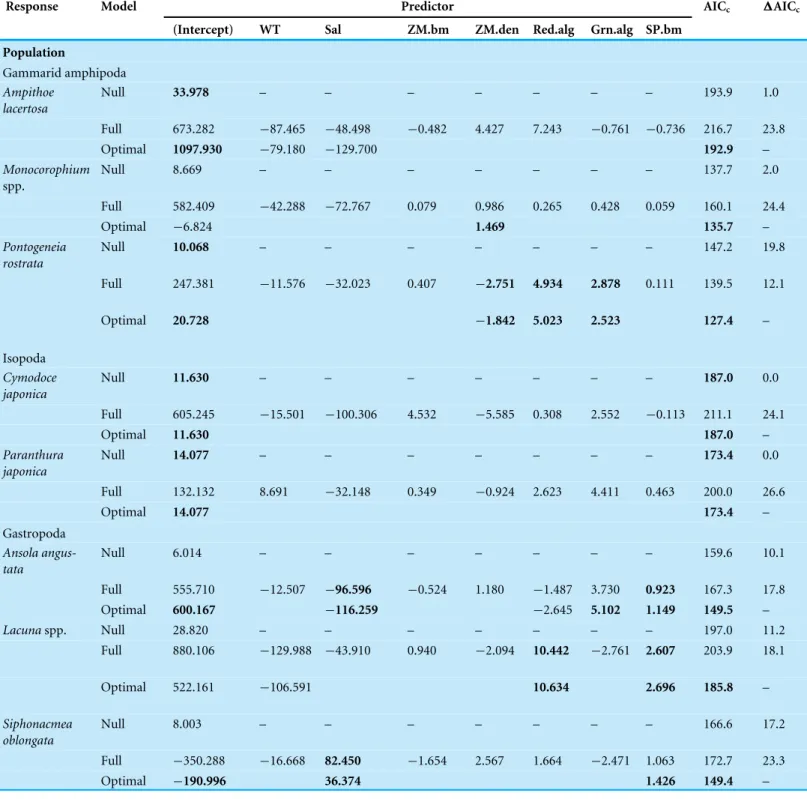
Table 2 Results of LMMs for explaining responsible environmental factors on variation in mobile invertebrate populations and community components.AICcscores and delta AICcare also reported. Significant coefficients (P-values < 0.05 level) and the lowest AICcscores are inbold face.
Response Model Predictor AICc 1AICc
(Intercept) WT Sal ZM.bm ZM.den Red.alg Grn.alg SP.bm
Population
Gammarid amphipoda Ampithoe
lacertosa
Null 33.978 – – – – – – – 193.9 1.0
Full 673.282 −87.465 −48.498 −0.482 4.427 7.243 −0.761 −0.736 216.7 23.8
Optimal 1097.930 −79.180 −129.700 192.9 –
Monocorophium spp.
Null 8.669 – – – – – – – 137.7 2.0
Full 582.409 −42.288 −72.767 0.079 0.986 0.265 0.428 0.059 160.1 24.4
Optimal −6.824 1.469 135.7 –
Pontogeneia rostrata
Null 10.068 – – – – – – – 147.2 19.8
Full 247.381 −11.576 −32.023 0.407 −2.751 4.934 2.878 0.111 139.5 12.1
Optimal 20.728 −1.842 5.023 2.523 127.4 –
Isopoda Cymodoce japonica
Null 11.630 – – – – – – – 187.0 0.0
Full 605.245 −15.501 −100.306 4.532 −5.585 0.308 2.552 −0.113 211.1 24.1
Optimal 11.630 187.0 –
Paranthura japonica
Null 14.077 – – – – – – – 173.4 0.0
Full 132.132 8.691 −32.148 0.349 −0.924 2.623 4.411 0.463 200.0 26.6
Optimal 14.077 173.4 –
Gastropoda Ansola angus-tata
Null 6.014 – – – – – – – 159.6 10.1
Full 555.710 −12.507 −96.596 −0.524 1.180 −1.487 3.730 0.923 167.3 17.8
Optimal 600.167 −116.259 −2.645 5.102 1.149 149.5 –
Lacunaspp. Null 28.820 – – – – – – – 197.0 11.2
Full 880.106 −129.988 −43.910 0.940 −2.094 10.442 −2.761 2.607 203.9 18.1
Optimal 522.161 −106.591 10.634 2.696 185.8 –
Siphonacmea oblongata
Null 8.003 – – – – – – – 166.6 17.2
Full −350.288 −16.668 82.450 −1.654 2.567 1.664 −2.471 1.063 172.7 23.3
Optimal −190.996 36.374 1.426 149.4 –
Table 2(continued)
Response Model Predictor AICc 1AICc
(Intercept) WT Sal ZM.bm ZM.den Red.alg Grn.alg SP.bm
Polychaeta Exogone naidina
Null 8.274 – – – – – – – 182.1 >0.1
Full 1003.724 −66.607 −119.185 1.236 −5.958 −1.510 0.675 −0.184 203.4 21.3
Optimal 988.365 −75.725 −106.916 −4.922 182.1 –
Nereissp. Null 23.110 – – – – – – – 211.7 6.4
Full 1994.677 −171.788 −216.463 5.651 −9.760 13.928 7.192 0.017 221.1 15.8
Optimal 844.824 −171.482 16.967 205.3 –
Syllissp. Null 6.678 – – – – – – – 175.2 1.3
Full −342.880 45.302 14.699 5.108 −0.141 -6.889 −1.247 −1.140 191.5 17.6
Optimal −269.866 45.615 4.886 −6.616 −0.908 173.9 –
Community component Total
inverte-brate biomass
Null 2.785 – – – – – – – 72.0 10.3
Full 60.096 −5.936 −5.985 0.214 −0.097 0.456 0.184 0.056 81.0 19.3
Optimal 23.569 −4.937 0.219 0.401 61.7 –
Species richness
Null 3.027 – – – – – – – 28.0 14.7
Full 16.581 −1.485 −1.211 0.080 −0.094 −0.036 0.080 −0.023 33.6 20.3
Optimal 13.909 −2.185 −0.031 13.3 –
Species diversity
Null 1.255 – – – – – – – 19.9 8.6
Full 2.056 −0.126 −0.049 0.010 0.012 −0.068 0.034 −0.026 36.7 25.4
Optimal 1.288 0.065 −0.020 11.3 –
Notes.
WT, water temperature; Sal, salinity; ZM.bm, eelgrass biomass; ZM.den, eelgrass shoot density; Red.alg, red algal biomass; Grn.alg, green algal biomass; SP.bm, spirorbid polychaete biomass.
biomasses were positively correlated withP. rostrata andLacunaspp. The biomass of spirorbid polychaetes was positively correlated with all three species of gastropods and was negatively correlated withSyllissp.
Although epiphytic microalgae were removed from our analysis because of the collinear-ity with water temperature, no significant correlation was found for species that were correlated with water temperature (A. lacertosa: Pearson’sr=4.05,P=0.25;Lacunaspp.: r= −3.42,P=0.69;E. naidina:r=0.31,P=0.92;Nereissp.:r=10.87,P=0.34;Syllis sp.:r=0.21,P=0.86).
Community level analyses
Figure 3 Effect size of abiotic and biotic factors on mobile invertebrate populations and community detected by linear mixed models.Water temperature (WT), salinity (Sal), eelgrass biomass (ZM.bm), eel-grass shoot density (ZM.den), branched red algae (Red.alg), filamentous green algae (Grn.alg) and spiror-bid polychaetes (SP.bm) We only reported the results of predictors selected by the best models (Table 2). Open circles represent detected predictors without significance (P>0.05) and filled circles represent de-tected predictors with significance (P<0.05). Error bars indicate standard errors of effect sizes.
DISCUSSION
The present study demonstrated that the biomass gradient of epibiotic organisms (e.g., macroalgae and spirorbid polychaetes) was a good predictor of the variation in some domi-nant mobile invertebrates in the eelgrass bed and the population biomass of the community parameters such as total biomass and diversity. Further, we found that the population biomasses and community components were not always influenced only by a single factor but also by multiple factors. The effect of the macroalgae is notable because these sessile epibionts have much lower biomass compared to the biomass of eelgrass and epiphytic microalgae. However, the observed relationships between these functional groups and mobile invertebrate populations varied greatly among the species.
In the optimal models, the effects of biomass of epibiotic organisms on the gammarid amphipodP. rostrata, all three gastropod species (A. angustata,Lacunasp. andS. oblongata) and two polychaetes (Nereissp. andSyllissp.) were detected. For those species, the sessile epibionts were positively related to mobile invertebrate biomasses except forSyllissp. and P. rostrata, which showed a positive correlation with both red and green algae. The algae are considered to be used as a temporal shelter (habitat) rather than as a food resource because these animals do not firmly attach to the eelgrass blades but rather drift among shoots (Suh & Yu, 1997;Yamada et al., 2007b;Yu, Jeong & Suh, 2008), and because they have a preference for feeding on phytoplankton and detritus (Yu & Suh, 2011). High predation risk for swimming amphipods with low self-defense abilities, such asP. rostrata, has been reported in several studies (Sudo & Azeta, 1992; Beare & Moore, 1998). In fact, gammarid amphipods are a major source of prey for blennoid fish in the eelgrass beds of Northern Japan (Watanabe et al., 1996;Sawamura, 1999;Yamada et al., 2010). Therefore, the complex micro-habitat created by macroalgae allows them to escape these predators.
All three gastropods increased in correlation with spirorbid polychaetes, whereas the responses to the other factors were different (Table 2). Because the gastropods adhere to flat seagrass blades, the flat (simple) structure created by seagrass blades can be better than the rough structure of spirorbid polychaetes. Therefore, competition for space (negative effect) appears to be more expected than facilitation. Although we do not have a good answer for the positive relationships, one possibility for this unexpected result is that the rough structure acts as a shelter because small-sized individuals (<3 mm) are frequent in gastropod populations during the summer season (A. angustata: Momota, personal observation; Lacunaspp.: Kanamori, Goshima & Mukai, 2004;S. oblongata:Toyohara, Nakaoka & Tsuchida, 2001).
Red algae are considered to positively affectNereissp. by providing habitat because poly-chaetes build tubes both on eelgrass blades and in red algal canopies in Akkeshi (Momota, unpublished data). The negative effect of red algae and spirorbid polychaetes onSyllissp. may suggest that this mobile polychaete prefers a simple structured habitat without a complex micro-habitat created by eelgrass blades with sessile epibionts.
Surprisingly, eelgrass biomass was not correlated with most species except forSyllissp., and the direction (positive/negative) of the effect of eelgrass shoot density was different among the species. The same response of syllid polychaetes was reported in previous studies (e.g.,Bone & San Martín, 2003). For eelgrass shoot density, the result suggests that it indirectly affects mobile invertebrates through interfering with multiple physical and biological processes (e.g., water current and flux, detritus and drifting algae trapping, recruitment, and predation intensity:Gambi, Nowell & Jumars, 1990;Robbins & Bell, 1994;
Attrill, Strong & Rowden, 2000;Boström & Bonsdorff, 2000;Lee, Fong & Wu, 2001;Hovel et al., 2002). Notably, the contrasting relationships ofP. rostratawith eelgrass shoot density and macroalgae imply that the shelter effect is different depending on the spatial scale (i.e., blade scale, shoot/patch scale).
The isopodsC. japonicaandP. japonicawere not correlated with any abiotic or biotic factors because of the low dependency on the seagrass habitat; they can utilize other numer-ous habitats created by both natural and artificial materials (e.g., mussel beds, oyster reefs:
Marchini et al., 2014;Nakamachi, Ishida & Hirohashi, 2015; gravel, litter layer of macro-phytes,Sargassummeadow: Momota, personal observation). Additionally, their uniform appearance throughout all of the stations indicates that they have a wide tolerance to a broad range of environmental stress, which leads to a lack of correlation with any of the abiotic factors. Additionally, the gammarid amphipodA. lacertosawas not significantly correlated with any factors. This species is widely distributed along the Pacific-rim coast of the northern hemisphere and utilizes a variety of plant habitats by building tubes (Hiebert, 2015), which may explain why it did not show any relationship with the environmental gradients.
Although the discussion on underlying drivers that generate apparent correlations (i.e., the causalities) between epibionts and mobile invertebrates is not our main focus, the indirect effects and the top-down control of mobile invertebrates should also be taken into account to interpret present findings. For example, we can give an alternative possibility for the positive relationship between gastropods and spirorbid polychaetes such that high grazing of the gastropods facilitates the recruitment of spirorbid polychaetes through the removal of the microalgal cover.
CONCLUSIONS
The present study suggests that macroalgae and sessile animals on eelgrass blades can affect the biomass and diversity of mobile invertebrates and that incorporating these biotic factors can improve the prediction of the variability of the mobile invertebrate community in the eelgrass bed. However, the underlying causal relationships appear to be complex and vary greatly from species to species. Our findings were based on data collected over one sampling period when the eelgrass bed was most productive and when the abundance and/or diversity of algae and mobile invertebrates typically reached their maximum. A more comprehensive investigation of the functional relationships among the various types of organisms and of the temporal changes should be conducted in future studies on eelgrass bed communities.
Recent studies demonstrated that the capacity for resistance and resilience to environmental stress and perturbations vary with food web structure in seagrass beds, which knowledge can contribute to improvement of coastal management (Unsworth et al., 2015;Maxwell et al., 2016;Östman et al., 2016). Our study comparing population and community level responses of epifauna to different types of epibionts on eelgrass blades adds more knowledge on the complex trophic/non-trophic interactions of eelgrass communities, and will promote more understandings of the resilience and the feedback mechanisms of seagrass ecosystems which offer variable ecosystem services to human such as seafood pro-visioning and water quality controls (Cullen-Unsworth et al., 2014;Nordlund et al., 2016).
ACKNOWLEDGEMENTS
We wish to thank S Hamano, H Katsuragawa and other members in Akkeshi Marine Station, NM Kollars in UC Davis, Dr. K Abe and other staff in National Research Institute of Fisheries and Environment of Inland Sea, and T Maezawa in Hokkaido University.
ADDITIONAL INFORMATION AND DECLARATIONS
Funding
This study is partly supported by JST/CREST (Establishment of core technology for the preservation and regeneration of marine biodiversity and ecosystems), by JSPS/KAKENHI (no. 21241055), and by the Environment Research and Technology Development Fund (S-15 Predicting and Assessing Natural Capital and Ecosystem Services (PANCES)) of the Ministry of the Environment, Japan. The funders had no role in study design, data collection and analysis, decision to publish, or preparation of the manuscript.
Grant Disclosures
The following grant information was disclosed by the authors: JST/CREST.
JSPS/KAKENHI: 21241055.
Environment Research and Technology Development Fund.
Competing Interests
Author Contributions
• Kyosuke Momota conceived and designed the experiments, performed the experiments, analyzed the data, contributed reagents/materials/analysis tools, wrote the paper, prepared figures and/or tables.
• Masahiro Nakaoka conceived and designed the experiments, analyzed the data, contributed reagents/materials/analysis tools, wrote the paper.
Data Availability
The following information was supplied regarding data availability: The raw data has been supplied asData S1.
Supplemental Information
Supplemental information for this article can be found online athttp://dx.doi.org/10.7717/ peerj.2952#supplemental-information.
REFERENCES
Attrill MJ, Strong JA, Rowden AA. 2000.Are macroinvertebrate communities influenced
by seagrass structural complexity?Ecography23:114–121 DOI 10.1111/j.1600-0587.2000.tb00266.x.
Bates D, Maechler M, Bolker B, Walker S. 2014.lme4: linear mixed-effects models using
Eigen and S4.Available athttp:// CRAN.R-project.org/ package=lme4.
Beare DJ, Moore PG. 1998.Aspects of the life histories of Perioculodes longimanus,
Pontocrates arcticusandSynchelidium maculatum(Crustacea: Amphipoda) at
Millport, Scotland.Journal of the Marine Biological Association of the United Kingdom 78:193–209DOI 10.1017/S0025315400040029.
Blake RE, Duffy JE. 2010.Grazer diversity affects resistance to multiple stressors in an
ex-perimental seagrass ecosystem.Oikos119:1625–1635 DOI 10.1111/j.1600-0706.2010.18419.x.
Bolker BM, Brooks ME, Clark CJ, Geange SW, Poulsen JR, Stevens MHH, White JSS.
2009.Generalized linear mixed models: a practical guide for ecology and evolution.
Trends in Ecology and Evolution24:127–135DOI 10.1016/j.tree.2008.10.008.
Bolker BM, R Development Core Team. 2013.bbmle: tools for general maximum
likelihood estimation.Available athttp:// CRAN.R-project.org/ package=bbmle.
Bone D, San Martín G. 2003.Ecological aspects of syllids (Annelida: Polychaeta:
Syllidae) on Thalassia testudinum beds in Venezuela.Hydrobiologia496:289–298 DOI 10.1023/A:1026117503709.
Boström C, Bonsdorff E. 2000.Zoobenthic community establishment and habitat
complexity—the importance of seagrass shoot-density, morphology and physical disturbance for faunal recruitment.Marine Ecology Progress Series205:123–138 DOI 10.3354/meps205123.
Burnham KP, Anderson DR. 2002.Model selection and multimodel inference: a practical
Carlton JT (ed.) 2007. The light and Smith manual: intertidal invertebrates from Central California to Oregon. 4th edition. Berkeley: University of California Press.
Cullen-Unsworth LC, Nordlund LM, Paddock J, Baker S, McKenzie LJ, Unsworth RKF.
2014.Seagrass meadows globally as a coupled social–ecological system: implications
for human wellbeing.Marine Pollution Bulletin83:387–397 DOI 10.1016/j.marpolbul.2013.06.001.
Dormann CF, Elith J, Bacher S, Buchmann C, Carl G, Carré G, Marquéz JRG, Gruber B, Lafourcade B, Leitão PJ, Münkemüller T, Mcclean C, Osborne PE, Reineking
B, Schröder B, Skidmore AK, Zurell D, Lautenbach S. 2013.Collinearity: a review
of methods to deal with it and a simulation study evaluating their performance. Ecography36:27–46DOI 10.1111/j.1600-0587.2012.07348.x.
Douglass JG, France KE, Richardson JP, Duffy JE. 2010.Seasonal and interannual
change in a Chesapeake Bay eelgrass community: insights into biotic and abiotic control of community structure.Limnology and Oceanography 55:1499–1520 DOI 10.4319/lo.2010.55.4.1499.
Duffy JE. 2006.Biodiversity and the functioning of seagrass ecosystems.Marine Ecology
Progress Series311:233–250DOI 10.3354/meps311233.
Duffy JE, Hay ME. 2000.Strong impacts of grazing amphipods on the organization of a
benthic community.Ecological Monographs70:237–263 DOI 10.1890/0012-9615(2000)070[0237:SIOGAO]2.0.CO;2.
Duffy JE, Richardson JP, France KE. 2005.Ecosystem consequences of diversity
depend on food chain length in estuarine vegetation.Ecology Letters8:301–309 DOI 10.1111/j.1461-0248.2005.00725.x.
Edgar GJ. 1990.The use of the size structure of benthic macrofaunal communities to
estimate faunal biomass and secondary production.Journal of Experimental Marine Biology and Ecology137:195–214DOI 10.1016/0022-0981(90)90185-F.
Gambi MC, Nowell ARM, Jumars PA. 1990.Flume observations on flow dynamics
inZostera marina(eelgrass) beds.Marine Ecology Progress Series61:159–169 DOI 10.3354/meps061159.
Gartner A, Tuya F, Lavery PS, McMahon K. 2013.Habitat preferences of
macroinverte-brate fauna among seagrasses with varying structural forms.Journal of Experimental Marine Biology and Ecology439:143–151DOI 10.1016/j.jembe.2012.11.009.
Hamamoto K, Mukai H. 1999.Effects of larval settlement and post-settlement mortality
on the distribution pattern and abundance of the spirorbid tube worm Neodex-iospira brasiliensis(Grube) (Polychaeta) living on seagrass leaves.Marine Ecology 20:251–272DOI 10.1046/j.1439-0485.1999.2034075.x.
Harley CDG. 2006.Effects of physical ecosystem engineering and herbivory on
intertidal community structure.Marine Ecology Progress Series317:29–39 DOI 10.3354/meps317029.
Harley CDG, Hughes AR, Hulgren KM, Miner BG, Sorte CJB, Thornber CS, Rodriguez
LF, Tomanek L, Williams SL. 2006.The impacts of climate change in coastal marine
Hasegawa N, Hori M, Mukai H. 2007.Seasonal shifts in seagrass bed primary producers in a cold-temperate estuary: dynamics of eelgrassZostera marinaand associated epiphytic algae.Aquatic Botany 86:337–345DOI 10.1016/j.aquabot.2006.12.002.
Heck Jr KL, Hays G, Orth RJ. 2003.Critical evaluation of nursery hypothesis for
seagrasses.Marine Ecology Progress Series253:123–136DOI 10.3354/meps253123.
Heck Jr KL, Pennock JR, Valentine JF, Coen LD, Sklenar SA. 2000.Effects of
nutrient enrichment and small predator density on seagrass ecosystems: an experimental assessment.Limnology and Oceanography45:1041–1057 DOI 10.4319/lo.2000.45.5.1041.
Heck Jr KL, Valentine JF. 2006.Plant–herbivore interactions in seagrass meadows.
Jour-nal of Experimental Marine Biology and Ecology330:420–436 DOI 10.1016/j.jembe.2005.12.044.
Hemminga MA, Duarte CM. 2000.Seagrass ecology. Cambridge: Cambridge University
Press.
Hiebert TC. 2015. Ampithoe lacertosa. In: Hiebert TC, Butler BA, Shanks AL, eds.
Oregon estuarine invertebrates: Rudys’ illustrated guide to common species. 3rd edition. Charleston: University of Oregon Libraries and Oregon Institute of Marine Biology.
Hoegh-Guldberg O, Bruno JF. 2010.The impact of climate change on the world’s
marine ecosystems.Science328:1523–1528DOI 10.1126/science.1189930.
Hovel KA, Fonseca MS, Myer DL, Kenworthy WJ, Whitfield PE. 2002.Effects of
seagrass landscape structure, structural complexity and hydrodynamic regime on macrofaunal densities in North Carolina seagrass beds.Marine Ecology Progress Series 243:11–24DOI 10.3354/meps243011.
Hughes AR, Williams SL, Duarte CM, Heck KL, Waycott M. 2009.Associations of
concern: declining seagrasses and threatened dependent species.Frontiers in Ecology and Evolution7:242–246 DOI 10.1890/080041.
Iizumi H, Taguchi S, Minami T, Mukai H, Maekawa S. 1996.Distribution and variability
of nutrients, chlorophyll a, particulate organic matters, and their carbon and nitrogen contents, in Akkeshi-ko, an estuary in northern Japan.Bulletin of the Hokkaido National Fisheries Research Institute59:43–67.
Imajima M (ed.) 1996.Polychaetous Annelids. Tokyo: Aquabiology.
Imajima M (ed.) 2001.Polychaetous Annelids II. Tokyo: Aquabiology.
Jernakoff P, Brearley A, Nielsen J. 1996.Factors affecting grazer-epiphyte interactions in
temperate seagrass meadows.Oceanography and Marine Biology: An Annual Review 34:109–162.
Kanamori M, Goshima S, Mukai H. 2004.Seasonal variation in host utilization of
epiphytic Lacuna species in mixed algal and surfgrass stands in Japan.Marine Ecology 25:51–69DOI 10.1111/j.1439-0485.2004.00014.x.
Kasim M, Mukai H. 2006.Contribution of benthic and epiphytic diatoms to clam and
Kuznetsova A, Brockhoff PB, Christensen RHB. 2014.lmerTest: tests for random and fixed effects for linear mixed effect models (lmer objects of lme4 package). R package version 2.0–11.
Lee SY, Fong CW, Wu RSS. 2001.The effects of seagrass (Zostera japonica) canopy
structure on associated fauna: a study using artificial seagrass units and sampling of natural beds.Journal of Experimental Marine Biology and Ecology259:23–50 DOI 10.1016/S0022-0981(01)00221-0.
Lefcheck JS, Van Montfrans J, Orth RJ, Schmitt EL, Duffy JE, Luckenbach MW.
2014.Epifaunal invertebrates as predators of juvenile bay scallops (Argopecten
irradians).Journal of Experimental Marine Biology and Ecology454:18–25 DOI 10.1016/j.jembe.2014.01.014.
Long HA, Grosholz ED. 2015.Overgrowth of eelgrass by the invasive colonial tunicate
Didemnum vexillum: consequences for tunicate and eelgrass growth and epifauna abundance.Journal of Experimental Marine Biology and Ecology473:188–194 DOI 10.1016/j.jembe.2015.08.014.
Marchini A, Sorbe J, Torelli F, Lodola A. 2014.The non-indigenousParanthura japonica
Richardson, 1909 in the Mediterranean Sea : travelling with shellfish?Mediterranean Marine Science15:545–553DOI 10.12681/mms.779.
Maxwell PS, Eklöf JS, Van Katwijk MM, O’Brien KR, De la Torre-Castro M, Boström C, Bouma TJ, Krause-Jensen D, Unsworth RKF, Van Tussenbroek BI, Van der
Heide T. 2016.The fundamental role of ecological feedback mechanisms in seagrass
ecosystems—a review.Biological ReviewsDOI 10.1111/brv.12294.
Meager JJ, Schlacher TA, Green M. 2011.Topographic complexity and landscape
temperature patterns create a dynamic habitat structure on a rocky intertidal shore. Marine Ecology Progress Series428:1–12DOI 10.3354/meps09124.
Nakamachi T, Ishida H, Hirohashi N. 2015.Sound production in the aquatic isopod
Cymodoce japonica(Crustacea:Peracarida).The Biological Bulletin229:167–172 DOI 10.1086/BBLv229n2p167.
Nishimura S (ed.) 1992.Guide to seashore animals of Japan with color pictures and keys,
vol. 1. Osaka: Hoikusha (in Japanese).
Nishimura S (ed.) 1995.Guide to seashore animals of Japan with color pictures and keys,
vol. 2. Osaka: Hoikusha (in Japanese).
Nordlund LM, Koch EW, Barbier EB, Creed JC. 2016.Seagrass ecosystem services and
their variability across Genera and geographical regions.PLOS ONE11:e0163091 DOI 10.1371/journal.pone.0163091.
Okutani T. 2000.Marine mollusks in Japan. Tokyo: University of Tokyo Press.
Östman Ö, Eklöf J, Eriksson BK, Olsson J, Moksnes PO, Bergström U. 2016.Topdown
control as important as nutrient enrichment for eutrophication effects in North Atlantic coastal ecosystems.Journal of Applied Ecology53:1138–1147
DOI 10.1111/1365-2664.12654.
Poore AGB, Campbell AH, Coleman RA, Edgar GJ, Jormalainen V, Reynolds PL, Sotka
in the impact of marine herbivores on benthic primary producers.Ecology Letters 15:912–922DOI 10.1111/j.1461-0248.2012.01804.x.
R Development Core Team. 2015.R: a language and environment for statistical
computing. Vienna: R Foundation for Statistical Computing.
Robbins BD, Bell SS. 1994.Seagrass landscapes: a terrestrial approach to the marine
subtidal environment.Trends in Ecology and Evolution9:301–304 DOI 10.1016/0169-5347(94)90041-8.
Sawamura M. 1999.One-year comparison of stomach contents among demersal fishes
off the coast of Usujiri, Hokkaido.Japanese Journal of Benthology54:14–23 (in Japanese with English abstract)DOI 10.5179/benthos.54.14.
Somero GN. 2002.Thermal physiology and vertical zonation of intertidal animals:
optima, limits, and costs of living.Integrative and Comparative Biology42:780–789 DOI 10.1093/icb/42.4.780.
Sudo H, Azeta M. 1992.Selective predation on mature maleByblis japonicas
(Am-phipoda: Gammaridea) by the barface cardinalfish,Apogon semilineatus.Marine Biology114:211–217DOI 10.1007/BF00349521.
Suh HL, Yu OH. 1997.Winter zonation of the benthic amphipods in the sandy shore surf
zone of Dolsando, southern Korea (in Korean with English abstract).Korean Journal of Fisheries and Aquatic Sciences30:340–348.
Thomsen MS. 2010.Experimental evidence for positive effects of invasive seaweed
on native invertebrates via habitat-formation in a seagrass bed.Aquatic Invasions 5:341–346DOI 10.3391/ai.2010.5.4.02.
Toyohara T, Nakaoka M, Tsuchida E. 2001.Population dynamics and life history traits
ofSiphonacmea oblongataYokohama on seagrass leaf in Otsuchi Bay (Siphonariidae, Pulamonata).Venus (Jap. J. Malaco)60:27–36.
Unsworth RKF, Collier CJ, Waycott M, Mckenzie LJ, Cullen-Unsworth LC. 2015.
A framework for the resilience of seagrass ecosystems.Marine Pollution Bulletin 100:34–46DOI 10.1016/j.marpolbul.2015.08.016.
Valentine JF, Duffy JE. 2006. The central role of grazing in seagrass ecology. In: Larkum
AWD, Orth RJ, Duarte CM, eds.Seagrasses: biology, ecology, and conservation. The Netherlands: Springer, 463–501.
Valentine JF, Heck Jr KL. 1999.Seagrass herbivory: evidence for the continued grazing of
marine grasses.Marine Ecology Progress Series176:291–302 DOI 10.3354/meps176291.
Watanabe K, Minami T, Iizumi H, Imamura S. 1996.Interspecific relationship by
com-position of stomach contents of fish at Akkeshi-ko, an estuary at eastern Hokkaido, Japan (in Japanese with English abstract).Bulletin of the Hokkaido National Fisheries Research Institute60:239–276.
Watanabe M, Nakaoka M, Mukai H. 2005.Seasonal variation in vegetative growth and
Whalen MA, Duffy JE, Grace JB. 2013.Temporal shifts in top-down vs. bottom-up control of epiphytic algae in a seagrass ecosystem.Ecology94:510–520
DOI 10.1890/12-0156.1.
Yamada K, Hori M, Tanaka Y, Hasegawa N, Nakaoka M. 2007b.Temporal and spatial
macrofaunal community changes along a salinity gradient in seagrass meadows of Akkeshi-ko estuary and Akkeshi Bay, northern Japan.Hydrobiologia592:345–358 DOI 10.1007/s10750-007-0767-6.
Yamada K, Hori M, Tanaka Y, Hasegawa N, Nakaoka M. 2010.Contribution of
different functional groups to the diet of major predatory fishes at a seagrass meadow in northeastern Japan.Estuarine, Coastal and Shelf Science86:71–82 DOI 10.1016/j.ecss.2009.10.015.
Yamada K, Takahashi K, Vallet C, Taguchi S, Toda T. 2007a.Distribution, life history,
and production of three species ofNeomysisin Akkeshi-ko estuary, northern Japan. Marine Biology 150:905–917DOI 10.1007/s00227-006-0403-4.
Ysebaert T, Herman PMJ, Meire P, Craeymeersch J, Verbeek H, Heip CHR. 2003.
Large-scale spatial patterns in estuaries: estuarine macrobenthic communities in the Schelde estuary, NW Europe.Estuarine, Coastal and Shelf Science57:335–355 DOI 10.1016/S0272-7714(02)00359-1.
Yu OH, Jeong SJ, Suh HL. 2008.Reproductive pattern of the epifaunal amphipod
Pontogeneia rostrata(Crustacea) on Dolsando Sandy Shore in Korea.Ocean Science Journal 43:127–133DOI 10.1007/BF03020693.
Yu OH, Suh HL. 2011.Secondary production of the eusirid amphipodPontogeneia
rostrataGurjanova, 1938 (Crustacea: Peracarida) on a sandy shore in Korea.Ocean Science Journal46:211–217DOI 10.1007/s12601-011-0017-8.
Zuur AF, Ieno EN, Walker N, Saveliev AA, Smith GM. 2009.Mixed effects models and