Morphological variation in a secondary contact between divergent lineages of
brown trout (
Salmo trutta
) from the Iberian Peninsula
Miguel Hermida, Eduardo San Miguel, Carmen Bouza, Jaime Castro and Paulino Martínez
Departamento de Genética, Facultad Veterinaria, Universidad de Santiago de Compostela, Lugo, Spain.
Abstract
The aim of this study was to analyze the morphological variation of brown trout (Salmo trutta) in the Duero basin, an Atlantic river basin in the Iberian Peninsula, where a spatial segregation of two divergent lineages was previously re-ported, based on isozyme, microsatellite and mtDNA data. In these studies, two divergent pure regions (Pisuerga and Lower-course) and several hybrid populations between them were identified. Morphological variation was evalu-ated in 11 populations representative of the genetic differentiation previously observed in the Duero basin, using multivariate analysis on 12 morphometric and 4 meristic traits. A large differentiation between populations was ob-served (interpopulation component of variance: 41.8%), similar to that previously detected with allozymes and microsatellites. Morphometric differentiation was also reflected by the high classification success of pure and hybrid individuals to their respective populations, using multivariate discriminant functions (94.1% and 79.0%, respec-tively). All multivariate and clustering analyses performed demonstrated a strong differentiation between the pure re-gions. The hybrid populations, though showing large differentiation among them, evidenced an intermediate position between the pure samples. Head and body shape traits were the most discriminant among the morphometric charac-ters, while pectoral rays and gillrakers were the most discriminant among the meristic traits. These results confirmed the high divergence of the brown trout from the Duero basin and suggest some traits on which selection could be act-ing to explain the spatial segregation observed.
Key words:brown trout, secondary contact, morphometric, meristic, multivariate analysis. Received: February 18, 2008; Accepted: August 12, 2008.
Introduction
The brown trout (Salmo trutta) is one of the most well
researched European fish. It is also one of the vertebrate species with highest genetic subdivision (Ferguson, 1989). A pronounced genetic differentiation has been reported both at the microgeographic scale (Ryman, 1983; Crozier and Ferguson, 1986; Bouzaet al., 1999) and along the
geo-graphic distribution range in this species. Five main phylo-geographic lineages have been soundly identified using nuclear and mitochondrial DNA markers: Atlantic (AT), Mediterranean (ME), Adriatic (AD), Marmoratus (MA) and Danubian (DA) (Bernatchez, 2001; Presaet al., 2002).
A sixth lineage (Duero: DU) was recently identified, re-stricted to the Duero and Miño basins in the Atlantic slope of the Iberian Peninsula (Suárezet al., 2001; Bouzaet al.,
2008). These lineages exhibited a strong spatial partition-ing and seemed to have evolved in allopatry with limited introgression among them, though some evidence of hy-bridization and introgression was revealed when studying the rDNA ITS1 (Internal Transcribed Spacer 1) (Presaet al., 2002).
The Iberian Peninsula was one of the main glacial ref-uges during the Quaternary (Hewitt, 1996; Willis and Whit-taker, 2000). The Duero basin, the largest river drainage in the Iberian Peninsula, drains to its Atlantic slope and shows specific biogeographic characteristics. Remarkable differ-ences related with primary resources, slope, river flow and annual flow regime have been reported associated to north-ern and southnorth-ern drainage areas (Arenillas Parra and Sáenz Ridruejo, 1987). A parapatric differentiation based on iso-zymes was reported in brown trout from Duero by Bouzaet al.(2001). According to this information, two highly
diver-gent genetic groups appeared segregated in northern and southern areas, with the highest divergence located at the Pisuerga tributary and the Lower-course (pure regions). However, a subsequent microsatellite and mtDNA survey in the same area suggested a slightly different scenario, with the same highly divergent pure regions, but with hy-brid populations showing a more disperse and complex pat-tern (Martínezet al., 2007). The location of the AT and DU mtDNA lineages, respectively, in the Lower-course and Pisuerga pure regions, suggested a secondary contact be-tween both lineages after the last glaciation. The similar spatial segregation of AT and DU lineages in the Miño ba-sin, a neighbour drainage located northwards, gives addi-www.sbg.org.br
Send correspondence to Paulino Martínez. Departamento de Ge-nética, Facultad de Veterinaria, Universidad de Santiago de Com-postela, 27002 Lugo, Spain. E-mail: paulino.martinez@usc.es.
tional support to this hypothesis (Bouza et al., 2008).
Considering the time of divergence suggested for AT and DU lineages in the mid-upper Pleistocene (Bouza et al.,
2001; Suárezet al., 2001) and the restriction of the DU
lin-eage to NW Iberia, it is likely that other secondary contacts could have taken place in interglacial periods across the Quaternary (Martínezet al., 2007).
Morphological characters are recommended for studying hybrid zones, especially in combination with ge-netic data (Campton, 1987; Barton and Hewitt, 1989). The analysis of morphological variation has been widely used by ichthyologists to differentiate species, lineages or popu-lations within species (e.g., Ihssen et al., 1981; MacCrimmon and Claytor, 1985; Murta, 2000; Hermidaet al., 2005; Turanet al., 2006). In brown trout, morphologi-cal, life-history or behavioural traits have sometimes dem-onstrated to be correlated with genetic differentiation (Ferguson and Mason, 1981; Giuffraet al., 1994; 1996; Largiadèr and Scholl, 1996). However, some subspecies described based on morphological traits were attributed to environmental plasticity (Bernatchez, 2001). Morphologi-cal characters have the limitation of their polygenic basis and environmental influence. However, natural selection acts on the phenotype, and quantitative traits are essential to explain adaptation and evolutionary significant variation (Reed and Frankham, 2001). The lack or low correlation between neutral genetic markers, commonly used to iden-tify genetic resources, and quantitative traits have advised to use both genetic and quantitative data to identify biologi-cal resources (Crandallet al., 2000; Reed and Frankham, 2001; Cavers et al., 2005). Such information facilitates management strategies for conserving biodiversity. The most suitable approach for analyzing morphological varia-tion is the use of multivariate analysis on a wide set of morphometric and meristic traits. These multivariate meth-ods have proven to be efficient tools for stock identification in management programs and for investigating taxonomic problems in sympatric populations of brown trout (Caw-dery and Ferguson, 1988; Karakousiset al., 1991; Aparicio
et al., 2005).
In the present work, brown trout populations from the Duero basin were studied using morphometric and meristic traits commonly applied in salmonids, to evaluate morpho-logical variation in a secondary contact between divergent lineages. By contrasting morphological information with previous molecular findings we made an attempt to obtain a global and congruent explanation for the genetic segrega-tion of highly divergent lineages of this species in the NW Iberian Peninsula.
Materials and Methods
Sampling
Eleven samples of brown trout were collected by electro-fishing between autumn 2001 and spring 2002 from
the Duero basin (Table 1; Figure 1). The sampling points were selected according to the following criteria: i) the na-tive origin of the fish analyzed [both previous stocking and genetic information of sampling points were used to con-firm the native condition of fish (Bouzaet al., 2001;
Martí-nezet al., 2007)]; ii) to obtain the most reliable picture of
the morphological variation in this river basin, considering the main regions previously reported using different ge-netic markers (Bouzaet al., 2001: Martínezet al., 2007).
Accordingly, sampling included the pure regions (P1 and P2 from Pisuerga; AG1 and AG2 from the Lower-course) and hybrid populations (CA, CE, ES, NE, OM, TO and RI). These sampling points had been previously analyzed using isozymes, microsatellites and mtDNA. Sample codes are the same as in Martínezet al.(2007).
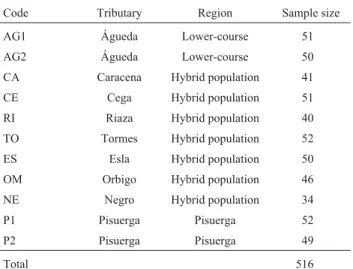
Table 1- Codes and sampling characteristics of the 11 brown trout popu-lations from the Duero basin.
Code Tributary Region Sample size AG1 Águeda Lower-course 51 AG2 Águeda Lower-course 50 CA Caracena Hybrid population 41 CE Cega Hybrid population 51 RI Riaza Hybrid population 40 TO Tormes Hybrid population 52 ES Esla Hybrid population 50 OM Orbigo Hybrid population 46 NE Negro Hybrid population 34 P1 Pisuerga Pisuerga 52 P2 Pisuerga Pisuerga 49
Total 516
Figure 1- Location of the 11 sampling sites in the Duero basin (Iberian
Morphological analysis
Trout were sacrificed by an overdose of anaesthetic (ethylene glycol monophenyl ether). Twelve morphometric and four meristic characters were measured on fresh speci-mens shortly after death. The morphometric characters in-cluded caudal peduncle, body and head depth, eye diameter, distance between pectoral and pelvic fin, distance between pelvic and anal fin, maximum body width at the level of the dorsal fin origin, maximum gape width at the level of the posterior end of the maxilla, head and jaw lengths, and preorbital and postorbital distances. All mea-surements were taken to the nearest 0.01 mm, using a digi-tal calliper. Before analysis, all morphometric measures were standardized according to the following expression:
logYij¢ =logYij -( (logbj Xi-logX))
whereYij’ is the adjusted value of character j for individual
i,Yijis the original value,bjthe allometric coefficient (the slope of the relationship between logXiand logYij),Xithe standard length of individuali, andXa rounded-up mean of
standard length from all samples (150 mm). The standard length is the length of fish measured from the tip of the snout to the posterior end of the midlateral portion of the hypural plate. Standardization of all morphometric mea-surements minimizes variability resulting from allometric growth and differences in mean size of individuals among populations (Reist, 1985). This correction is crucial in stud-ies where the variation in mean size between samples due to different ecological features or biased sampling is relevant, as could be the case of the RI sample in our study.
The meristic counts included the number of gillra-kers, pectoral and pelvic fin rays, and vertebrae. Counts of meristic bilateral traits were computed as the mean values from both body sides. All meristic traits were counted un-der a binocular microscope. The vertebrae were the last character counted, after scraping off muscle tissue. Sepa-rate analyses were conducted on the morphometric and meristic data, because these variables differ both statisti-cally and biologistatisti-cally (Ihssenet al., 1981). Sex was
deter-mined by visual inspection of the gonads.
A global estimation of divergence for each character between all populations was obtained by analysis of the variance. The mean relative interpopulation component of the variance was obtained both for morphometric and meristic traits. To analyze the cause of the global diver-gence, pairwise Tukey post-hoc tests were carried out for each character and population pair.
Principal component analysis (PCA) of variance-covariance matrix on morphometric and meristic variables was firstly used to reveal patterns of geographic variation between samples. For this analysis, the populations from Pisuerga (P1 and P2) and Lower-course (AG1 and AG2) were pooled, to obtain a single reference from each pure re-gion. Components with eigenvalues > 1 were selected and scores of the loading matrix after varimax rotation
evalu-ated. Centroid scores derived from the most informative principal components in each data set were labelled and plotted against.
Multiple discriminant analysis (MDA) was applied to the pure regions (Pisuerga and Lower-course) to get a discriminant function based on morphometric measure-ments. A classification matrix was constructed by assign-ing specimens to populations, on the basis of the linear combination of variables from the discriminant function. The jackknife method was used because it partially re-moves the bias inherent in classifying cases into groups that were used to define them (Tabachnick and Fidell, 1996). Then, this discriminant formula was used to compute ca-nonical scores based on measurements from the hybrid samples, for comparing the values of pure regions with those of the hybrid populations. Diagram plots were used to display discriminant scores of each sample with respect to pure regions.
In addition, to assess the similarity between the hy-brid populations, a second discriminant analysis was per-formed, using morphometric characters only from these populations. A classification matrix (jackknife method) was constructed by assigning specimens to populations, based on the linear combination of variables from each discriminant function. These discriminant functions were employed again to compute canonical scores, based on measurements from the two pure regions. A cluster analysis (Ward’s method using Euclidean distance) was used to show the degree of similarity among the hybrid populations according to discriminant scores, using the group of cen-troids for each discriminant function as variables. Centroid groups from Lower-course and Pisuerga regions were added to the cluster analysis, to show their position with re-spect to other groups.
The same procedure described above was also ap-plied to the meristic traits. However, the differentiation be-tween pure regions was not so clear, and multivariate discriminant analysis was then applied to all populations together. As in the other cases, a classification matrix (jack-knife method) was constructed and a cluster analysis (Ward’s method using Euclidean distance) was used to show the degree of similarity among the different groups.
Results
non-significant (NS) tests: 37.8%) that appeared evenly distrib-uted across pairwise comparisons and traits. However, ac-cording to the number of significant test results obtained, three characters contributed in a higher proportion to the observed variation: head length: p < 0.001: 69.4%; NS: 25%; eye diameter: p < 0.001: 58.3%; NS: 25%; and body depth: p < 0.001: 63.9%; NS: 25%. Also, the Lower-course sample showed a stronger differentiation than the other samples (p < 0.001: 65.6%; NS: 22.9%). No significant dif-ferences between sexes were observed (ANOVA, p > 0.05 for all traits and samples). Main descriptive statistics for all morphometric and meristic traits can be found as Supple-mentary material (Table S1).
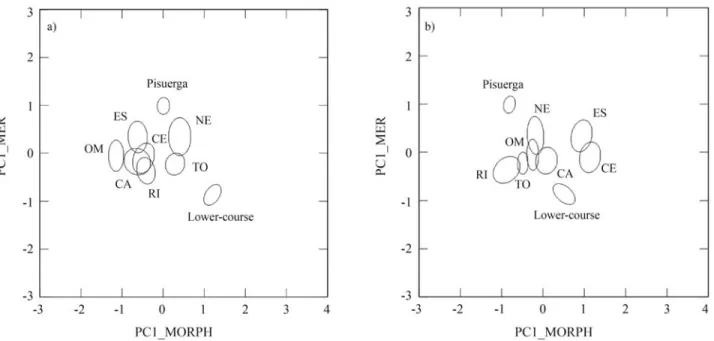
PCA on morphometric characters extracted three fac-tors explaining 64.3% of the variance in the data (36.5%, 16.9% and 10.8%, respectively). The first component was related with several measures of the head (head depth, eye diameter, head and jaw lengths, preorbital and postorbital distance), whereas the second one was associated with traits related to body shape (caudal peduncle depth, body depth and body width) (Table 3). These two components showed no correlation with size (standard length; r = -0.04, p = 0.32; and r = -0.02, p = 0.62, respectively). The meristic counts were summarized in two principal components, ac-counting for 34.9% and 26.0% of explained variance, re-spectively. The number of gillrakers and pectoral fin rays was associated with the first component and the number of vertebrae and pelvic rays with the second one (Table 3). Plotting meristic PC1 on morphometric PC1 and PC2
evi-denced a large heterogeneity among populations in the Duero basin (Figure 2). Pisuerga and Lower-course (pure regions) were the samples with the highest divergence when considering both plots. Some hybrid population pairs, like RI-ES or RI-CE, evidenced a similar divergence when plotting PC1-meristic against PC2-morphometric components (Figure 2b), but this divergence was much lower in the first plot (Figure 2a). The divergence between pure samples was mainly due to the meristic PC1, although both morphometric components revealed notable differ-ences between the pure samples. The Lower-course sample showed a remarkable separation from the other ones, when comparing both PC1 components. As PCA does not require
a priorigrouping of the data, this assumption-free ordina-tion of data justified the starting point hypothesis in the MDA analysis, to say that the pure samples constituted the extremes of the morphological range in the Duero basin.
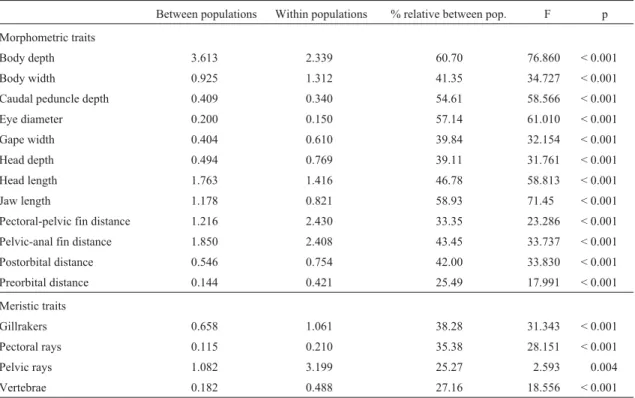
The MDA using morphometric traits provided an al-most complete segregation between the Lower-course and the Pisuerga samples, showing a clear-cut difference be-tween the discriminant scores (Lower-course mean: 1.56, S.D.: 1.05; Pisuerga mean: -1.56, S.D.: 0.95). The most sa-lient traits to discriminate pure samples were jaw length, head length and head depth (Table 3). Application of this discriminant function yielded a percentage of 94.1% of in-dividuals correctly classified to their sample using the jack-knife procedure. The discriminant scores computed for hybrid populations showed intermediate values between the pure regions in five out of seven samples (TO, mean: Table 2- Analysis of the variance of morphometric and meristic traits in the 11 populations from the Duero basin. Between- and within-populations abso-lute components and relative (%) between-population components are presented.
Between populations Within populations % relative between pop. F p Morphometric traits
Body depth 3.613 2.339 60.70 76.860 < 0.001 Body width 0.925 1.312 41.35 34.727 < 0.001 Caudal peduncle depth 0.409 0.340 54.61 58.566 < 0.001 Eye diameter 0.200 0.150 57.14 61.010 < 0.001 Gape width 0.404 0.610 39.84 32.154 < 0.001 Head depth 0.494 0.769 39.11 31.761 < 0.001 Head length 1.763 1.416 46.78 58.813 < 0.001 Jaw length 1.178 0.821 58.93 71.45 < 0.001 Pectoral-pelvic fin distance 1.216 2.430 33.35 23.286 < 0.001 Pelvic-anal fin distance 1.850 2.408 43.45 33.737 < 0.001 Postorbital distance 0.546 0.754 42.00 33.830 < 0.001 Preorbital distance 0.144 0.421 25.49 17.991 < 0.001 Meristic traits
Gillrakers 0.658 1.061 38.28 31.343 < 0.001 Pectoral rays 0.115 0.210 35.38 28.151 < 0.001
Pelvic rays 1.082 3.199 25.27 2.593 0.004
0.22, S.D.: 1.11; CE, mean: 0.13, S.D.: 1.26; RI, mean: -0.29, S.D.: 1.38; NE, mean: -0.09, S.D.: 1.02; ES, mean: -0.29, S.D.: 1.22). The OM (mean: -1.66, S.D.: 0.92) and specially the CA population (mean: -1.84, S.D.: 1.23) dis-played values beyond the discriminant function of the Pisuerga sample. The mean discriminant value for all hy-brid samples was -0.546, clearly biased toward the score observed in the Pisuerga sample.
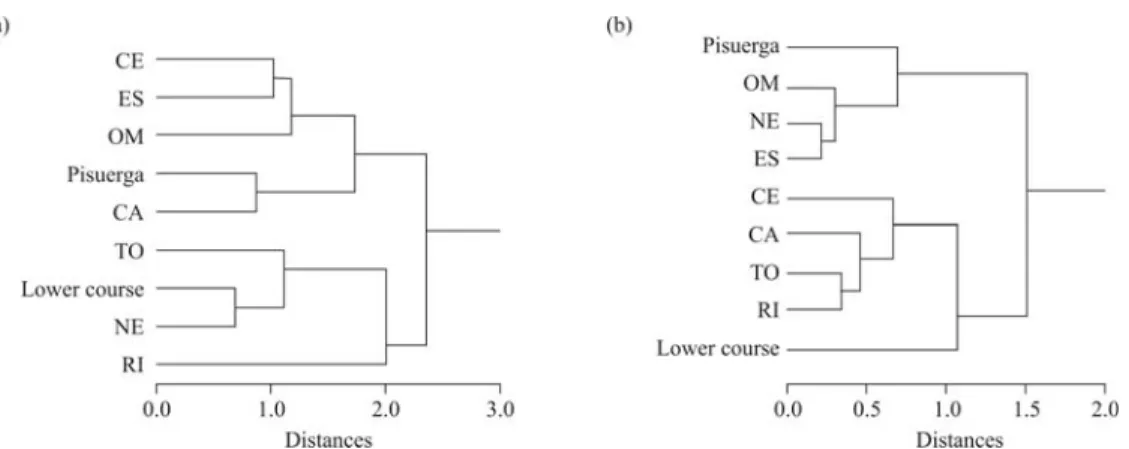
When the discriminant analysis was applied to the morphometric variables in the seven hybrid populations, six statistically significant discriminant functions (p < 0.001 in all cases) were found (Table 3). The first, sec-ond and third discriminant functions contributed to 40.8, 26.5 and 13.3% of the variance, respectively. The first function was mainly associated with body depth and eye di-ameter, the second one was related with head length and distance between pectoral and pelvic fin, and in the third function caudal peduncle depth and body depth were the most important variables. The application of discriminant functions yielded a percentage of 79.0% of individuals cor-rectly classified to their respective population using the jackknife procedure (Table 4). The cluster tree obtained from Euclidean distances between population centroids in-cluding the scores of the pure regions showed two main groups (Figure 3a). The Pisuerga and Lower-course ap-peared clustered in different groups, and the hybrid popula-tions were associated to the Pisuerga (ES, OM, CA, CE) and Lower-course (NE, RI, TO) groups without a particular geographic trend.
Four discriminant functions were obtained from the meristic characters, three of which were statistically signif-icant (p < 0.001; Table 3). Each one of the four traits
ap-peared associated mainly with one function, though the number of gillrakers was also related with the first function. The pectoral rays trait was related with the first function (60.6% of explained variance), vertebrae with the second (29.1%), number of gillrakers with the third (8.8%), and pelvic rays with the fourth (1.5%). With the meristic traits, 41.1% specimens were correctly classified to their respec-tive populations using the jackknife procedure. The dendrogram with discriminant functions as variables using meristic traits showed a remarkable geographic trend, not observed in the morphometric one (Figure 3b). As in the first analysis, the Pisuerga and Lower-course samples were clustered in different groups, but the hybrid populations from the right margin (from upper to lower course) (OM, NE, ES) were associated to Pisuerga and those from the left margin (CE, TO, RI, CA) to Lower-course.
Discussion
The large and significant differentiation among popu-lations observed for all morphological traits studied in brown trout from the Duero basin is in accordance with the high genetic diversity detected previously with isozymes, mtDNA and microsatellites (Bouzaet al., 2001; Martínez et al., 2007). The interpopulation component of the
vari-ance (all characters: 41.80%; morphometric traits: 45.22%; meristic traits: 31.52%) was very similar to the relative ge-netic differentiation component observed for isozymes (Gst= 0.46) and microsatellites (Gst= 0.348; Rst= 0.413).
global differentiation observed. This was in accordance with the high discrimination power of these characters evi-denced by multivariate analyses. Likewise, the high per-centages of individuals correctly classified to their respec-tive samples after the application of discriminant analyses reflected the high morphological differentiation among populations in the Duero basin, as reported using the micro-satellite markers (Martínezet al., 2007). Though the hybrid
populations did not show such a strong differentiation as the pure ones (94.1% classification success), they also dis-played large heterogeneity (79.0% classification success using morphometric traits). Even when meristic characters were used, which involved only four traits with low varia-tion, the classification matrix was not disappointed (41.1%). Finally, it is necessary to keep in mind that the in-fluence of environmental variables on morphological traits (e.g.differences in temperature and oxygen content during
early ontogeny) may contribute to the large variation ob-served.
The multivariate approaches enabled a more detailed analysis for finding out geographic trends in the whole dif-ferentiation observed in the Duero basin. All multivariate (principal component: PCA; discriminant: MDA) analyses and clustering methods consistently showed the highest morphological divergence between the pure regions, Pi-suerga and Lower-course, as previously reported with mo-lecular markers (Bouzaet al., 2001; Martínezet al., 2007).
This differentiation was mainly due to the meristic charac-ters correlated with the first PC1 component, to say the number of pectoral rays and number of gillrakers. The hy-brid populations displayed intermediate values for the MDA discriminant scores, except the CA and OM popula-tions, which showed a mean discriminant value beyond the Pisuerga region. The CA population had also evidenced a hybrid value (admixture proportions; Bertorelle and Excoffier, 1998) beyond the Pisuerga region using micro-satellite data (Martínezet al., 2007). The hybrid
popula-tions showed discriminant values (mean: -0.546) closer to the Pisuerga (-1.560) than to the Lower-course region
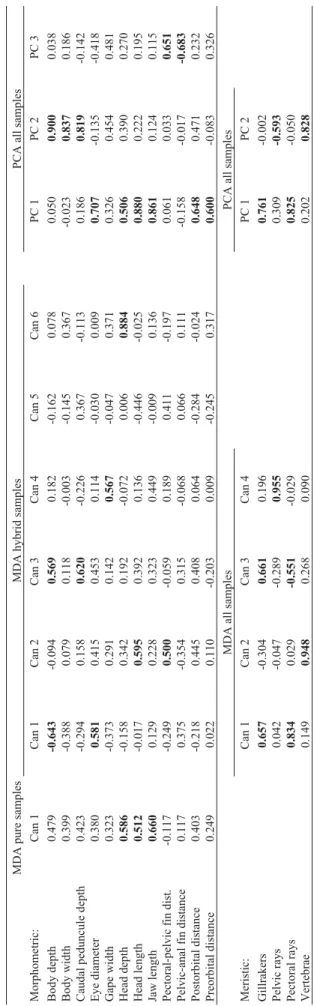
Table 3 -Structure matrix of discriminant loadings and loadings from principal component analysis based on morphometric and meristic traits in Salmo trutta populations from the Duero basin. MDA and PCA co-efficients above 0.500 or below -0.500 appear highlighted in bold. MDA pure samples MDA hybrid samples PCA all samples Morphometric: Can 1 Can 1 Can 2 Can 3 Can 4 Can 5 Can 6 PC 1 PC 2 PC 3 Body depth 0.479 -0.643 -0.094 0.569 0.182 -0.162 0.078 0.050 0.900 0.038 Body width 0.399 -0.388 0.079 0.118 -0.003 -0.145 0.367 -0.023 0.837 0.186 Caudal peduncule depth 0.423 -0.294 0.158 0.620 -0.226 0.367 -0.113 0.186 0.819 -0.142 Eye diameter 0.380 0.581 0.415 0.453 0.114 -0.030 0.009 0.707 -0.135 -0.418 Gape width 0.323 -0.373 0.291 0.142 0.567 -0.047 0.371 0.326 0.454 0.481 Head depth 0.586 -0.158 0.342 0.192 -0.072 0.006 0.884 0.506 0.390 0.270 Head length 0.512 -0.017 0.595 0.392 0.136 -0.446 -0.025 0.880 0.222 0.195 Jaw length 0.660 0.129 0.228 0.323 0.449 -0.009 0.136 0.861 0.124 0.115 Pectoral-pelvic fin dist. -0.117 -0.249 0.500 -0.059 0.189 0.411 -0.197 0.061 0.033 0.651 Pelvic-anal fin distance 0.117 0.375 -0.354 0.315 -0.068 0.066 0.111 -0.158 -0.017 -0.683 Postorbital distance 0.403 -0.218 0.445 0.408 0.064 -0.284 -0.024 0.648 0.471 0.232 Preorbital distance 0.249 0.022 0.110 -0.203 0.009 -0.245 0.317 0.600 -0.083 0.326 MDA all samples PCA all samples Meristic: Can 1 Can 2 Can 3 Can 4 PC 1 PC 2 Gillrakers 0.657 -0.304 0.661 0.196 0.761 -0.002 Pelvic rays 0.042 -0.047 -0.289 0.955 0.309 -0.593 Pectoral rays 0.834 0.029 -0.551 -0.029 0.825 -0.050 Vertebrae 0.149 0.948 0.268 0.090 0.202 0.828
Table 4- Classification matrix applying the discriminant morphometric functions to the seven hybrid populations from the Duero basin. Popula-tion codes from Table 1.
Original group
Predicted group membership (%) Total TO CE RI CA NE ES OM TO 86.5 0.0 1.9 1.9 7.7 0.0 1.9 100 CE 2.0 66.7 0.0 11.8 5.9 7.8 5.9 100 RI 0.0 0.0 85.0 0.0 5.0 2.5 7.5 100 CA 0.0 9.8 0.0 73.2 0.0 4.9 12.2 100 NE 0.0 2.9 0.0 0.0 97.1 0.0 0.0 100 ES 4.0 8.0 0.0 4.0 2.0 66.0 16.0 100 OM 2.2 4.3 0.0 0.0 0.0 8.7 84.8 100
(1.560). This is in accordance with the previous micro-satellite and mtDNA information (Martínezet al., 2007), which evidenced a more relevant presence of the Pisuerga lineage in the Duero basin than previously reported in the study with allozymes (Bouza et al., 2001). Finally, the
Lower-course region appeared as the most highly differen-tiated sample in the PCA analysis, as had also been ob-served with microsatellite markers (Martínezet al., 2007).
The results obtained demonstrate that the genetic dif-ferentiation reported in the Duero basin is associated to morphological variation. Morphological differences in brown trout have sometimes been associated to environ-mental plasticity (Bernatchez, 2001), but in other cases a correlation between both types of variation has been ob-served (Ferguson and Mason, 1981; Giuffraet al., 1994; 1996; Largiadèr and Scholl, 1996). Our data provide in-sights on the main discrimination characters that could be related with specific adaptations to the environmental het-erogeneity reported in the Duero basin (Arenillas-Parra and Sáenz-Ridruejo, 1987). The main morphometric diver-gence between the pure regions was related to head charac-ters, which were highly correlated with the first principal component and the discriminant function. Several traits of head shape (e.g.length of jaw, mouth position or eye
diam-eter) have demonstrated to be related to prey-detecting and handing in different species of fish (Cawdery and Fergu-son, 1988; Ostbyeet al., 2005). According to the loading
matrix, fish from Lower-course had longer jaws and heads and deeper heads than those from Pisuerga. Also, the rele-vance of some body shape variables (body depth, body width and caudal peduncle depth), both in the PCA and MDA analyses, indicate a more robust constitution of the Lower-course trout. Morphology has demonstrated to af-fect swimming ability in salmonids, when comparing dif-ferent species, difdif-ferent populations or even migrating and non-migrating forms (Beacham, 1985; Ojanguren and Braña, 2003). In our study, the differences in meristic traits were mainly due to the number of pectoral rays, as evi-denced by the PCA and MDA analyses. Salmonid juveniles
have been suggested to use the pectoral fins to stabilize themselves when swimming against fast flowing water, so fins are useful to control propulsion (Ojanguren and Braña, 2003). All these differences could reflect adaptations to variable feeding and water-flow regime associated to the northern and southern areas of the Duero basin (Arenillas Parra and Sáenz Ridruejo, 1987).
The morphological variation found in our study is concordant with previous genetic data (Bouzaet al., 2001;
Martínezet al., 2007), confirming the spatial partitioning of
brown trout from the Duero basin after a secondary contact between divergent lineages. The morphological traits re-sponsible for this differentiation could be related with ad-aptation to the variable feeding and water-flow regimes across this large river basin. Selection in a highly heteroge-neous environment could explain the restriction of the DU lineage to the inner part of the Duero basin along most of the Pleistocene.
Acknowledgments
The authors wish to thank Emilio Roy, Juan Carlos Velasco and the Castilla-León Government for their aid in collecting samples and permission for publishing the pres-ent data, and also all the forest guards that made the sam-pling trips possible. We are also in debt with Sonia Gómez, María López and Susana Sánchez for technical assistance. This study was supported by a Spanish Government grant (REN2001-3051) and by a contract with the Castilla-León Government (SC-132/02).
References
Aparicio E, García-Berthou E, Araguas RM, Martínez P and García-Marín JL (2005) Body pigmentation pattern to assess introgression by hatchery stocks in nativeSalmo truttafrom Mediterranean streams. J Fish Biol 67:931-949.
Arenillas Parra M and Sáenz Ridruejo C (1987) Guía Física de España. 3. Los Ríos. Alianza Editorial, Madrid, 386 pp. Barton NH and Hewitt GM (1989) Adaptation, speciation and
hy-brid zone. Nature 341:497-503.
Beacham TD (1985) Meristic and morphometric variation in pink salmon (Oncorhynchus gorbuscha) in southern British Co-lumbia and Puget Sound. Can J Zool 63:366-372.
Bernatchez L (2001) The evolutionary history of brown trout Salmo truttaL. inferred from phylogeographic, nested clade and mismatch analyses of mitochondrial DNA variation. Evolution 55:351-379.
Bertorelle G and Excoffier L (1998) Inferring admixture propor-tions from molecular data. Mol Biol Evol 15:1298-1311. Bouza C, Arias J, Castro J, Sánchez L and Martínez P (1999)
Ge-netic structure of brown trout,Salmo truttaL., at the south-ern limit of the distribution range of the anadromous form. Mol Ecol 8:1991-2001.
Bouza C, Castro J, Sánchez L and Martínez P (2001) Allozymic evidence of parapatric differentiation of brown trout (Salmo truttaL.) within an Atlantic river basin of the Iberian Penin-sula. Mol Ecol 10:1455-1469.
Bouza C, Vilas R, Castro J and Martínez P (2008) Mitochondrial haplotype variability of brown trout populations from Northwestern Iberian Peninsula, a secondary contact area between lineages. Conserv Genet 9:917-920.
Campton DE (1987) Natural hybridization and introgression in fishes. In: Ryman N and Utter F (eds) Population Genetics and Fishery Management, University of Washington Press, Seattle, pp 161-192.
Cavers S, Navarro C, Hopkins R, Ennos RA and Lowe AJ (2005) Regional and population-scale influences on genetic diver-sity partitioning within Costa Rican populations of the pio-neer tree Vochysia ferrugineamart. Silvae Genet 54:258-264.
Cawdery SAH and Ferguson A (1988) Origins and differentiation of three sympatric species of trout (Salmo truttaL.) in Lough Melvin. Pol Arch Hydrobiol 35:267-277.
Crandall KA, Bininda-Emonds ORP, Mace GM and Wayne RK (2000) Considering evolutionary processes in conservation biology. Trends Ecol Evol 15:290-295.
Crozier W and Ferguson A (1986) Electrophoretic examination of the population structure of brown trout, Salmo truttaL., from the Lough Neagh catchment, Northern Ireland. J Fish Biol 28:459-477.
Ferguson A (1989) Genetic differences among brown trout,Salmo trutta, stocks and their importance for the conservation and management of the species. Freshw Biol 21:35-46. Ferguson A and Mason FM (1981) Allozyme evidence for
repro-ductively isolated sympatric populations of brown trout Salmo trutta L. in Lough Melvin, Ireland. J Fish Biol 18:629-642.
Giuffra E, Bernatchez L and Guyomard R (1994). Mitochondrial control region and protein coding genes sequence variation among phenotypic forms of brown trout,Salmo trutta, from Northern Italy. Mol Ecol 3:161-171.
Giuffra E, Guyomard R and Forneris G (1996) Phylogenetic rela-tionships and introgression patterns between incipient para-patric species of Italian brown trout (Salmo truttaL. com-plex). Mol Ecol 5:207-220.
Hermida M, Fernández C, Amaro R and San Miguel E (2005) Morphometric and meristic variation in Galician threespine
stickleback populations, NW Spain. Environ Biol Fish 73:189-200.
Hewitt GM (1996) Some genetic consequences of ice ages, and their role in divergence and speciation. Biol J Linn Soc 58:247-276.
Ihssen PE, Booke HE, Casselman JM, Mcglade JM, Payne NR and Utter FM (1981) Stock identification: Materials and methods. Can J Fish Aquat Sci 38:1838-1855.
Karakousis Y, Triantaphyllidis C and Economidis PS (1991) Mor-phological variability among seven populations of brown trout,Salmo truttaL., in Greece. J Fish Biol 38:807-817. Largiadèr CR and Scholl A (1996) Genetic introgression between
native and introduced brown troutSalmo truttaL. popula-tions in the Rhone River Basin. Mol Ecol 5:417-426. MacCrimmon HR and Claytor RR (1985) Meristic and
morpho-metric identity of Baltic stocks of Atlantic salmon (Salmo salar). Can J Zool 63:2032-2037.
Martínez P, Bouza C, Castro J, Hermida M, Pardo BG and Sán-chez L (2007) Analysis of a secondary contact between di-vergent Atlantic mtDNA lineages of brown trout (Salmo trutta) from Duero basin using microsatellites and mtDNA RFLPs. J Fish Biol 71B:195-213.
Murta AG (2000) Morphological variation of horse mackerel (Trachurus trachurus) in the Iberian and North African At-lantic: Implications for stock identification. ICES J Mar Sci 57:1240-1248.
Ojanguren AF and Braña F (2003) Effects of size and morphology on swimming performance in juvenile brown trout (Salmo truttaL.) Ecol Fresh Fish 12:241-246.
Ostbye K, Naesje TF, Bernatchez L, Sandlund OT and Hindar K (2005). Morphological divergence and origin of sympatric populations of European whitefish (Coregonus lavaretusL.) in Lake Femund, Norway. J Evol Biol 18:683-702. Presa P, Pardo BG, Martínez P and Bernatchez L (2002)
Phylo-geographic congruence between mtDNA and rDNA ITS markers in brown trout. Mol Biol Evol 19:2161-2175. Reed DH and Frankham R (2001) How closely correlated are
mo-lecular and quantitative measures of genetic variation? A meta-analysis. Evolution 55:1095-1103.
Reist JD (1985) An empirical evaluation of several univariate methods that adjust for size variation in morphometric data. Can J Zool 63:1429-1439.
Ryman N (1983) Patterns of distribution of biochemical genetic variation in Salmonids: Differences between species. Aqua-culture 33:1-21.
Suárez J, Bautista JM, Almodovar A and Machordom A (2001) Evolution of the mitochondrial control region in Palaearctic brown trout (Salmo trutta) populations: The biogeographi-cal role of the Iberian Peninsula. Heredity 87:198-206. Tabachnick BG and Fidell LS (2001) Using Multivariate
Statis-tics. 4th edition. Allyn and Bacon Publishers, Boston, 966 pp.
Turan C, Oral M, Öztürk B and Düzgünes E (2006) Morphometric and meristic variation between stocks of Bluefish (Pomatomus saltatrix) in the Black, Marmara, Aegean and northeastern Mediterranean Seas. Fish Res 79:139-147. Willis KJ and Whittaker RJ (2000) The refugial debate. Science
Supplementary Material
The following online material is available for this ar-ticle:
Table S1 - Number of individuals, mean, variance, standard deviation and range for the 12 morphometric and four meristic traits analysed in the nine samples from the Duero basin. The two Lower-course (AG1 and AG2) and
Pisuerga (P1 and P2) populations were pooled in a single Lower-course (AG) and Pisuerga (P) sample (see Material and Methods).
Associate Editor: Fausto Foresti
(see Material and Methods).
Sample Statistics Trait
Standard Length
Body depth
Body width
Caudal peduncle
depth
Eye diameter
Gape width
Head depth
Head length
Jaw length
AG N 101 101 101 101 101 101 101 101 101
Mean 109.8 24.0 12.8 10.7 7.6 9.7 14.3 29.2 14.2
S.D. 42.3 9.7 5.1 4.0 2.0 4.1 5.3 11.4 6.1
Variance 1791.2 93.5 25.9 16.0 4.0 16.9 27.7 129.9 36.9
Minimum 49.3 10.8 5.5 5.0 4.4 4.1 6.9 12.8 6.0
Maximum 205.5 47.2 25.8 20.2 11.4 21.3 27.2 56.3 29.2
CA N 41 41 41 41 41 41 41 41 41
Mean 129.6 28.3 15.4 11.9 7.3 11.5 15.3 31.6 14.2
S.D. 79.4 18.0 9.2 7.4 3.5 7.2 8.5 18.5 8.9
Variance 6309.8 325.5 84.5 55.5 12.0 51.5 72.5 342.6 78.3
Minimum 46.7 9.1 5.4 4.2 3.4 4.2 6.3 12.3 5.0
Maximum 245.2 59.1 29.5 22.9 12.1 25.6 30.5 59.9 30.3
CE N 51 51 51 51 51 51 51 51 51
Mean 116.4 27.2 14.3 11.8 7.3 10.7 14.6 29.2 13.4
S.D. 39.3 9.8 5.1 3.9 1.7 3.8 4.5 9.3 4.7
Variance 1545.1 96.0 25.9 15.4 3.0 14.5 20.0 85.9 21.9
Minimum 51.4 10.6 6.6 5.1 4.2 5.1 6.7 13.6 5.6
Maximum 196.5 47.6 24.8 19.1 10.5 18.8 23.1 48.2 23.8
RI N 40 40 40 40 40 40 40 40 40
Mean 62.2 11.8 6.6 5.6 5.2 5.4 8.3 16.8 7.4
S.D. 14.4 3.1 1.6 1.3 0.8 1.1 1.6 3.3 1.6
Variance 207.2 9.4 2.5 1.8 0.7 1.3 2.5 10.6 2.6
Minimum 43.8 7.6 4.0 4.0 3.9 3.9 5.8 12.7 5.0
Maximum 101.1 19.7 10.4 9.1 7.1 8.7 12.1 25.6 11.3
TO N 52 52 52 52 52 52 52 52 52
Mean 126.1 25.8 14.4 12.2 8.5 10.7 16.1 32.2 14.5
S.D. 30.0 6.3 3.6 3.0 1.4 2.8 3.6 7.2 3.6
Variance 898.5 40.3 12.6 9.2 2.0 8.0 13.1 52.0 13.1
Minimum 84.0 16.5 9.7 7.7 6.7 7.2 11.4 22.4 9.9
fin distance fin distance distance distance rays rays
ES N 50 50 50 50 50 50 50 50 50
Mean 160.7 37.4 19.7 15.9 8.9 13.5 19.3 38.8 17.1
S.D. 45.3 10.9 5.5 4.4 1.7 3.8 4.6 9.9 4.6
Variance 2047.9 119.2 30.7 19.1 2.9 14.4 21.3 98.2 21.5
Minimum 84.2 18.3 10.3 8.2 5.6 8.1 12.6 21.3 9.1
Maximum 247.5 57.8 30.3 24.6 12.5 21.2 30.0 57.1 26.6
OM N 46 46 46 46 46 46 46 46 46
Mean 129.1 27.2 14.5 12.5 7.8 10.2 14.9 30.6 13.7
S.D. 40.7 9.9 4.8 4.1 1.5 3.2 3.8 8.5 4.0
Variance 1656.1 98.0 23.4 16.6 2.3 10.2 14.7 72.2 15.8
Minimum 58.1 10.8 6.7 5.2 4.7 4.5 7.8 14.9 6,3
Maximum 236.5 53.6 27.8 22.6 11.4 19.0 24.9 51.2 23,5
NE N 34 34 34 34 34 34 34 34 34
Mean 156.3 33.9 17.4 15.3 10.1 13.4 18.3 40.2 18,4
S.D. 35.7 8.6 4.1 3.8 1.9 3.9 4.1 9.4 4,8
Variance 1271.9 73.5 16.5 14.3 3.5 15.1 17.1 88.9 23,4
Minimum 93.6 19.0 10.0 8.9 6.5 6.6 10.3 23.0 9,9
Maximum 225.5 52.7 26.4 23.6 13.8 21.6 27.5 61.9 30,1
P N 101 101 101 101 101 101 101 101 101
Mean 136.8 27.9 14.9 12.6 8.3 11.1 16.0 34.1 15,9
S.D. 27.3 6.3 3.1 2.5 1.2 2.3 2.8 6.4 3,4
Variance 746.0 39.4 9.9 6.4 1.4 5.1 7.9 40.7 11,6
Minimum 67.3 12.6 7.0 6.2 5.0 5.7 8.3 17.1 7,3
Maximum 210.3 44.6 22.9 18.6 11.1 17.3 22.9 49.3 24,9
AG N 101 101 101 101 101 101 101 101
Mean 34.4 22.5 15.5 6.9 12.8 9.0 21.7 57.1
S.D. 14.2 8.3 6.4 3.2 0.5 0.2 1.5 0.7
Variance 202.6 69.1 40.5 10.3 0.2 0.0 2.2 0.5
Minimum 14.0 9.4 6.6 2.4 12.0 8.5 10.5 55.0
Maximum 69.9 40.2 30.6 15.8 14.0 9.5 24.0 59.0
CA N 41 41 41 41 41 41 41 41
Mean 41.2 26.0 17.2 8.0 13.2 9.0 22.0 58.5
S.D. 25.5 16.5 10.4 5.4 0.4 0.2 1.1 0.5
fin distance fin distance distance distance rays rays
Minimum 15.0 8.7 6.7 2.2 12.5 8.5 20.0 58.0
Maximum 77.1 51.2 33.5 18.8 14.0 9.0 24.0 59.0
CE N 51 51 51 51 51 51 51 51
Mean 37.0 24.3 16.0 6.6 13.4 9.1 21.6 58.1
S.D. 13.4 8.7 5.5 2.4 0.5 0.3 1.1 0.8
Variance 179.9 75.8 30.3 5.7 0.3 0.1 1.2 0.7
Minimum 16.2 9.6 6.8 3.0 12.0 8.5 19.0 56.0
Maximum 64.4 44.0 28.6 12.2 14.0 10.0 24.0 60.0
RI N 40 40 40 40 40 39 40 40
Mean 18.9 12.6 8.6 4.0 13.1 8.9 22.1 58.0
S.D. 4.3 3.5 1.8 0.9 0.4 0.2 0.9 0.7
Variance 18.4 12.1 3.2 0.8 0.2 0.0 0.9 0.5
Minimum 13.8 7.3 6.3 2.9 12.0 8.0 20.0 56.0
Maximum 31.0 22.0 14.0 6.3 14.0 9.5 24.0 59.0
TO N 52 52 52 52 52 52 52 52
Mean 40.4 26.4 17.1 7.5 13.0 9.0 22.5 58.1
S.D. 9.9 6.7 4.3 1.9 0.4 0.1 1.2 0.6
Variance 98.2 44.9 18.7 3.5 0.1 0.0 1.3 0.4
Minimum 27.2 17.6 11.1 5.3 12.0 9.0 20.0 57.0
Maximum 66.9 47.7 28.1 12.0 14.0 9.5 26.0 59.0
ES N 50 50 50 50 50 50 50 50
Mean 49.5 34.4 21.6 9.4 13.4 9.0 23.0 57.5
S.D. 14.3 10.3 5.9 2.7 0.6 0.1 1.2 1.0
Variance 205.2 105.2 34.6 7.4 0.3 0.0 1.5 0.9
Minimum 25.8 16.1 11.7 4.6 12.0 9.0 21.0 53.0
Maximum 78.7 53.6 34.0 16.4 14.0 10.0 25.5 59.0
OM N 46 46 46 46 46 46 46 46
Mean 40.1 27.7 16.6 7.3 13.3 9.0 22.4 57.6
S.D. 13.4 9.0 5.1 2.3 0.5 0.1 1.1 0.5
Variance 180.8 81.5 25.8 5.1 0.2 0.0 1.3 0.3
Minimum 17.9 11,8 7.2 3.1 12.0 9,0 19.0 57.0
fin distance fin distance distance distance rays rays
NE N 34 34 34 34 34 34 34 34
Mean 48.6 33.8 21.8 9.1 13.5 9.0 22.7 57.7
S.D. 11,3 7.5 5.4 2.3 0.5 0.2 1.0 0.8
Variance 126,6 55.8 29.4 5.4 0.3 0.0 0.9 0.6
Minimum 28.6 20.4 11.8 5.4 12.5 9.0 21.0 56.0
Maximum 70,7 51.4 34.5 15.0 14,5 10.0 25.0 59.0
P N 101 101 101 101 101 101 101 101
Mean 43.3 27,2 18.3 8.0 13.8 9.0 23.6 57.6
S.D. 9,0 6.0 3.6 1.9 0.4 0.2 1.3 0.7
Variance 80.5 36,1 13.2 3.5 0.1 0.0 1.7 0.4
Minimum 22,3 11.7 9.2 3.7 13.0 8.0 20.5 56.0