Identification of inhomogeneities in precipitation time series using
SUR models and the Ellipse test
Ana Cristina M. Costa1 and Amílcar Soares2
1 Instituto Superior de Estatística e Gestão de Informação, Universidade Nova de Lisboa Campus de Campolide, 1070-312 Lisboa, Portugal
Tel.: + 351 213 870 413; Fax: + 351 213 872 140 [email protected]
2 Instituto Superior Técnico, Universidade Técnica de Lisboa Av. Rovisco Pais, 1049-001 Lisboa, Portugal
Tel.: + 351 218 417 444; Fax: + 351 218 417 389 [email protected]
Abstract
The homogenization and analysis of long-term meteorological data sets are currently of unprecedented interest to the scientific community. If the monitoring station network is dense enough, many techniques use data from nearby stations (‘reference’ stations) in order to account for regional climate changes and to isolate the effects of irregularities in a ‘candidate’ station. We propose an extension of the method of cumulative residuals (Ellipse test) that takes into account the contemporaneous relationship between several candidate series from the same climatic area. The proposed technique uses the residuals from a
Seemingly unrelated regression equations (SUR) model. This procedure (SUR+Ellipse test) was applied to a testing variable, with annual resolution, derived from the daily precipitation data from 27 stations located in the southern region of Portugal. Three well established statistical tests were also applied: the Standard normal homogeneity test (SNHT) for a single break, the Buishand range test and the Pettit test. The promising results from this case study indicate the proposed methodology as a valuable tool for homogeneity testing of climate time series if the station network is dense enough.
Keywords: homogeneity testing, ellipse test, seemingly unrelated regression equations, precipitation
1 Introduction
A homogeneous climate time series is defined as one where variations are caused only by variations in climate (Aguilar et al., 2003). Non-climatic factors (e.g. monitoring stations
relocations, changes in instrumentation, changes of the surroundings, instrumental inaccuracies, etc.) make data unrepresentative of the actual climate variation and may lead to misinterpretations. Consequently, it is an important task to assess the homogeneity of long climate records before they can be reliably used. As a recent World Meteorological Organization (WMO) publication (Aguilar et al., 2003) states, ‘it is important, therefore, to
remove the inhomogeneities or at least to determine the possible error they may cause’. Two groups of homogeneity testing techniques can be distinguished and are usually referred as
absolute methods and relative methods. In the first set of procedures, the statistical tests are
applied to each station data separately. In the second one, the testing procedures use records from neighbouring stations (named reference stations) which are, presumably, homogeneous. If an absolute test detects a break in a station’s time series it may indicate an inhomogeneity or
it may simply indicate an abrupt change in the regional climate. Historic metadata support is then essential for evaluating the breaks detected. Unfortunately, these metadata was not available for our case study. Thus, a relative approach is more suitable for this study, as relative methods intend to isolate the non-climatic influences.
There are a significant number of tests available for the homogenization of climate series with low temporal resolution. A review of different statistical methods is presented in Peterson et al. (1998) and WMO guidelines on homogenization are provided in Aguilar et al. (2003).
However, well established statistical methods for homogeneity testing sub-monthly data are lacking (Easterling et al., 1999; Aguilar et al., 2003; Wijngaard et al., 2003; Auer et al., 2005).
Furthermore, adjusting daily and hourly data is not straightforward, thus the WMO makes no recommendations regarding adjusting sub-monthly data (Aguilar et al., 2003). In order to
overcome those limitations and taking into consideration the previous quality control analysis of the series collected from the European Climate Assessment (ECA) dataset (see section 2), the homogeneity testing followed the hybrid approach proposed by Wijngaard et al. (2003),
and used an annual resolution testing variable, namely the wet day count with 1 mm as threshold, which is expected to be representative of important characteristics of variation at the daily scale.
The relative approach used in this study comprises the application of three well established homogeneity tests to composite reference series, and the application of a new procedure to the testing variable. The proposed technique is an extension of the Ellipse test (described by Allen
et al., 1998) that takes into account the contemporaneous relationship between several
candidate series from the same climatic area by using the residuals from a Seemingly unrelated regression equations (SUR) model. This paper describes and compares the results from the
four relative tests used in the homogeneity assessment of 28 precipitation series from stations located in the south of continental Portugal.
2 Study domain and precipitation data
The study domain refers to the south of continental Portugal, and is defined by the Arade, Guadiana, Mira, Ribeiras do Algarve and Sado basins. The daily precipitation series analysed were compiled from the ECA dataset and the National System of Water Resources Information (SNIRH, managed by the Portuguese Institute for Water) database, and are available through free downloads from the ECA website (http://eca.knmi.nl) and the SNIRH website (http://snirh.inag.pt), respectively. The analysed precipitation series were downloaded during the first semester of 2004. All monitoring stations with at least 30 years with less than 5% of observations missing were selected, and hence the series with too many gaps were discarded. Despite being outside the study domain, data from Lisbon and Badajoz (Spain) stations were also compiled from the ECA dataset, as they presumably have high quality data (for details see the next section). Using those criterions, long-term series of daily precipitation from 45 weather stations were compiled. Figure 1 shows the study domain, which covers approximately 25200 km2, and the geographical distribution of stations.
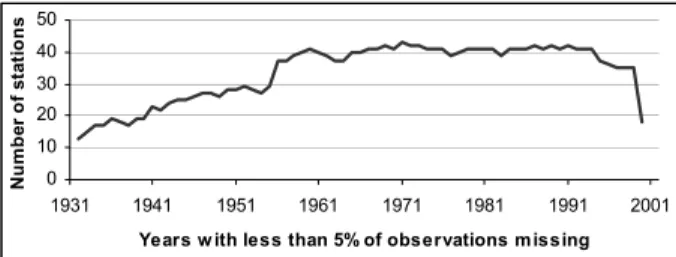
Even though the beginning and ending of series from the SNIRH database is highly variable, 44 series have a common period of observation of 20 years, located in the 1964-1983 interval. The compiled series have, in average, approximately 51 years of length, with less than 5% of observations missing, and most of them cover the standard normal period 1961/90 without too many gaps (Figure 2).
Figure 1 Study area and stations with daily precipitation series compiled. Station dots are scaled with the length (years lacking a maximum of 5% of data) of the time series.
0 10 20 30 40 50 1931 1941 1951 1961 1971 1981 1991 2001
Years w ith less than 5% of observations missing
N u m b er of s ta ti ons
Figure 2 Precipitation series by years lacking a maximum of 5% of data.
2.1 Previous quality control analysis
Before being compiled for this study, the daily series of the ECA dataset had already been subject to several basic quality-control procedures and four statistical homogeneity tests: the Standard normal homogeneity test (SNHT) for a single break (Alexandersson, 1986), the Buishand range test (Buishand, 1982), the Pettit test (Pettit, 1979), and the Von Neumann ratio test (Von Neumann, 1941). The homogeneity tests were applied to an annual resolution set of variables representing important characteristics of variation at the daily scale. For precipitation, the testing variable used was the wet day count using 1 mm as threshold. Because of the sparse density of the ECA station network, absolute tests were applied. The precipitation series compiled from the ECA dataset for this study were all marked as ‘useful’, as the four homogeneity tests did not reject the homogeneity hypothesis, at the 1% significance level. For further details see Klein Tank et al. (2002), Wijngaard (2003), Wijngaard et al.
(2003), and the ECA project website (http://eca.knmi.nl).
Like most long-term climate series, the daily precipitation series from the SNIRH database are expected to suffer from several non-climatic factors, although some homogeneity testing of the annual precipitation amounts has already been carried out by Nicolau (1999), for the period 1959/60 – 1990/91. This author found no inhomogeneities in the annual precipitation series of the monitoring stations considered here. Nevertheless, when the daily series were compiled for
this study (first semester of 2004), in the SNIRH website (http://snirh.inag.pt, Dados de Base) it was mentioned that data quality verification had not been concluded.
In summary, the compiled series from the ECA dataset were not tested using relative procedures, as well as the SNIRH database where objective relative methods were not
performed and the full length of each series was not analysed.
Taking into consideration the previous discussion, we assumed that the 45 daily precipitation series could contain potential breaks, as recommended by Auer et al. (2005), and thus several
homogenization procedures were applied to all of them. The homogeneity testing followed the hybrid approach proposed by Wijngaard et al. (2003) for the ECA dataset, and used the same
annual resolution testing variable, namely the wet day count with 1 mm as threshold.
The absolute approach comprises the application of six statistical tests to the testing variable, at all locations: the Mann-Kendall test (Mann, 1945; Kendall, 1975), the Wald-Wolfowitz runs test (Wald and Wolfowitz, 1943), the Von Neumann ratio test, the Standard normal homogeneity test (SNHT) for a single break, the Pettit test, and the Buishand range test. The outcomes from the six tests were then grouped together, and a classification was established relying on the number of tests rejecting the homogeneity hypothesis at a 5% significance level: (i) series considered homogeneous by all tests were classified as ‘reference’; (ii) series for which only one of the six tests rejected the null hypothesis were classified as ‘candidate’; (iii) series for which two or more absolute tests rejected the homogeneity hypothesis were excluded from this study. Using these criterions, 28 stations were selected for this study: 11 were classified as ‘candidates’ and 17 as ‘references’.
3 Methodology
The relative approach used comprises the application of four homogeneity tests, which are capable of locating the year where a break is likely. The Standard normal homogeneity test (SNHT) for a single break; the Pettit test; and the Buishand range test were applied to composite (ratio) reference series, defined by Alexandersson and Moberg (1997), which were derived from the testing variable (annual number of wet days, threshold 1 mm). The proposed extension of the Ellipse test was applied to the testing variable, and is detailed later in this section.
As previously discussed, the results from an absolute approach were used to determine which series were more appropriate to be selected as candidates and as references (presumably homogeneous). The selected reference series were used to test the existence of inhomogeneities in the candidate series. Additionally, the selected reference series were also tested through an iterative procedure in which they were seen consecutively as candidates and references. In order to select references for a specific candidate series the most common approach was used (e.g. Tayanç et al., 1998), i.e. Pearson correlation coefficients between the
candidate and the eligible reference series were computed and the two highest correlated ones (>0.70) were taken as reference.
3.1 Proposed extension of the Ellipse test
Allen et al. (1998) describe a method of cumulative residuals (Ellipse test) that tests if a
weather data set from a monitoring station is homogeneous using the cumulative residuals from the linear regression between the candidate series (dependent variable) and data from a
surrounding stations inside the same climatic region. We propose an extension of this method that takes into account the contemporaneous relationship between several candidate series from the same climatic area. Instead of using the residuals from a linear regression model, the proposed technique uses the residuals from a Seemingly unrelated regression equations (SUR) model.
Zellner (1962) proposed the SUR approach for situations where at least two equations are being estimated and the error terms are contemporaneously but not serially correlated. In a general specification of M seemingly unrelated regression equations (one for each candidate
series), the ith equation is given by
,...,M
i
,
e
β
X
y
i=
i i+
i=
1
(1) where:yi – is a vector of dimension (Tx1) containing all the observations on the ith dependent
variable (T observations from the ith candidate series),
Xi – is a matrix of dimension (TxKi) containing all the observations from all the Ki
explanatory variables (T observations from each reference series, and T observations from the constant term),
βi – is a vector, of dimension (Kix1), of unknown coefficients to be estimated,
ei – is a vector of dimension (Tx1) containing the error terms for all observations.
Note that each equation involves Ki regressors, meaning that each equation does not have to
have the same number of explanatory variables. However, if all equations have identical explanatory variables, then generalized least squares is equivalent to equation by equation ordinary least squares (Greene 2003, p. 343). Thus, for those situations the proposed approach is equivalent to the method of cumulative residuals (Ellipse test) described by Allen et al.
(1998).
Combining all equations into one model yields
⎥
⎥
⎥
⎥
⎦
⎤
⎢
⎢
⎢
⎢
⎣
⎡
+
⎥
⎥
⎥
⎥
⎦
⎤
⎢
⎢
⎢
⎢
⎣
⎡
⎥
⎥
⎥
⎥
⎦
⎤
⎢
⎢
⎢
⎢
⎣
⎡
=
⎥
⎥
⎥
⎥
⎦
⎤
⎢
⎢
⎢
⎢
⎣
⎡
M M M Me
e
e
X
X
X
y
y
y
M M L M O M M L L M 2 1 2 1 2 1 2 10
0
0
0
0
0
β
β
β
(2) Or, alternatively, y = Xβ + e (3)where the definitions of y, X, β and e are obvious from Equation 2 and their dimensions are,
respectively, (MTx1), (MTxK), (Kx1), and (MTx1), with
∑
==
Mi
K
iK
1 (4)Given that eit is the error for the ith equation in the tth time period, the assumption of
contemporaneous disturbance correlation, but not correlation over time, implies that the covariance matrix for the complete error vector can be written as
where:
⎥
⎥
⎥
⎥
⎦
⎤
⎢
⎢
⎢
⎢
⎣
⎡
σ
σ
σ
σ
σ
σ
σ
σ
σ
=
Σ
MM 2 M 1 M M 2 22 21 M 1 12 11 L M O M M L L (6)and ⊗ denotes the Kronecker product, indicating that each element of Σ is multiplied by an identity matrix. The matrix Σ is symmetric, so that σij = σji and it is non-singular, and thus has an inverse.
The generalized least squares estimator of β, typically denoted by
βˆ
, is the best linear unbiased estimator (Griffiths et al. 1993, p. 570), but assumes that Σ is known. In practice, the variances and covariances are usually unknown and must be estimated, thus the feasible generalized least squares estimatorβ
ˆˆ
is generally used (Greene 2003, p. 344).To compute a feasible generalized least squares estimator, Σ must be replaced by a consistent estimator (Ruud 2000, p.704). To estimate the σij, each equation is first estimated by ordinary least squares in order to obtain the least squares residuals
eˆ
i. Consistent estimates of the variances and covariances are then given by∑
==
=
T t it jt j i ijT
e
e
T
e
e
1ˆ
ˆ
1
ˆ
'
ˆ
1
ˆ
σ
(7)If we define
Σˆ
as the matrix Σ with the unknown σij replaced byσ
ˆ
ij, then the feasiblegeneralized least squares estimator for β can be written as
(
)
[
X
Σ
⊗
I
TX
]
X
(
Σ
⊗
I
T)
y
=
'
ˆ
−1 −1'
ˆ
−1ˆˆβ
(8)The proposed procedure (SUR+Ellipse test) uses the cumulative residuals from such a SUR model to identify inhomogeneities in several candidate series from the same climatic area. A candidate series can be considered homogeneous if the cumulative residuals are not biased. The bias hypothesis can be tested using an ellipse defining the confidence limits (Allen et al.,
1998). For each equation i (ith candidate series), the axes of the ellipse are defined by
⎪
⎩
⎪
⎨
⎧
−
=
=
i e p i iS
z
T
T
T
,1
2
/
β
α
(9) where:zp – stands for the standard normal variate for the desired probability p (confidence level),
Se,i – is the standard deviation of the residuals of the ith equation.
⎩
⎨
⎧
θ
β
=
θ
α
=
)
sin(
Y
)
cos(
X
i i i i (10) Plotting the cumulative residuals against time, using the time scale (interval) of the variable under analysis, the accumulated residual curve is obtained. If all the cumulative residuals lie inside the ellipse then the hypothesis of homogeneity is not rejected for the significance level considered. This test is then capable of locating the period (year) where a break is likely to occur.4 Results and discussion
The Buishand, Pettit, and SNHT tests were applied to 28 composite (ratio) reference series and concluded as homogeneous 13 series (5 previously classified as candidates, and 8 as references). For the remaining 15 series, at least one of the tests rejected the homogeneity hypothesis, at the 5% level.
The proposed technique (SUR+ Ellipse test) was applied to the annual number of wet days (threshold 1 mm) at 27 stations. The series from Viana do Alentejo (24I.01) was not tested using this approach because it was not possible to determine a common period, without too many gaps, for all the series that would be appropriate to model simultaneously (candidates and their respective references). Since each SUR model includes at least two candidate stations data, some series were tested more than once through different models, depending on the common period of the series included in each model. Consequently, for a specific candidate series, different models provided sometimes different results (see e.g. the results of station Aljezur (30E.01) in the following section). Moreover, all the regressors (reference series) parameters of the SUR models are statistically significant at the 5% level, which is why some candidates had only one reference series.
For a 5% significance level, the SUR+Ellipse test approach concluded as homogeneous 17 series (5 previously classified as candidates, and 12 as references). The SUR+Ellipse test results agree with at least one of the other three tests results for 18 stations (67%). For the left 9 stations, the SUR+Ellipse approach considered homogeneous series in 6 stations, where the other methods identified break years, and has identified break years in 3 stations which were considered as homogeneous series by the other methods.
The magnitudes of the breaks detected by the SUR+Ellipse test, but not identified by the other methods, range from –7.6% to 6.88%. Conversely, the magnitudes of the breaks detected by at least on of the other three tests, but not identified by the SUR+Ellipse test range from –14.09% to 10.78%. Hence, there is no apparent connection between the potential breaks magnitudes and the ability of the SUR+Ellipse test to identify them.
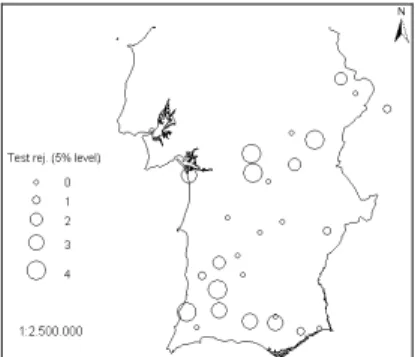
Considering the results from the four relative tests, all of them considered as homogeneous 12 (43%) stations series, whereas at least one of the tests rejected the homogeneity hypothesis for the remaining 16 station series (Figure 3), at the 5 % level. Only 4 of the 11 series previously classified as candidates were considered as homogeneous by the four tests. Considering the 17 series previously classified as references, 8 of them were considered as homogeneous by all relative tests. The relative magnitudes of the breaks are given by the ratio between the average annual wet day count before and after two consecutive breaks. The breaks magnitudes, of the 20 cases of inhomogeneities detected, range from –14.1% to 17.3%. The average of the absolute values of the relative magnitudes was 7.3%.
Figure 3 Station circles are scaled with the number of tests that rejected the homogeneity hypothesis at the 5% level. The Buishand, Pettit, and SNHT tests were applied to 28 composite (ratio) reference series. The proposed SUR+Ellipse test was applied to the annual number of wet days (threshold 1 mm) at 27 stations.
The average length of the homogeneous subintervals turned out to be 24 years. The break years identified are mostly detected by all four tests and are mainly located between 1949 and 1954, and around 1986. Thus, there is an apparent trend towards less breaks in the last decade, unlike reported by other homogenization studies (Tuomenvirta, 2001; Wijngaard et al., 2003;
Auer et al., 2005). However, there were only 20 cases of inhomogeneities detected in the 28
stations series analysed, which is not surprising in view of the previous absolute testing results. Hence, that apparent trend may not be true if all the 45 station series were tested through the relative approach. Moreover, the magnitudes extents and the number of inhomogeneities depend strongly on the specifics of the monitoring network and the topography of the different study regions. Furthermore, there are only 4 stations with two break years, whereas the remaining 12 have just one break detected. As expected, for precipitation, with its high variability, few breaks can be detected (Wijngaard et al., 2003).
4.1 Illustration of the SUR+Ellipse test application
As an illustration, the results from the proposed technique are discussed for the series from Aljezur (30E.01). For this station, the Buishand test statistic was equal to 1.88 for the period 1956-1995. The Pettit and the SNHT tests statistics were equal to (–)255 and to 13.81, respectively, in that period. Hence, these three tests detected a break, in 1968, in the Aljezur (30E.01) series, at the 5% level.
For Aljezur (30E.01), the Ellipse test was applied to the residuals from seven equations (SUR models numbers 5, 6, 7, 9, 10, 11 and 12), which used the series from Arronches (19N.01) as reference (independent variable). Two Ellipse tests identified breaks in 1968 (models 6 and 12), of magnitude 1.04, whereas the other five tests considered the series as homogeneous, at the 5% level. For illustration purposes, see the SUR+Ellipse test results from models 5 (left graph) and 12 (right graph) in Figure 4.
As stated before, for a specific candidate series, different models provided sometimes different results, as with the Aljezur (30E.01) series, which is a major drawback of the proposed method. However, this problem can be minimized by testing the candidate series through a different model whenever a pick in the graph from the Ellipse test seems suspicious, even though considered as homogeneous (Figure 4, left graph).
Figure 4 SUR+Ellipse test results (left, SUR model 5: 1941–1999; right, SUR model 12: 1956–1997) for the annual number of wet days (threshold 1 mm) at station Aljezur (30E.01).
5 Final remarks
The proposed technique has the advantage of testing simultaneously several candidate series from the same climatic area, taking into account the contemporaneous relationship between them. The SUR+Ellipse test results agree with at least one of the other three tests results for 67% of the stations, and has identified break years in 3 stations which were considered as homogeneous series by the other methods. Moreover, there is no apparent connection between the potential breaks magnitudes and the ability of the SUR+Ellipse test to identify them. These promising results indicate the proposed methodology as a valuable tool for homogeneity testing of climate time series if the station network is dense enough.
A major disadvantage of this method is that, for a specific candidate series, different models provide sometimes different results. However, this problem can be minimized by testing the candidate series through a different model whenever a pick in the graph from the Ellipse test seems suspicious, or by using a combination of statistical tests. In fact, Wijngaard et al. (2003)
state that, generally, a combination of statistical methods and methods relying on metadata information is considered to be most effective to track down inhomogeneities.
Since very few studies have compared the performance of homogenization techniques (Ducré-Robitaille et al., 2003), we intend to use simulated datasets to evaluate the ability of the
SUR+Ellipse test, among others, to determine properly the series that are homogeneous and to identify correctly the position and magnitude of breaks within inhomogeneous series.
References
Aguilar, E., Auer, I., Brunet, M., Peterson, T. C. and Wieringa, J., 2003, Guidelines on climate metadata
and homogenization, WMO-TD No. 1186, WCDMP No. 53, Geneva: World Meteorological Organization.
Alexandersson, H., 1986, A homogeneity test applied to precipitation data. Journal of Climatology, 6, pp. 661-675.
Alexandersson, H. and Moberg, A., 1997, Homogenization of Swedish temperature data. Part I: Homogeneity test for linear trends. International Journal of Climatology, 17 (1), pp. 25-34.
Allen, R. G., Pereira, L. S., Raes, D. and Smith, M., 1998, Statistical analysis of weather data sets. In Crop
evapotranspiration - Guidelines for computing crop water requirements, FAO - Food and Agriculture
Organization of the United Nations (Ed.), Annex IV, FAO Irrigation and drainage paper 56, Rome: FAO. Auer, I., Böhm, R., Jurkovi´c, A., Orlik, A., Potzmann, R., Schöner, W., Ungersböck, M., Brunetti, M., Nanni, T., Maugeri, M., Briffa, K., Jones, P., Efthymiadis, D., Mestre, O., Moisselin, J.-M., Begert, M., Brazdil, R., Bochnicek, O., Cegnar, T., Gaji´c-
C
(apka, M., Zaninovi´c, K., Majstorovi´c,Z
(., Szalai, S.,Szentimrey, T. and Mercalli, L., 2005, A new instrumental precipitation dataset for the greater alpine region for the period 1800-2002. International Journal of Climatology, 25 (2), pp. 139-166.
Buishand, T. A., 1982, Some methods for testing the homogeneity of rainfall records. Journal of
Hidrology, 58, pp. 11-27.
Ducré-Robitaille, J.-F., Vincent, L. A. and Boulet, G., 2003, Comparison of techniques for detection of discontinuities in temperature series. International Journal of Climatology, 23 (9), pp. 1087-1101. Easterling, D. R., Diaz, H. F., Douglas, A. V., Hogg, W. D., Kunkel, K. E., Rogers, J. C. and Wilkinson, J. F., 1999, Long-term observations for monitoring extremes in the Americas. Climatic Change, 42 (1), pp. 285-308.
Greene, W. H., 2003, Econometric Analysis, Fifth edition, Prentice Hall International Edition, New Jersey: Pearson Education.
Griffiths, W. E., Hill, R. C. and Judge, G. G., 1993, Learning and Practicing of Econometrics, New York: John Wiley & Sons.
Kendall, M. G., 1975, Rank correlation methods, London: Charles Griffin.
Klein Tank, A. M. G., Wijngaard, J. B., Können, G. P., Böhm, R., Demarée, G., Gocheva, A., Mileta, M., Pashiardis, S., Hejkrlik, L., Kern-Hansen, C., Heino, R., Bessemoulin, P., Müller-Westermeier, G., Tzanakou, M., Szalai, S., Pálsdóttir, T., Fitzgerald, D., Rubin, S., Capaldo, M., Maugeri, M., Leitass, A., Bukantis, A., Aberfeld, R., van Engelen, A. F. V., Forland, E., Mietus, M., Coelho, F., Mares, C., Razuvaev, V., Nieplova, E., Cegnar, T., López, J. A., Dahlström, B., Moberg, A., Kirchhofer, W., Ceylan, A., Pachaliuk, O., Alexander, L. V. and Petrovic, P., 2002, Daily dataset of 20th-century surface air temperature and precipitation series for the European Climate Assessment. International Journal of
Climatology, 22 (12), pp. 1441-1453.
Mann, H. B., 1945, Non-parametric test against trend. Econometrika, 13, pp. 245-259.
Nicolau, R. C., 1999, Avaliação da qualidade de séries de registos de precipitação anual com vista à
selecção, ajustamento e completamento das mesmas para posterior modelação da variabilidade espacial
da pluviosidade, Estudo, 053C/19, Lisboa: CNIG-Centro Nacional de Investigação Geográfica.
Peterson, T. C., Easterling, D. R., Karl, T. R., Groisman, P., Nicholls, N., Plummer, N., Torok, S., Auer, I., Boehm, R., Gullett, D., Vincent, L., Heino, R., Tuomenvirta, H., Mestre, O., Szentimrey, T., Salinger, J., Forland, E.J., Hanssen-Bauer, I., Alexandersson, H., Jones, P. and Parker, D., 1998, Homogeneity adjustments of in situ atmospheric climate data: A review. International Journal of Climatology, 18 (13), pp. 1493-1517.
Pettit, A. N., 1979, A non-parametric approach to the change-point detection. Applied Statistics, 28 (2), pp. 126-135.
Ruud, P. A., 2000, An Introduction to Classical Econometric Theory. New York: Oxford University Press. Tayanç, M., Dalfes, H. N., Karaca, M. and Yenigün, O., 1998, A comparative assessment of different methods for detecting inhomogeneities in Turkish temperature data set. International Journal of
Climatology, 18 (5), pp. 561-578.
Tuomenvirta, H., 2001, Homogeneity adjustments of temperature and precipitation series - Finnish and Nordic data. International Journal of Climatology, 21 (4), pp. 495-506.
Von Neumann, J., 1941, Distribution of the ratio of the mean square successive difference to the variance.
Annals of Mathematical Statistics, 13, pp. 367-395.
Wald, A. and Wolfowitz, J., 1943, An exact test for randomness in the non-parametric case based on serial correlation. Annals of Mathematical Statististics, 14, pp. 378-388.
Wijngaard, J. B., 2003, Homogeneity of daily ‘European Climate Assessment and Dataset’ series. In
Proceedings of the Second Seminar for Homogenization of Surface Climatological Data, Budapest,
WMO-TD No. 962, WCDMP No. 41, pp. 143-149, Geneva: World Meteorological Organization. Wijngaard, J. B., Klein Tank, A. M. G. and Können, G. P., 2003, Homogeneity of 20th century European daily temperature and precipitation series. International Journal of Climatology, 23 (6), pp. 679-692. Zellner, A. (1962). An Efficient Method of Estimating Seemingly Unrelated Regressions and Tests for Aggregation Bias. Journal of the American Statistical Association, 57 (298), pp. 348-368.