2019
UNIVERSIDADE DE LISBOA
FACULDADE DE CIÊNCIAS
DEPARTAMENTO DE BIOLOGIA ANIMALUsing micropatterning of hiPSCs to induce PGC formation
Francisco Vieira Bretes
Mestrado em Biologia Evolutiva e do Desenvolvimento
Dissertação orientada por:
Susana M. Chuva de Sousa Lopes, PhD
Gabriela Rodrigues, PhD
i
ACKNOWLEDGEMENTS
A big thank you to my mother, grandparents and brother for supporting my studies, diet and being a positive influence in general. As well as my friends, for being the outside world, hope and being also a lifeline (you know who you are). A big thank you to everyone in the lab for being such nice people, hardworking and supportive people in general.
In particular, I thank Jasin for being a friend, teaching me about cell culture, PCR and being so patient too. I thank Sander for being a friend as well, talking to me about bioinformatics, showing me the basics on how to start up with transcriptomics data with Jasin and the experience he carries.
I thank Esther for being a massive help with the experiments and maintaining the cells, they wouldn´t be possible without you, and as well, being a friend. I thank Erica for the efforts on the work with the Cytoos, testing them in her project, before they could be used in mine and, as with everyone, for the niceness. I thank Christiaan Arendzen from the iPS Facility for maintaining the iPSCs and bringing them to Chuva de Sousa Lopes Lab. I thank Palmira too for being an example, including all the PhD students, Xueying, Julieta, Silwia. Not forgetting, Maaike and Ioannis.
I thank Professor Gabriela Rodrigues for being my supervisor in Portugal and being a great teacher. I also thank Professors Solveig, Octávio, Gabriel, Vitor, Bernard and Élio or heir teachings during the first year of the master.
Most of all, lastly but the reason for me being able to work in this project, Dr Susana, for her willingness for talking to me initially, accepting me in her group and being my supervisor.
ii
SUMÁRIO
O estudo in vitro do desenvolvimento dos gâmetas é essencial para compreender os aspetos determinantes da fertilidade em mamíferos e em particular em humanos. Nesse âmbito inclui-se nesta tese a investigação das células precursoras deste tipo celular, as Células Germinais Primordiais (PGCs).
De acordo com estudos anteriores em ratinho, as células precursoras das PGCs (pPGCs) podem ser identificadas durante o período de gastrulação. Restrições éticas e legislativas relativas à utilização de embriões humanos em fase de gastrulação se insere impedem o estudo destas últimas com recurso a cultura de embriões humanos. Como estas restrições excluem a possibilidade de efetuar análises no período em que se estima abranger a gastrulação humana, não é possível atualmente estudar estes acontecimentos com base em observações feitas com embriões humanos.
Por este motivo recorreu-se a um método de cultura celular usando diferenciação de células humanas pluripotentes induzidas (hiPSCs) e células estaminais embrionárias humanas (hESCs). Este método permite replicar até um certo ponto a gastrulação in vivo. O método 2D de cultura de células desenvolvido por Warmflash et al. (2014) foi escolhido como base. Este método apoia-se na micropadronização de lamelas (com fibronectina) para obter diferenciação celular, com estimulação da via da proteína morfogenética do osso (bone morphogenetic protein4, BMP4). Tentou-se reproduzir o aparecimento dos folhetos germinativos e a sua organização em domínios distintos mutuamente repressivos, devido a moléculas secretadas por cada folheto germinativo que asseguram que células características de um não se formem nos restantes folhetos. O método de Warmflash et al. (2014) recapitula, deste modo, a gastrulação in
vitro. No entanto, tal organização foi impossível de obter devido a cobertura sub-ótima dos
micropadrões. Este grau de cobertura terá resultado de incompatibilidades entre células e a proteína constituinte dos micropadrões, a fibronectina (FN1). Por este motivo, um outro método baseado na cultura de células estaminais embrionárias humanas (hESCs) em lamelas revestidas com matrigel foi usado, também almejando a geração de PGCs in vitro. Este método produziu resultados positivos, visto que células positivas para três marcadores-chave de PGCs foram detetadas.
Estas células foram detetadas ao aplicar imunofluorescência (usando um painel de anticorpos) refinado por meio de análise bioinformática, a partir de marcadores extraídos da literatura. Estes marcadores permitiram evidenciar, por meio de imagiologia às lamelas, a presença de potenciais PGCs.
Com este método foi possível induzir potenciais PGCs, abrindo-se um novo meio para investigar os mecanismos e vias de sinalização para estudar estas células sem ter de recorrer ao uso de animais ou embriões humanos em cultura.
Palavras-chave
iii
ABSTRACT
Understanding PGC development is key to uncover new strategies to assist the reproduction of humans and non-human organisms. However, the study of human early gametogenesis falls under the same restrictions associated with studying human early development. This means culturing human embryos past two weeks (14 days), the estimated stage at which gastrulation should begin is out of reach under the law. This motivated the current efforts for investigating methods that replicate gastrulation in vitro as closely as possible. A 2D protocol developed initially by Warmflash et al. (2014) potentially fulfils this necessity according to tests performed by the authors. This allows the use of micropatterning for differentiating colonies of human induced pluripotent stem cells (hiPSCs) with supplementation of bone morphogenetic protein4(BMP4). The authors showed that colonies develop the three germ layers (ectoderm, mesoderm, endoderm and extraembryonic ectoderm). The promise that this 2D platform provides the means to recreate the cellular interactions of gastrulation prompted for the question driving this study: Can primordial germ cells (PGCs) be induced from hiPSCs by differentiating them in micropatterns?
To answer this question, a search for genes, that could be used as markers, was first conducted. Thus, several genes were selected from established marker genes and others whose validation has been less extensive in the literature. This was followed by a bioinformatics analysis was performed on a data set containing both germ and somatic cells from Li et al. Cell (2017). This data set was analysed in parallel with one other containing primed and naïve stem cells from Messmer et al. Cell (2019). In this manner, the exploration of these datasets resulted in a basic analysis, which was the source of proposed antibody combinations to detect PGCs. After obtaining the appropriate marker combinations for immunostaining, the 2D method was tested for its suitability to induce PGCs. However, the seeding of these micropatterns with hiPSCs or human embryonic stem cells (hESCs) revealed to be technically challenging for this study. Continuous experimental difficulties with achieving uniform attachment (coverage) of hiPSCs to the micropatterns motivated searching for PGCs in vitro through a different method, while also relying on the previously identified marker combinations. The new method used seeding of hESCs on Matrigel coated glass coverslips in conjunction with BMP4 stimulation, as applied on the micropatterns. This protocol was then used to look for indications of possible human PGCs in culture through immunostaining of the fixed coverslips, for selected marker combinations. After imaging it was possible to observe cells with PGC morphology and co-expression of key PGC markers. Due to the resemblance of the observed cells to PGCs, it is likely that PGCs may have been generated using the proposed method of stimulation. The same that is used in micropatterns by Warmflash et al. (2014). Taken together, this thesis describes a potential method to study PGC specification without animal experimentation or resorting to human embryo culture.
KEYWORDS
iv
Index
Acknowledgements... i
Sumário... ii
Abstract ... iii
List of tables and figures ... vi
Abbreviations List... vii
1. Introduction ... 1
1.1 - Gametogenesis and the relevance of studying germ cell development ... 1
1.2 - Comparing model organisms: Putting the pieces together ... 2
1.3 - Gastrulation: Specification of PGCs in vivo ... 4
1.4 - Migration ... 5
1.5 - In vitro generation using hESCs and hiPSCs ... 7
1.6 - Existing 2D and 3D methods ... 8
1.7 - Objectives ... 9
2. Materials and Methods... 10
2.1 - scRNA-seq dataset analysis ... 10
2.1.1 - scRNA-seq dataset analysis: Germ cells vs somatic cells ... 10
2.1.2 - scRNA-seq dataset analysis: primed cells vs naïve cells ... 10
2.2 - hiPSC colony growth analysis ... 10
2.3 – Culture of hiPSCs ... 11
2.4 - Differentiation of hiPSCs and hESCs ... 11
2.5 - Differentiation of hiPSCs and hESCs: Micropattern seeding and differentiation ... 12
2.6 - Immunofluorescence ... 14
2.7 - Imaging ... 15
2.8 - Statistics ... 15
3. Results ... 16
3.1 - Expression comparison of genes commonly associated PGC with PGC development scRNA-seq analysis ... 16
3.1.1 - Most established PGC markers are not as consistent as previous studies claim ... 17
3.1.2 - Most PGC genes are not restricted to one pluripotency state. Nor are all pluripotency state markers restricted to their respective states ... 19
3.1.3 - PGCs multiply while migrating: hPGC proliferation is asynchronous ... 20
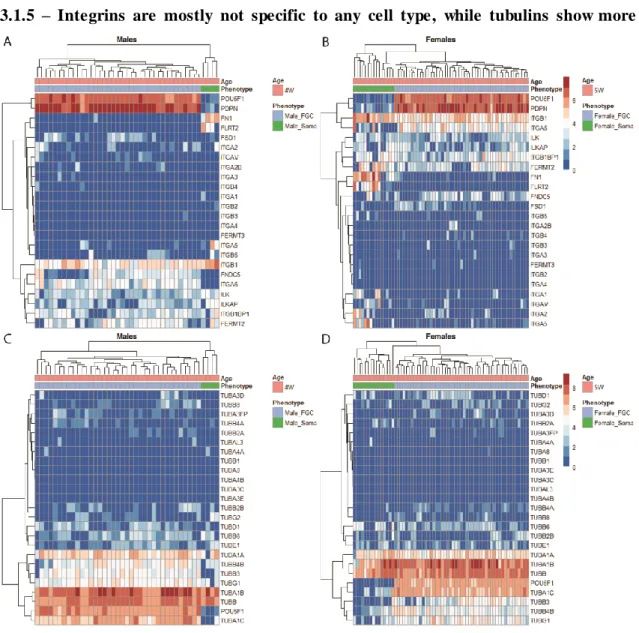
v 3.1.5 - Integrins are mostly not specific to a cell type, while tubulins show more specificity 23
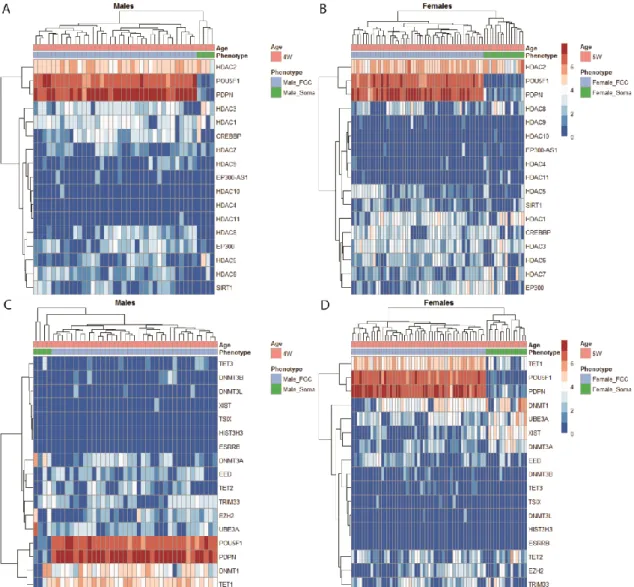
3.1.6 - Chromatin state and histone modifiers are in general not reliable candidates ... 25
3.1.7 - Genes other than established markers can assist in detecting PGCs? ... 26
3.2 - Cell culture: Testing micropatterns and supported marker genes ... 27
3.2.1 - Reproduction of micropattern seeding with PSCs proved unsuccessful ... 27
3.2.2 - Reproduction of micropattern seeding with PSCs also unsuccessful with FN1 adaptation ... 28
3.2.3 - Assessing colonies for antibody testing: a proxy for ideal size of differentiation ... 29
3.3 - Staining hESCs in search off PGCs: Can they be generated with BMP4 supplementation? ... 27
3.3.1 - Staining hESCs in search off PGCs: Potential PGCs or regular PSCs found? ... 31
3.3.2 - Staining hESCs in search off PGCs: Immunofluorescence misses potential PGCs ... 33
3.3.3 - Staining hESCs in search off PGCs: Immunofluorescence highlights potential PGCs ... 35
4. Discussion ... 37
4.1 - Bioinformatics analysis as a tool for the detection of germ cells in vitro ... 37
4.2 - scRNA-seq analysis for selection of markers ... 37
4.2.1 - Most established PGC markers are not a consistent as previous studies claim... 37
4.2.2 - PGCs multiply while migrating: hPGC proliferation is asynchronous ... 39
4.2.3 - Most adhesion molecules are not expressed by germ cells ... 39
4.2.4 - Most chromatin and histone modifiers do not provide good PGC markers ... 40
4.3 - Testing micropatterns and supported marker genes ... 41
4.3.1 - Unsuccessful reproduction of the micropatterning methods first step ... 41
4.3.2 – hiPSC wells do not present different colony diemeter varability between passages . 42 4.3.3 – Staining of hESCs on Matrigel coated coverslips ... 41
5. Conclusions and Future Perspectives... 43
5.1 - Bioinformatics analysis as a tool for the detection of germ cells in vitro... 44
5.2 - Micropatterned chips protocol requires further optimization for the cell lines used .... 44
vi
List of tables and figures
Figure 1.1 Germ cells throughout the stages of Human development, male perspective. 3 Figure 1.2 Correspondence between the developmental stages three mammal species. 6 Figure 2.5. Differentiation of human embryonic stem cells [from Deglincerti et al (2016)].
12
Figure 2.6. Conditions that hiPSCs and hESCs were subjected to, prior to immunofluorescence.
14
Table 2.6.1. Primary antibodies used for immunofluorescence on coverslips seeded with
hESCs.
15
Table 2.6.2. Secondary antibodies used for immunofluorescence on coverslips seeded with
hESCs. 15
Figure 3.1.1. Heatmap plots of genes expected to identify PGCs, early development and of
naïve plus primed pluripotency state genes in germ and somatic cells. 17
Figure 3.1.2. Heatmap plots of genes encoding proteins established as PGC/early development
markers and PSC genes. 19
Figure 3.1.3. Heatmap plots of genes encoding proteins playing a role in cell migration and
proliferation. 20
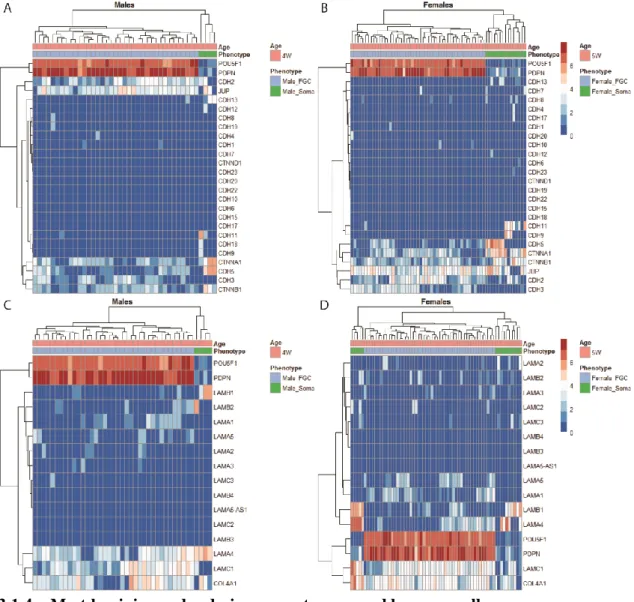
Figure 3.1.4. Heatmap plots of genes encoding the Cadherin, Laminin and Integrin adhesion
protein families. 22
Figure 3.1.5. Heatmap plots of genes encoding integrin proteins expressed on germ or somatic
cells and tubulin expression. 23
Figure 3.1.6. Heatmap plots of histone deacetylase and epigenetic regulator genes.
25
Figure 3.1.7. Heatmap plot of germ and somatic genes with primed and naïve cells.
26
Figure 3.2.1. Brightfield images of D3B4 condition Cytoos seeded with CL002 cells from
different chips taken prior to fixation. 27
Figure 3.2.2. Brightfield images of 1wkFN1+D3B4 condition Cytoos seeded with CL002 cells from different chips taken prior to fixation. 28
Figure 3.2.3. hiPSC colonies and radius analysis for protocol optimization. 29
Figure 3.3.1. WIS1 colonies immunostained for PDPN, Oct4 and counterstained with DAPI. 31
Figure 3.3.2. WIS1 colonies immunostained for DAPI, Oct4, SOX17 and counterstained with
DAPI. 33
Figure 3.3.3. WIS1 colonies immunostained for PDPN, Oct4, TFAP2C and counterstained with
vii
ABREVIATIONS LIST
APC/C Anaphase-promoting complex or Cyclosome AVE Anterior visceral endoderm
AKT1 AKT serine/threonine kinase 1
TF Transcription factor
BMP Bone Morphogenetic Protein
CCNA1 Cyclin A1 CCNA2 Cyclin A2 CCND1 Cyclin D1 CCNE1 Cyclin E1 CCNE2 Cyclin E2 CTNNB1 Catenin beta 1 CER1 Cerberus1
CDC20 cell division cycle 20
CDH1 E-Cadherin
CDH2 N-Cadherin
CDH5 Cadherin 5
CDH11 Cadherin 11
CDK Cyclin-dependent kinase
CXCL12 Chemokine (C-X-C motif) ligand 12
CXCR4 C-X-C chemokine receptor type 4 DP Double Positive/double positive
DPPA3 Developmental pluripotency associated 3, Stella DKK1 Dickkopf WNT signaling pathway inhibitor 1
viii
ECM Extra-cellular matrix
EOMES Eomesodermin
hESC Human Embryonic Stem Cell
hiPSC Human induced Pluripotent Stem Cell ExE Extraembryonic Ectoderm
FERMT2 Fermitin family member 2
FN1 Fibronectin
FNDC5 Fibronectin type III domain containing 5
h Human
ITGA1 Integrin subunit alpha 1
ITGB1 Integrin subunit beta 1 JUP Junction plakoglobin
KIT KIT proto-oncogene, receptor tyrosine kinase KITL KIT ligand or stem cell factor
PCNA Proliferating cell nuclear antigen p Primed
PECAM1 Platelet and endothelial cell adhesion molecule 1
PDPN Podoplanin
m/hPGC Mouse/human Primordial germ cell P P-value
POU5F1 POU class 5 homeobox 1 PVE Posterior visceral endoderm
PRDM1 PR/SET domain 1 PSC Pluripotent stem cell
MCM2 Minichromosome maintenance complex component 2
MASTL Microtubule associated serine/threonine kinase like
NANOG NANOG homeobox
LAMA2 Laminin subunit alpha 2
ix
LAMA4 Laminin subunit alpha 4
LAMB1 Laminin subunit beta 1
LAMB2 laminin subunit beta 2
LAMC1 Laminin subunit gamma 1
LAMC2 Laminin subunit gamma 2
SOX2 SRY-box transcription factor 2
SOX17 SRY-box transcription factor 17
scRNA-seq single cell Ribonucleic Acid sequencing SSC spermatogonial stem cell
TET1 TET methylcytosine dioxygenase 1
TFAP2C Transcription factor AP-2 gamma TPM Transcripts per million
TUBA1C Tubulin alpha 1c
TUBB3 Tubulin beta 3 class III
TSIX TSIX transcript, XIST antisense RNA
UBE3A Ubiquitin-conjugating enzyme E2A
WNT WNT family member
1
1. Introduction
1.1 – Gametogenesis and the relevance of studying germ cell
development
Reproduction is known as the means by which species propagate and maintain themselves. In the case of sexually reproducing species, this is dependent on the ability to produce gametes. These are originated from precursors, named Primordial Germ Cells (PGCs). PGCs are formed as a result of a process called specification, during gastrulation, following the blastocyst stage, by a variety of signals produced by surrounding cells. The combination of these signals and the spatial arrangement of the cells producing them determines where and how many PGCs are specified[1]. Specification is ultimately a consequence of how embryo morphologies in each animal group, or Phylum, change from the blastocyst stage onwards and more precisely, species wise [1,2].
The process of gametogenesis is not error proof or exempt from the influence of internal or external(environmental) factors, such as toxins. Among these errors, aneuploidies, DNA replication related mutations, chromosomal aberrations, epigenetic changes and mitochondrial heteroplasmy are found. Such susceptibility of genomes to alterations is at the root of fertility problems or embryonic lethality in humans. The causes of infertility are variable and affect both sexes approximately equally, but have been mostly studied in male[3–5].
Various techniques have been developed to bypass these obstacles and achieve pregnancy. These are regarded as part of an array commonly referred to as in vitro fertilization procedures (IVFP). IVFP require an intense hormonal stimulation in the case of females. In order to obtain multiple oocytes, from which the best quality ones are selected. The referred hormonal treatment results in very intense discomfort and stress, aside from being greatly inefficient, the effects of intense stimulation are unknown in the resulting next generation across their lifespan[6,7]. Another drawback lies in the non-existence of precise enough screening methods capable of detecting non-well characterized mutations, such as de novo mutations on germ cells[8].
Additionally, extraction of human gametes through these methods and their manipulation with the goal of producing embryos for research purposes is forbidden by regulations and ethical boundaries in most countries [9].
The use of human induced Pluripotent Stem Cells (hiPSCs) can circumvent these limitations, as they can be generated from a specific donor by conversion to a pluripotent state[10]. The main procedures trigger pluripotency through viral integration in the genome or transfection of core pluripotency genes. Once the donor’s somatic cells are converted to pluripotent hiPSCs, they can be screened by nuclear and mitochondrial genome sequencing. Thus, healthy PGCs could be generated from donors carrying mutations or epigenetic alterations. Additionally, when enough knowledge from model animal studies is gathered, the creation of platforms to replicate early development closely, gains reproducibility. As such, the possibility to study the early stages for better assistance in the reproduction of human and non-human animals will be enhanced.
2
1.2 – Comparing model organisms: Putting the pieces together
As mentioned above, the requirements for specification of PGCs can vary among different species. In addition, this differs between mammalian and non-mammalian species. Even within mammals differences are found, for example, between rodents and other species, such as, rabbits, humans and various bovines. This means that, the signalling required to instruct cells, leading to the organization of a developing embryo, are not the same in every organism [1,11,12].
These differences stem from as early as the fusion of both sex gametes into a zygote, for example, the origin of the centrosome. This distinctive characteristic is variable inside mammals already around the time gametes meet, with the centrosome being provided by sperm cells in most cases and by oocytes in rodents[13]. Another differential aspect is the zygote’s genome methylation between rodents (mice, rats) and humans or rabbits[14].
Additionally, differences continue to be observed as embryos close in on the occurrence of gastrulation events, such as, implantation timing, an event that happens earlier in the mouse (E4.5). [15]. In humans, the blastocyst grows for longer before implantation occ urs(E6-12). These differences have not been connected to the regulation and time of onset of gastrulation[15,16]. Considering species-specific diversity during the early stages of mammalian development, investigating human development indirectly using a model can prove to be a challenge. Resorting to evolutionary closer organisms is practically possible, even with minuscule, species-specific differences between primates. Although, these are attributable to variability in study outputs[2,17,18].
Recent studies have demonstrated that the modes and timing of PGC specification to be largely conserved between humans, monkeys and pigs. These observations lead to the understanding that specification arises due to the events described as gastrulation in mammals [17,19]. Additionally, studies on mice, also one of the closest species, support this[20–22]. The precursors of mPGCs are specified around embryonic day(E) 6.25 as a cluster of 6 cells, that in the following 24 hours increase to about 45 cells. At E7.25, that cluster of 45 cells at the base of the allantois, located in the posterior part of the embryo, becomes lineage restricted. These are the only cells that enter the germline, which later give rise to the gametes with the genetic information transmitted to the next generation[22–24].
In humans, it is less clear at what stage of gastrulation hPGCs are specified, what are the molecular pathways involved and how many cells are specified initially[25–27]. Nevertheless, the similarities between the species mentioned priorly make those reasonable model organisms to consider when modelling the formation of functional germ (haploid) cells in humans[28]. Considering the common conclusions of previous studies, the following sections will further elaborate on the applications and aspects of stem cells, namely hiPSCs, while focusing on this period.
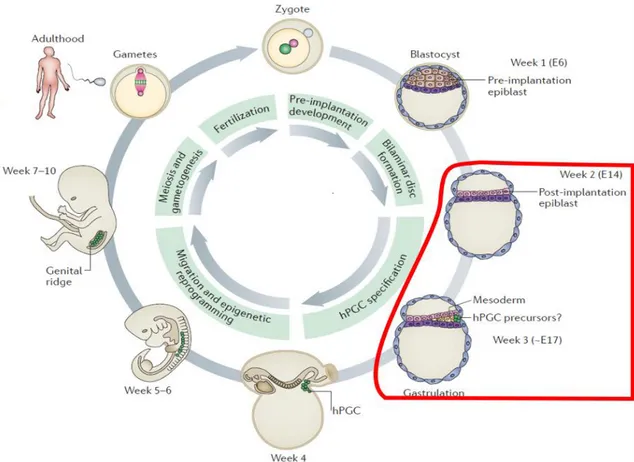
3 Figure 1.2. Ge rm ce lls throughout the stage s of Human de ve lopme nt, male pe rspe ctive . Fertilization – T he
zygote becomes the blastocyst, which is composed off pluripotent pre-implantation epiblast cells. Epiblast cells give rise to all embryo proper lineages, including the germ line, that are the main objective in this study. Post -implantation – In the uterine wall, the blastocyst develops a bilaminar embryonic disc and at a later stage undergoes gastrulation. At this point, ectoderm, mesoderm and endoderm germ layers are formed. Human PGCs (hPGCs) are likely specified approximately at the stage off gastrulation. T his means, posteriorly to the onset of gastrulation (roughly, embryonic day 17(E17)). However, the precise timing of hPGC specification in vivo is still unclear and thought to occur during 2- 3 weeks post -fertilization(wpf). At around 4 wpf – hPGCs localize near the yolk sac wall close to the allantois, and later migrate through the hindgut to the developing genital ridges. Migratory hPGCs undergo genome-wide epigenetic reprogramming, including global DNA demethylation, imprint erasure. During in-utero development and including adulthood, gonadal germ cells require meiosis and gametogenesis to differentiate into sperm and eggs. T owards the end of their journey, cells remethylate the genome reinstating sex -specific epigenetic marks. T hus, making the generation of a totipotent zygote upon fertilization, possible. Adapted from [27].
4
1.3 – Gastrulation: Specification of PGCs in vivo
Both in mouse as in human, the stimulus described to be the critical inducer responsible for PGC specification is BMP4. This morphogen is known to be produced in the extra-embryonic ectoderm (ExE) and in the amnion of the two species, respectively[27,29].
Mouse gastrulation has been described to start at E6.5, when the primitive streak is formed. In this species, ExE producing BMP4 leads to the formation of a cup shaped cylinder while in humans a bilaminar disc is formed[27,30]. At the same time, BMP2 and WNT3 are produced in the posterior visceral endoderm (PVE). BMP4, along with BMP2 and
WNT3(through β-catenin) then induce expression of the mesodermal transcription factor (TF)
T(Brachyury), whose expression is maintained from there on[31]. This, together with BMP4 triggers PR domain zinc finger protein 1(PRDM1) positive (+) and PRDM14+ cells to differentiate in the proximal-posterior most region of the epiblast[32,33]. Thereafter, PRDM1 binds directly to the genome to repress somatic and mesodermal genes [34]. These PRDM1+ cells are restricted to the posterior visceral endoderm (PVE), due to the inhibitory effect of BMP antagonists such as cerberus1(CER1), left-right determination factor (LEFTY1) and WNT antagonists. PRDM1 along with TFAP2C, it´s downstream target cooperates with PRDM14 to activate the transcriptional circuitry of PGCs[32,35–37]. BMP8B produced in the ExE prevents the anterior visceral endoderm (AVE) from reaching the posterior epiblast. Contributing to an environment permissive for the specification of PGCs and where BMP signalling is effective towards PGC fate, thus, ensuring PGCs are specified in the adequate location. In the absence of a fully operational AVE, PRDM1+ cells, are induced also in the anterior epiblast. It is not clear through which exact signalling molecules of which pathways PRDM1 is induced in the mouse.
SOX2 is thought to contribute to this phenotype, and to PGC specification in mice or rodents in
general. It is known however, that this gene is essential to mPGC differentiation and proliferation in vitro, an effect arising from the experimental impairment of these events [1,27,38,39].
In human, although much less is known about the specification of hPGCs, significant progress has been made[1]. It is estimated to take place inside the 2-3 weeks post-fertilization(wpf) interval, a period corresponding to Carnegie stage 7[40]. Studies in hPGCs and hPGC-Like Cells(hPGCLCs) have been able to assemble a pathway that explains how hPGCS are specified. The authors of these studies were able to do so by culturing the cell types mentioned above in vitro in various modes. Irie et al. Cell (2015) obtained hPGCLCs through culturing of embryoid bodies/embryoids(EBs), Sasaki et al. (2015) and Yokobayashi et al. (2017) used floating aggregates preceded by incipient mesoderm-like cell (iMeLCs) induction[34,41–43]. From these studies, it was concluded that WNT signalling induces expression of EOMESodermin (EOMES) on cells on the posterior side of the epiblast. Following this event, SOX17 starts being expressed cell autonomously in cells in which EOMES has been induced and, before that, T. Ultimately, SOX17 is responsible for the expression of
PRDM1, which in turn, represses mesodermal and endodermal somatic fates and enables the
germ cell fate[34,42].This signalling however, cannot be studied in vivo, as ethical constrains prevent any possible observations that could be made with human embryos during gastrulation[9]. BMP4 and BMP8B are also expressed in humans, being that, BMP4 signalling is restricted spatially, as in the mouse. The areas responsible for the formation of this domain are suspected to be distinct from the ones in the mouse. In the case of humans, signalling is
5 thought to occur similarly to rabbits[1]. The WNT3 signals are thought to originate from the posterior epiblast and hypoblast, whereas, BMP4 and BMP8B are expected to be expressed form an area surrounding the epiblast[27]. This interplay is thought to cause the same effect as in the mouse, that is, BMP signalling has the highest levels of effect in the posterior epiblast[27]. The exact in vivo signalling responsible for PGC specification is still unknown in humans. Knowing this, methods that allow the creation of a window into the stage of gastrulation are fundamental to understand the signalling at the root of specification. Similar to the narrow time window in which PGCs are specified, shortly afterwards, PGCs start migrating. At this stage a portion of the signalling is thought to remain active since specification[27,44].
1.4 – Migration
Having been specified, PGCs initiate a collective movement from the posterior region of the epiblast to the gonadal primordium (sexually undifferentiated gonad). The migration of PGCs has been studied in mouse and human, having been divided into three stages ([45], 1989). These are named: Separation Phase(early), the transition of the cells from gut epithelium to mesentery ECM; Migratory Phase(mid), the span cells take to reach the crest of the bipotential and lastly; the Colonization Phase, when cells move into the gonadal primordium(late)[46–48]. Immediately after mPGCs are specified at embryonic(E) day 7.25, DNA demethylation and imprint erasure have not been initiated yet. Not long after, PGCs initiate a collective migration, using the epithelium of the hindgut and dorsal mesentery to move towards the gonadal ridges at E8.0-8.5. At this point in time, mPGCs undergo reacquisition of pluripotency and genome-wide epigenetic reprograming. This reprogramming is accompanied by proliferation of PGCs, which, in the human homolog, occurs from approximately 4wpf[44]. This epigenetic reprograming is extensive as all imprints are erased along with gene expression repressive marks(methylation), with the first occurring around colonization[49]. In mouse, as in human, a recent study on hPGCs by Eguizabal et al. (2016) noted that H3K27me3(repressive) increased from 6 weeks onwards, while H3K9me2(activating) decreased in females, contrary to their observations in male cells for the latter histone modification[50]. On the other hand, Gomes Fernandes et al. (2018) were able to characterize migrating hPGCs at 4.5 weeks, corresponding to Carnegie stage 12-13. This latter study tested a comprehensive panel of markers showing that H3K27me3 is found in a perinuclear location/coating the nuclear envelope[51].
Around this age, 5-methylcytosine(5mC) and Ten-Eleven Translocation methylcytosine dioxygenase enzymes (TET enzymes), 5-hydroxymethylcytosine(5hmC) are detectable. DNA methylation maintenance is concomitantly suppressed through repression of novo DNA methyltransferases (DNMT3A, DNMT3B), and UHRF1 in hPGCs, in addition to passive demethylation with each cell division due to downregulation of DNMT3A and DNMT3B[44,52– 54]. During the demethylation process, the genome becomes susceptible to disruption of chromatin reconfiguration due to random repetitive transposable element (TPE) reintegration. TPEs are known to be repressed by DNA methylation, but they can also be degraded by small non-coding RNAs (sncRNA). P-element induced wimpy testis-like (PIWIL) are the sncRNAs in question and they are the main silencers of TPEs (Yang and Wang, 2016a). The silencing of TPEs is the result of PIWIL molecules complexing with piRNA silencing complexes(piRISC) of the Argonaut family. An association that causes degradation by cleavage of target upon
6 complexing[55–57]. Three paralogues are found in mice, known as PIWIL1, 2 and 4, while humans contain an additional one coded in the genome, PIWIL3[58]. Along with these markers, a study using other markers found in the literature, such as TFAP2C, POU5F1, PDPN, ALPL and PRDM1 also proved to be reliable. Additionally, one other study had previously observed that expression of some of those genes seems to be maintained at noticeable levels while PGCs migrate[44]. Migration specific markers integrating signalling pathways previously documented were validated as well, such as, integrinα6(ITGA6), P-element-induced wimpy testis Like 4(PIWIL4) and KIT. As well as, CD38, a surface marker previously used to sort hPGCLCs[34,51].
It has been suggested that extracellular matrix (ECM) molecules take part in aiding and directing PGCs in their migration. Namely, fibronectin and laminin[59,60]. These proteins have been detected in the migratory path of PGCs, on the surface of somatic cells that PGCs migrate on and on cellular processes of PGCs[59,61,62]. In the mouse, migration occurs along a discontinuous basement membrane underlying the coelomic epithelium[63], which is coated by type IV collagen, strongly adhesive laminin[64,65], proteoglycans[66], and fibronectin[59]. Other proteins such as, proteoglicans, laminin and tenascin are also present throughout the migratory route. The α1 chain of laminin is found in all segments of the migration route and in all stages. This chain/subunit is also found to be the most adhesive one for mPGCs [67]. This points to a role of ECM in directing PGCs towards the genital ridges and to the bipotential gonad[68].
mPGCs also express cadherins (CDHs)[69], platelet endothelial cell adhesion molecule-1 or PECAM-molecule-1[70], α6, α5, α3 and βmolecule-1 Integrins (ITGs)[7molecule-1]. Embryos show expression of integrin subunit α3, α6, αv and β1 during mPGC migration. However, the absence these subunits cause no serious defects in the migratory phenotype. Integrin receptor subunits αv and β3 regulate the binding to ECM molecules found to be in the route of mPGCs, such as fibronectin and laminin[72,73]. Mouse embryos lacking the β1 integrin subunit arrest early in development, shortly after implantation[74,75]. Although the expression of these genes has been previously linked to PGCs, very few have been validated. One such gene is ITGA6, for having been used successfully by few studies using human fetal material or human cells [34,51]. Taking these studies together, it is possible to notice that there is a lack of information concerning the expression of most of these genes in human.
Figure 1.4. C orrespondence be twe e n the de ve lopme ntal stage s thre e mammal spe cie s. Correspondence of
embryonic days enables a comparison on when events take place, such as, implantation. Additionally, this table intends to give the reader a bridge to understand why certain ages of model organisms are used as a proxy to comprehend those events in human. Adapted from[76].
7
1.5 – In vitro generation using hESCs and hiPSCs
Protocols aiming for the differentiation of PGCs in vitro occurred only in recent years with more success by using embryonic stem cells(ESCs) from mouse cultured in medium with two inhibitors(2i) through TGFβ (BMP) pathway stimulation, among others[19,34,43]. Mouse ESCs(mESCs) are known to be heterogeneous, even when cultured with two inhibitors (2i) and human ESC´s are also documented as somewhat heterogeneous[77–79]. These cells can fluctuate between states of naive or primed pluripotency, giving rise to different populations within the culture. Additionally, hESCs are a lot more heterogeneous than mESCs [80]. However, the 2i condition is still very effective in keeping hESCS homogeneous[81,82].
Ultimately, the efforts behind these protocols have managed to generate PGC-like cells, also known as PGCLCs. This designation arises from transcriptomic data comparisons to cells extracted from fetal gonads, human PGCs (hPGCs), as well as, mPGCs[44,83]. Most protocols mentioned to this point in this section are based on the stimulation of embryos or cells in culture using BMP4 and BMP8b. This was first described by Hayashi et al. (2011), one of the first studies to achieve PGCLC differentiation[84].
Most of the in vitro grown PSCs, hiPSCs or hESCs, are alkaline phosphatase (ALPL)+ colonies and share the expression of pluripotent regulatory genes, POU5F1, SOX2, and
NANOG. Stem cells in vitro are generally assigned to two states according to regulatory
signalling pathways and morphology. The described states of pluripotency are designated “naïve” and “primed”, respectively. The naïve cell type requires leukaemia inhibitor factor (LIF) to maintain itself and forms a compact dome-shaped colony. hiPSCs, as opposed to naïve, are not dependent on LIF, since they are not responsive to it[85]. They are, however, sometimes dependent on bFGF and form larger flattened colonies. Primed cells incur in a significant extent of apoptosis when passaged as single cells. Mouse ESCs and EpiSCs in particular represent post-implantation epiblast blastocysts; both express POU5F1 but are driven by a different enhancer[1,86]. In the case of human PSCs, pluripotency genes, such as, POU5F1, SOX2, and
NANOG, are expressed commonly across all states(primed-naïve). These genes are also
expressed by in vivo PGCs, as such, they do not constitute good PGC markers by themselves. Other pluripotency markers are also shared by in vitro cultured pluripotent cells, as is the case for SOX2 in mPSCs, hPSCs and mPGCs. This gene is characteristic of primed hESCs, and thus can be considered to differentiate both cell types in vitro[1,85,87]. The glycosphingolipids SSEA-1 and SSEA-4 are also regarded as pluripotency markers although they are not required in order to maintain it. Although, they are not expressed in in vivo hPGCs[51,88].
Different studies have shown that hESCs and hiPSCs express a panel of markers in common with those of PGCs. The markers included in this common panel are composed by SSEA-4, POU5F1, NANOG, STELLAR (stella‐related) , ALPL, and PRDM1, NANOS1,
NANOS3, DAZ, DAZL in some ESC lines, and C‐KIT, but not SSEA1, CXCR4, and VASA
(DDX4) or synaptonemal complex protein 1 and 3 (SYCP1 and SYCP3) markers of pre‐ and meiotic germ cells. ESCs and iPSCs also express markers exclusive to these types of cells. Among them, SSEA-3, tumor rejection antigen 1–60(TRA-1‐60), TRA-1‐81, and SOX2 can set
8 hPSCs apart from PGCs, since they are not expressed in vitro or in Vivo [1,89,90]. Setting PGCLCs apart from undifferentiated or hESCs/iPSCs in the process of differentiating by sorting with antibody combinations for SSEA-1, SSEA-4 and C-KIT, and CXCR4 have been used[91– 93]. Using mESCs/iPSCs, PGCs can be isolated using intrinsic cell-surface markers, integrin-β3(ITGB3 gene) and SSEA1[84]. However, it remains unclear if these cell surface markers can be used to sort hESCs/hiPSCs. In addition, although cell sorting based on these cell-surface markers is useful and convenient, the expression of these markers is not exclusive to germline cells.
According to Irie et al. (2015) hPGCLCs share similarities with hPGCs in terms of gene expression, concerning genes such as, PRDM1, NANOS3, ITGB3 and KIT. Other pluripotency related genes were also common in both cell types, for example, OCT4 (POU5F1), NANOG and
PRDM14[34]. In a study by Kerr et al. (2008), germ cells were analysed for genes expressed
specifically after colonization. These were shown to express stem cell markers like stage-specific embryonic antigen (SSEA)-1, SSEA-4, EMA-1, and ALPL. A minority of those (<1%) expressed POU5F1, CKIT, and NANOG[94]. On the other hand, SOX2 is not detectable in human gonadal germ cells[38].
1.6 – Existing 2D and 3D methods
In order to study PGC development and their specification, a method that replicates gastrulation in vitro as closely as possible is necessary. This is due to an increasing need to develop models in vitro to study the processes that occur early during development, at the time of gastrulation. Using human pluripotent stem cells to mimic this developmental period in vitro would create an important information source. Recently, two groups have used the method of “embryoid bodies”(3D) to study early PGC formation[34,95]. However, this method consists of making a compact ball of cells that can eventually cavitate. This method is suitable to study mouse early development and recently the inclusion of several types of stem cells (embryonic stem cells, trophectoderm stem cells and trophoblast stem cells) and has led to the formation of the so-called “artificial embryos”[96,97].
In contrast to mouse embryos that are “cup-shaped”, human embryos are “flat-shaped”. Hence, optimizing models to mimic early development with a flat geometrical configuration would be beneficial to faithfully understand the molecular mechanisms taking place. The 2D method developed by Warmflash and colleagues provides an interesting tool to explore to understand human PGC formation[98–101]. This model describes the differentiation of cultured human pluripotent stem cells that are confined to micropatterned areas. These micropatterned areas consist of extracellular matrix proteins, such as laminin and fibronectin. Careful modulation with WNT, BMP and TGFβ signalling resulted in concentric radial domains of cells expressing ectoderm, mesoderm, endoderm and extraembryonic ectoderm markers. The micropatterned culture wells are used to create a platform for cells to sense each other mechanically and indirectly, using short range diffused signals (paracrine). Through this, colonies differentiated and mounted an organized response to a stimulus similar to a gastrulating embryo[102]. The addition of BMP4 to the medium initiates waves of differentiation on the periphery of colonies, which move towards the centre as the stimulus continues to be present. These colonies end up developing a primitive streak like structure after 52h, making this a good method to study events during mammalian gastrulation. Definitive endoderm marker SOX17,
9 which is also critical for PGC specification, is found to be expressed in the micropatterned colonies, after starting from PSCs[42,98,103]. The expression of SOX17 motivated to the formulation of the hypothesis which follows. This study proposes that cells expressing both
SOX17 and pluripotency marker POU5F1 could be differentiated using the chips. Because germ
layers can already be distinguished at 48h, micropatterned chips will be seeded w ith cells to be cultured in a mode based on the micropattern based method[98,99].
The 2D protocol developed initially by Warmflash et al. (2014) fits these requirements according to tests performed by the authors. These authors showed that differentiating micropatterned hESCS colonies leads the to develop all three germ layers concentrically (ectoderm, mesoderm, endoderm and extraembryonic ectoderm)[98]. For this study hiPSCs and hESCs will be used. To this moment, no protocols using hiPSCs have been attempted with the goal to generate patient specific PGCs and, if successful their use can contribute to future protocols.
1.7 – OBJECTIVES
The objectives to be achieved during this project are:
1. Determine which PGC markers from the literature are supported by a bioinformatics analysis of existing Datasets containing germ cells;
2. Determine which genes of adhesion receptors and ligands are expressed by PGCs at 4-5wpf; 3. Study which epigenetic factors, are likely to contribute to PGC phenotype;
4. Determine if other novel markers characterize the germ cell fate.
Some of the information on PGC gene expression comes from human embryos analysed at the single cell level. Such analysis has been performed on embryos as young as 4wpf, which corresponds to an age when PGCs are migrating[104]. Hence, the possibility to investigate such data will be highly informative and requires the analysis of data describing those ages or earlier. The analysis of a dataset constructed by Li et al. Cell (2017) and markers for PGCs gathered by reviewing literature on the development of this cell type will be evaluated for reliability. On the other hand, the analysis of a dataset by Messmer et al. Cell (2019) will allow compar ison of the cell types in Li et al. Cell (2017) with PSCs, primed or naïve. Genes will be discarded if their expression is not consistent in a specific group of samples (germ or somatic cells) or reinforcing them as candidates to detect PGCs if the opposite is verified. From the first dataset, the earliest ages will be considered and chosen as representative to fundament the choice of markers[87,105].
By resorting to these methods, it is expected that the information obtained can contribute to the present knowledge on the early stages of gametogenesis. It is also expected that by doing so, new directions in medical assistance to reproduction can be uncovered.
10
2. Materials and Methods
2.1 scRNA-seq dataset analysis
The single cell RNA-sequencing(scRNA-seq) datasets analysed in this study to extract gene expression information were Log2 transformed versions (TPM/10+1). Where TPM (transcripts-per-million) values were obtained as the number of unique molecular identifiers (UMI) of each gene divided by all UMIs of a given cell. The resulting value was then multiplied by 1,000,000.
2.1.1 scRNA-seq dataset analysis: Germ cells vs somatic cells
This dataset and the UMI counts data frame (DF) were obtained from the Li et al. (2017) study Github page: http://github.com/zorrodong/germcell. Raw sequencing data can be downloaded from accession number EO: GSE86146. TPM values were divided by 10 because the UMI number of most of the single cell samples did not reach the order of 1,000,000 transcripts. Which was a criterion for ruling out cells according to the authors, no further explanation was disclosed by these authors[105]. Annotation to complete the information displayed about gene expression in this study was produced from information eXISTing in the dataset.
2.1.2 scRNA-seq dataset analysis: primed cells vs naïve cells
In addition, a scRNA-seq composed of naïve, primed cells and an intermediate population with characteristics of both from Messmer et al. (2019). Raw counts were normalised as in the Li dataset. This dataset was obtained as raw counts through the accession number: ArrayExpress: E-MTAB-6819. The original code that was obtained from the Github page: https://github.com/MarioniLab/NaiveHESC2016 and adapted to this study. Furthermore, this data, with this composition of cells was chosen with the intent of comparing the epression of established PGC markers in PSCs. For the Messmer et al. (2019) data set, annotation was produced from data table 3 and is referred to in the text, including figure legends, as metadata[87].
The open source software R, version 3.5.3, was used to perform all analyses on the datasets. Packages used to wrangle and prepare the data for plotting gene expression in heatmaps included readxl, dplyr, tibble and R base functions. Function chosen to output the expression data was Pheatmap, which received as inputs: gene vectors, to select what expression data of which genes to include; and annotation from a DF generated separately with additional information concerning each cell, when further distinction between cells was necessary.
11
2.2 hiPSC colony growth analysis
All statistical analysis concerning size of colonies grown in culture plates were performed in excel, including two-way ANOVA. Means and standard deviation were also calculated using the same software.
2.3 Culture of hiPSCs
Daily maintenance – Cells were refreshed with 3ml of TeSR-E8 culture medium and checked with an inverted microscope for any visible contamination and differentiation.
Passaging of cells – New 6-well culture plates were prepared in the previous working day, by adding a cold solution of Laminin-521 and placing them at 40C until they are needed. Preparation of the laminin solution was made as follows. First, 950 µl per well of PBS+/+ at 40C is added to a tube, followed by 50 µl per well of Laminin-521 and homogenization inside the flowhood. Once homogenized, 1ml of Laminin-521 solution was added to the wells intended for use and the plates were placed at 40C (cold room). All steps required to make the Laminin-521 solution were performed using ice cold pipette tips to avoid Laminin-Laminin-521 polymerization inside and assure the correct concentration for use. On passaging days, the Laminin-521 plates were put in the incubator (370C) for at least 2 hours for Laminin-521 to polymerize on the bottom of wells. While this happened, in the flow hood, culture plates were observed for suitable colonies. Afterwards, the culture medium was replaced with Gentle Cell Dissociation solution and left for up to 4 minutes or until small orifices were observed in the colonies. Non-suitable colonies, meaning ones with differentiation w ere removed with a pipette tip during this period. Any colonies too small were left untouched. To stop the effect of the dissociation solution, this was then replaced with 1ml of culture medium. At this point, suitable colonies were scrapped off using a pipette tip and left shortly in the wells while their destined wells were prepared. Lastly, the excess of non-polymerized Laminin-521 was taken out, replaced with 1ml of medium and 1ml of cells was then seeded after a soft resuspension. This protocol was repeated every 3 days.
2.4 Differentiation of hiPSCs and hESCs
The main method used in this project relied on applying extra cellular matrix (ECM)-coating layer that enables cell attachment only inside a defined and uniquely shaped area that repeats itself. This forms a pattern on the culture surface, in this case, a coverslip meant to lay on a well. As an alternative, ready to use micropatterned chips are commercially available from the CYTOO company. These were chosen instead, coated with circular fibronectin shapes varying in diameter(80-1000µm), to perform the experiments on micropatterns.
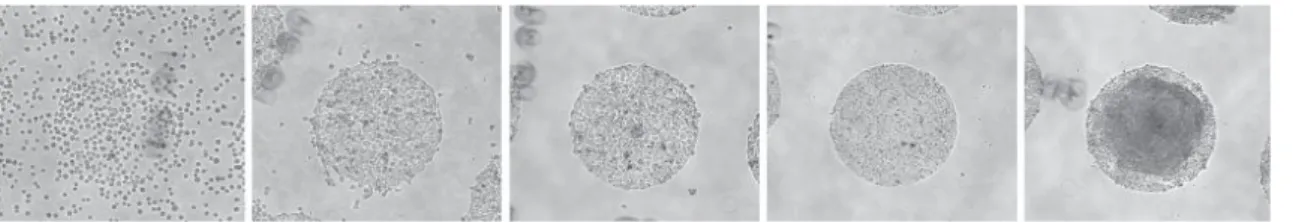
12 Cells were seeded using steps based on the ones developed for hESCs, by Warmflash et al. (2014) and described in detail by Deglincerti et al (2016). Starting with the making of a small clump suspension from cells ideally at or near confluence (Fig. 2.1). Using such an approximate concentration, cells were seeded in the micropatterns. When these conditions were met, cells were differentiated through mTeSR1+5%Penicilin/Streptomicin(mTeSR1) culture medium with BMP4 (50ng/ml). After approximately 72 hours, a span of time considered to be sufficient for differentiation, the cells were fixed with 4% paraformaldehyde (PFA) and immunostained.
Figure 2.4. Differentiation of hiPSC s and hESC s on micropatte rns. Expected progression of coverage of the
micropatterns by hESCs and hiPSCs fom the moment of seeding of Cytoo chips. Images correspond to, from left to right: 10 minutes, 2 hours, 2,5hours, 20hours and 68hours after seeding (from Deglincerti et al. (2016)) [99].
2.5 Differentiation of hiPSCs and hESCs: Micropattern seeding and differentiation
Cell lines used:
WIS1 – Primed hESC line obtained from the Hanna lab, Weizman Institute.
Cl002 – Primed hiPSC line obtained from the LUMCs iPS Facility, led by Christian Freund and Harald Mikkers.
Micropatterned chips used:
Cytoo Arena micropatterned chips – Manufactured by and ordered from the Cytoo company.
Maintenance and passaging
The WIS1 cell line was passaged once a week for maintenance, with a ratio of 1:1, 1:10 when passaging to 12-well plates with coverslips and 1:6 when passaging to Cytoo chips. WIS1 cells were kept on Matrigel while on maintenance wells and for differentiation experiments on coverslips.
Cl002(Control 2) cells were kept on 6-well plates coated vitronectin, as maintenance, by the iPS Facility. These cells passaged according to a 1:6 ratio to full new 6-well plates, from 1 6-well well and were then received for further maintenance or experiments.
13 First, Cytoo chips were kept in 6ml PBS+\+, in a small petri dish, until cells were added. Afterwards, 2ml of mTeSR1 medium from the refreshing cells in the previous day from each well was removed. 1ml PBS+\+ was added for washing and replaced by 1ml Gentle Cell Dissociation Solution. This solution was left on the well for 3 minutes and 1ml of mTeSR1 medium was added to each well, wells were then scrapped using the cell scrapper. After this, hESCs and hiPSCs were resuspended by pipetting up and down. 300µl of cell suspension was added to each Cytoo chip, carefully, in order to create a dome with the shape of the Cytoo. Once the dome was established and starting in the areas not covered by the chips and making sure these areas contact was made with the dome slowly, preferably through the formation of multiple contact points (objective: decrease cell disturbance). mTeSR1 medium was added, totalling 2ml per dish. The 2ml were left in the dish for 5h and then refreshed with mTeSR1 medium + BMP4(50ng/ml).
Part I: WIS1
Cells were first passaged using the same method as the chips. Differences were related to the coating and amounts transferred to each well. WIS1 cells were passaged from matrigel coated 6-well plates to 12-well plates with matrigel coated coverslips, in 100µl of cell suspension to recipient wells with 900µl.
Part II(D3B4): Cytoo chips and coverslip 12-wells
Finaly, the cells were left to differentiate for 3 days in the medium just mentioned. This period of differentiation was named D3B4 and three conditions were derived from its combination or not with 24h of cell growth. Refreshment off differentiation medium was performed daily, at the same time, except when this period encompassed weekends.
Part II(24h+D3B4): Cytoo chips
The 24h growth period was performed prior to differentiation, which was conducted exactly as in the condition described above.
Part II(1wkFN1+D3B4): Cytoo chips
Cells spent one week on a fibronectin coating for adaptation, before being passaged to the chips.
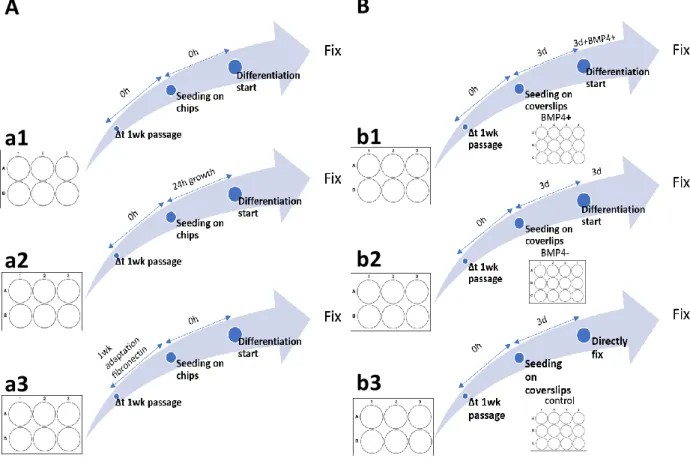
14 Figure 2.5 C onditions that hiPSC s and hESC s we re subje cte d to, prior to immunofluore sce nce . Graphical
version of the protocol decribed for (A) Cytoo chips, with the three conditions tested: a1, D3B4 condition; a2, 24+D3B4 condition and a3, 1wkFN1+D3B4. Using CL002 and hESC WIS1 cells. Graphical version of the protocol decribed for (B) hESC WIS1 cells, with the three conditions tested: b1, 3D+3DB4 condition; b2, 3D+3D condition and 3D condition in b3.
2.6 Immunofluorescence
A panel of antibodies described previously by this lab[51] as well as other labs was used[27,44,51]. Cells were be fixed for 20 minutes at room temperature (RT) in 4% PFA. Followed by permeabilization for 8 minutes at RT, blocked in 1% bovine serum albumin (BSA) in PBST (blocking solution) for 1 hour and incubated with a combination of primary antibodies diluted in blocking solution (BS) overnight(O/N) at 4oC in a humidified chamber. In the next day, the cells were washed with BS for 5 minutes and incubated with a combination of secondary antibodies diluted in BS O/N at 4oC in a humidified chamber. After counterstaining with DAPI in PBST (1/1000), the cells were mounted using prolongold antifade reagent.
A
a1
a2
a3
B
b1
b2
b3
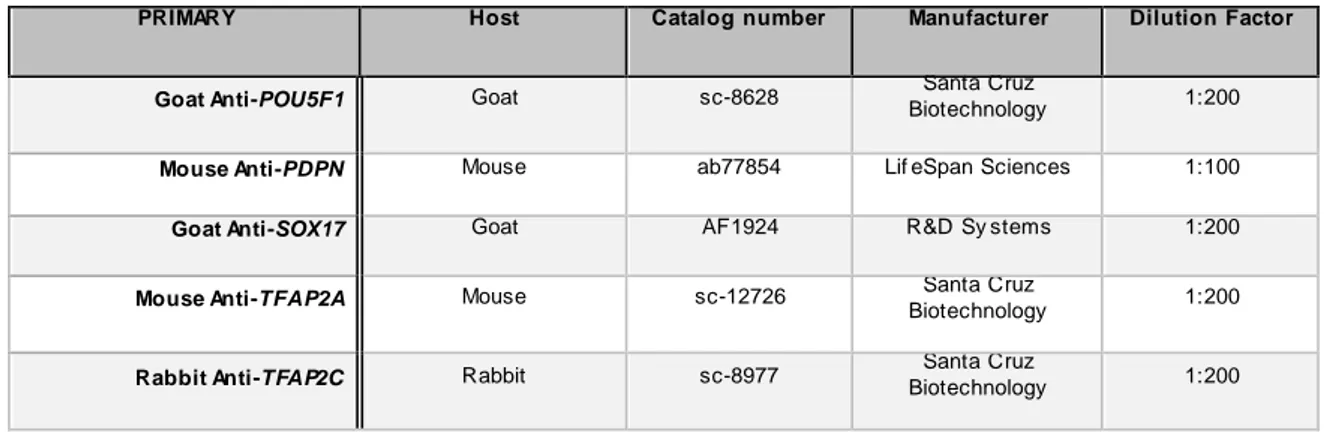
15 Table 2.6.1. Primary antibodies used for immunofluorescence on coverslips seeded with hESCs.
PRIMARY Host Catalog number Manufacturer Dilution Factor
Goat Anti-POU5F1 Goat sc-8628 Santa Cruz
Biotechnology 1:200
Mouse Anti-PDPN Mouse ab77854 Lif eSpan Sciences 1:100
Goat Anti-SOX17 Goat AF1924 R&D Sy stems 1:200
Mouse Anti-TFAP2A Mouse sc-12726 Santa Cruz
Biotechnology 1:200
Rabbit Anti-TFAP2C Rabbit sc-8977 Santa Cruz
Biotechnology 1:200
Table 2.6.2. Secondary antibodies used for immunofluorescence on coverslips seeded with hESCs.
SECONDARY Alexa fluorophore Host Catalog
number
Manufacturer Dilution Factor
Donkey Anti-Goat 488 Donkey A11055 Inv itrogen 1:500
Donkey Anti-Mouse 594 Donkey A21203 Lif e Technologies 1:500
Donkey Anti-Goat 488 Donkey A11055 Inv itrogen 1:500
Donkey Anti-Mouse 594 Donkey A21203 Lif e Technologies 1:500
Donkey Anti-Rabbit 647 Rabbit A31573 Inv itrogen 1:500
2.7 Imaging
Image acquisition was performed using a Leica DM6B-Z widefield fluorescence microscope with ColourProc, a LUMC-made software (LUMC, Leiden, The Netherlands) coupled to a Coolsnap Myo CCD camera. For image analysis, all images were saved in TIFF file format and processed using Fiji (version 2.0.0-rc43/1.5k), a software made by Schindelin et al. (2012)[106]. Every cell stained in all the used channels, that gave of signal from the predicted structures and contains a DAPI+ nucleus was considered a potential PGC.
2.8 Statistics
Colony diameters were tested for differences between passages using a two-way ANOVA in excel. P< 0.05 was considered significant.
16
3. Results
3.1 – Expression comparison of genes commonly associated PGC with PGC development scRNA-seq analysis
In order to ascertain which genes, among the ones described in previous studies can be used reliably to detect hPGCs in vitro (see Specification and in vitro generation, section 1), gene expression data of PGCs was plotted. From the genes described by studies in section 1, different lists of genes relating to the processes linked to stages of events defining the biology of PGCs (ex: specification and migration) were compiled. Given the scope of the Li et al. (2017) dataset, the earlier ages whose expression data was collected were chosen. These ages comprised the period between 4 and 5wpf, being that 4wpf corresponds to males (only) and 5wpf to females only. These served as proxy to sex differences, previously described commonly expressed characteristics in the 4-5wpf developmental span. These ages are also the ones closest to the probable interval for hPGC specification, that were collected from whole embryos and were analysed at the single cell level. This makes this dataset the Li et al. (2017) dataset the only one in eXISTence to contain data pertaining the in vivo and to approximate so much on specification events. In addition to this, based on a prior comprehensive analysis of a 4.5wpf embryo by this lab, a preliminary gene set panel was arranged. The intent of these was to provide a starting point to evaluate how many remain afterwards and can be considered from a standpoint, as candidates do detect PGCs.
To further narrow down these gene combinations from the literature, gene expression was analysed using a Log2 normalized dataset from Li et al. (2017). Moreover, these combinations were refined using the Messmer et al. (2019) dataset using the same normalization method[105,107]. The expression of these genes is compared in the plots.
On all plots shown the values coded by the colour scale are in log2 normalized transcripts per million (from here onwards, TPM). These values were divided by ten to account for low abundance transcripts and referred to by the same unit, TPM.
17
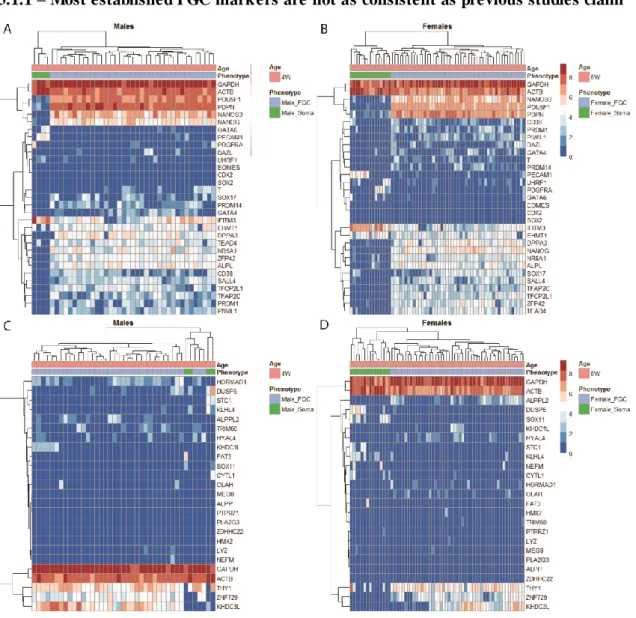
3.1.1 – Most established PGC markers are not as consistent as previous studies claim
Figure 3.1.1. He atmap plots of ge nes e xpected to identify PGCs, early de ve lopment and of naïve plus prime d pluripote ncy state ge ne s in ge rm and somatic ce lls. (A, B) Log2 normalized transcripts per million
(T PM◄T PM/10+1) of PGC gene set at 4 and 5wpf, respectively. (C, D) Genes characteristically expressed in naïve and primed PSCs compared to the initial gene set at 4 and 5wpf, respectively. Cell type labels were made according to metadata constructed from the dataset. Scale refers to relative expression values with blue as lowest expression and red and highest expression. Euclidean clustering was performed according to gene and to sample.
Upon comparing the expression of genes linked to a pluripotent phenotype in combination with genes linked with PGC specification, two cell types are distinguishable. A separate clustering branch is assembled specifically connecting somatic cells, arising from similar gene expression. The same is verified throughout all germ cells, as they are also connected by a large branch, that clusters them together. This branch, however, contains far more sub clusters due to expression variability between germ cells. The genes are also organized into clusters, due to similar expression patterns throughout the cells and differences between groups of genes that are differently expressed. This is exemplified by NANOG,
POU5F1, NANOS3 and PDPN, which show a large difference between somatic and germ cells
(Fig 3.1.1A, BB), being more strongly expressed in the latter. Genes like SOX2, GATA6 showed little to no expression on either analysed age. The first, SOX2, is completely absent in
18 all cells, while the latter gene shows a more elevated expression in 50% of somatic cells at 4wpf and noticeably lower values in two germ cells.
PRDM1(Fig 3.1.1A) and SOX17 (Fig 3.1.1A, B) were among the genes here shown to
have a greater variability in expression levels at these ages. Germ cells within the lower left cluster have, on the other hand, more homogeneous expression levels. Only divided by weaker expressing genes, on the lower sub-branch in that branch. Although these genes were mostly or only expressed in germ cells. PDPN and POU5F1 show the highest levels of expression and are also the most homogeneous. Their expression is not entirely restricted to germ cells, as denoted by the lighter shades of blue from soma cells at 4 and 5wpf, although expression is much lower in these. In addition, they are clustered together by the dendrogram on the left.
When the clustering is combined with sample annotation a signature for germ cells becomes more apparent. This is based on the grouping of cells with similar gene expression profiles (top of plots) the grouping genes with similar expression profiles (left of plots) Of note, this expression of POU5F1 and PDPN in soma is not at all close to the values in germ cells (Fig 3.1.1A, B). Lastly, T can be noticed as a highly heterogeneous and somewhat weakly expressed gene in some positive cells. This type of pattern is also present in the expression of late PGC marker DAZL. This is reflected by other marker genes, namely, UHRF1 and PDGFRA. Due to the heterogeneity shown by other genes described to be markers, further analysis is requiredThis is in part suggested by shared expression of genes here pointed as PGC specific in previous reports on PSC markers[27].
Several protocols so far have obtained PGCs while having started from pluripotent stem cells (PSCs), which is a shared objective with this study. The ability to distinguish PGCs from hESCs or hiPSCs is a requirement, as the hiPSCs will be used for testing PGC detection after 72h of differentiation. From the naïve and primed genes plotted alongside the literature selected panel of PGC markers (Fig. 3.1.1A, B), most are not consistently expressed in hPGCs (Fig. 3.1.1C, D)[107]. HORMAD1(naïve), KHDC3L(naïve), DUSP6(primed) and ZNF729(primed) are exceptions at 4wpf in this aspect, albeit, the former is less homogeneous. However, only
ZNF729 and KHDC3L maintain specificity in the 5wpf (female) cells (Fig. 3.1.1D), while HORMAD1 has lost it. Although KLHL4(primed), STC1(primed), and DUSP6(primed) were
also described as stem cell markers by the latter mentioned study. These genes show higher levels in somatic cells, that are not visible on the few germ cells which show expression. Another primed gene, CYTL1, is more ubiquitous in comparison to the other genes that characterize the same state (Fig. 3.1.1C, D). Although this expression of primed genes is noticed mostly on somatic cells, as opposed to the naïve genes. The latter is characteristically expressed a relatively less differentiated cell type.
19
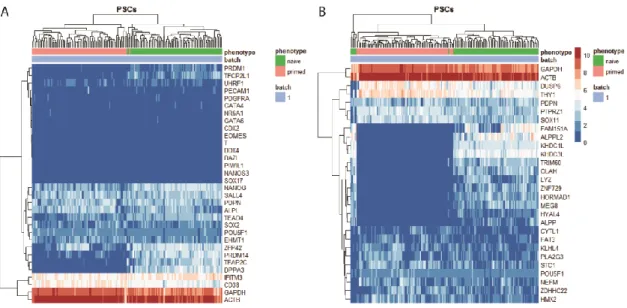
3.1.2 – Most PGC genes are not restricted to one pluripotency state. Nor are all pluripotency state markers restricted to their respective states.
Figure 3.1.2. He atmap plots of ge nes e ncoding prote ins e stablished as PGC /e arly de ve lopme nt marke rs and PSC ge ne s. Log2 normalized T PM (T PM/10+1) of (A) PGC and early development markers, ECM plus adhesion
genes (B) Genes connected to the naive and primed states of pluripotency by Messmer et al. (2019). Cell type labels were made according to adjusted metadata from the dataset. Euclidean clustering was performed according to gene and to sample.
As mentioned in the previous paragraph, to achieve distinction between pluripotent stem cells (PSCs, hESCs and hiPSCs) and PGCs, confirmation on whether PGC markers are expressed in the former cells is crucial. Naïve and primed cells from Messmer et al. (2019) using PGC markers and germ layer marker genes together were compared (Fig 3.1.2A and 3.1.2B). Among the genes compared just above, only TFAP2C, DPPA3 show complete or almost complete specificity for naïve cells. Also, in the same gene cluster, PRDM14 and ZFP42 show still, reduced specificity for naïve cells in comparison with the other two genes. With the expression of the former being more intense in naïve cells, relative to primed. The latter loses distinction power greatly, due to similar expression levels in many of the primed cells. In the cluster above the one containing DPPA3, no gene could be seen being expressed only or mostly on one cell type. Instead, these genes were observed to be expressed in almost every cell, while showing no prominence on either type. Less noticeably, PRDM1 and TFCP2L1 are expressed in more naïve cells than primed. All other genes did not show any obvious or very slight difference between the two pluripotency states (Fig. 3.1.2A).
On the other hand, genes characterizing the states of pluripotency show a clear distinction between the naïve and primed states. This can be noticed by absence of expression of primed genes in naïve cells and greater expression levels in primed cells (Fig. 3.1.2B). Primed genes, however, are not expressed exclusively or with a large difference to naïve cells. At most, some like DUSP6 and THY1, which cluster together, appear to have relatively higher levels of expression. The cells shown belong to a single batch, since the other batches presented issues concerning the expression of POU5F1. Particularly, absence of expression from many cells and inconsistency of expression levels in POU5F1+ cells.
20 Taken together, these results from PSCs (Fig. 3.1.2) show that only two PGC markers (Fig. 3.1.2A) are specific for hPGCs, by themselves (Fig. 3.1.1 and 3.1.2). The same is seen for either pluripotency state, due to many genes not being expressed in one cell type only (Fig. 3.1.2B).
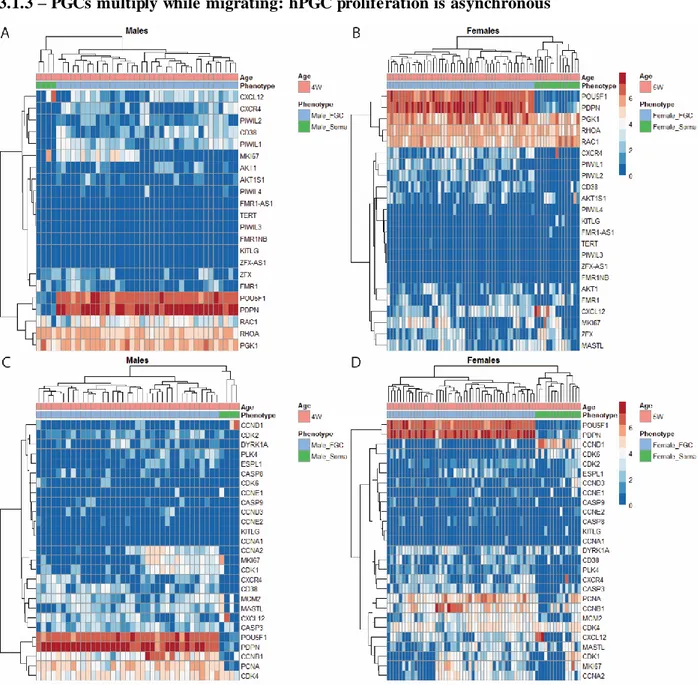
3.1.3 – PGCs multiply while migrating: hPGC proliferation is asynchronous
Figure 3.1.3. He atmap plots of ge nes e ncoding prote ins playing a role in ce ll migration and proliferation. Log2
normalized T PM (T PM/10+1) of (A, B) Genes connected to migration at 4 and 5wpf, respectively. (C, D) Cell cycle genes reprogramming associated at 4 and 5wpf, respectively. Cell type labels were made according to metadata constructed from the dataset . Euclidean clustering was performed according and to sample.
Genes connected to migration (Fig 3.1.3A, B), such as RHOA, RAC1, CXCL12, CXCR4 and KITLG did not show any specificity according to cell type. This is observed although the ages plotted contain hPGC migration activity. Others connected to germ line fate (CD38, AKT), X chromosome (FMR1, ZFX, PGK1). TERT shows almost no expression, that is also characteristic of mPGCs (Fig 3.1.3A, B) [108]. Of the TPE suppressor genes, PIWIL1 and 2 are